| Param | Original file | Final file |
|---|---|---|
| Filename | modeM0/AS1T04_076T01_9000004810_33671cztM0_level2.evt | modeM0/AS1T04_076T01_9000004810_33671cztM0_level2_quad_clean.evt |
| Size (bytes) | 684,751,680 | 77,276,160 |
| Size | 653.0 MB | 73.7 MB |
| Events in quadrant A | 9,789,504 | 220,673 |
| Events in quadrant B | 3,142,973 | 602,419 |
| Events in quadrant C | 3,216,511 | 611,433 |
| Events in quadrant D | 4,258,290 | 561,209 |
| Mode SS | |||
|---|---|---|---|
| Quadrant | BADHDUFLAG | Total packets | Discarded packets |
| A | 0 | 98 | 0 |
| B | 0 | 98 | 0 |
| C | 0 | 98 | 0 |
| D | 0 | 98 | 0 |
| Mode M9 | |||
|---|---|---|---|
| Quadrant | BADHDUFLAG | Total packets | Discarded packets |
| A | 0 | 28 | 0 |
| B | 0 | 28 | 0 |
| C | 0 | 28 | 0 |
| D | 0 | 29 | 0 |
| Mode M0 | |||
|---|---|---|---|
| Quadrant | BADHDUFLAG | Total packets | Discarded packets |
| A | 0 | 32336 | 3 |
| B | 0 | 12399 | 2 |
| C | 0 | 12709 | 2 |
| D | 0 | 16276 | 2 |
| Quadrant | Total seconds | Saturated seconds | Saturation percentage |
|---|---|---|---|
| A | 4887 | 4064 | 83.159402% |
| B | 4887 | 243 | 4.972376% |
| C | 4887 | 120 | 2.455494% |
| D | 4887 | 179 | 3.662779% |
Noise dominated data is calculated using 1-second bins in cleaned event files. If a bin has >2000 counts, and if more than 50% of those come from <1% of pixels, then it is considered to be noise-dominated and hence unusable.
| Quadrant | # 1 sec bins | Bins with >0 counts | Bins with >2000 counts | High rate bins dominated by noise | Noise dominated (total time) | Noise dominated (detector-on time) | Marked lightcurve |
|---|---|---|---|---|---|---|---|
| A | 6979 | 4887 | 3448 | 3448 | 49.41% | 70.55% | 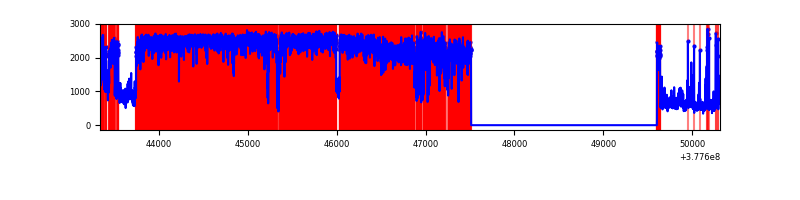 |
| B | 6979 | 4888 | 184 | 184 | 2.64% | 3.76% | 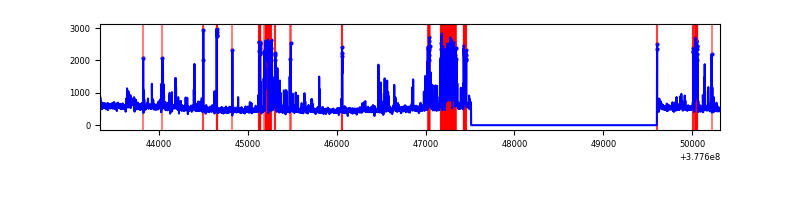 |
| C | 6979 | 4888 | 106 | 106 | 1.52% | 2.17% | 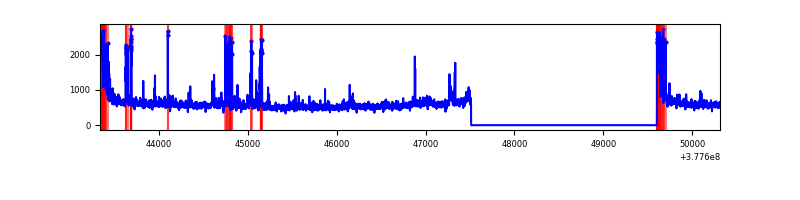 |
| D | 6979 | 4888 | 183 | 183 | 2.62% | 3.74% | 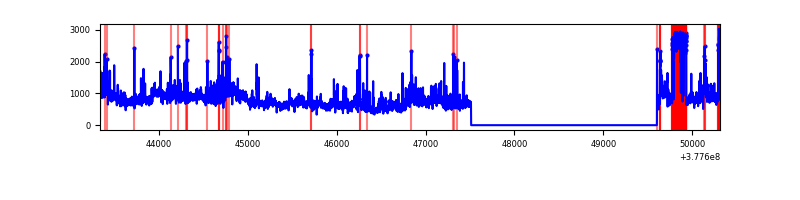 |
Top three noisy pixels from each quadrant. If the there are fewer than three noisy pixels in the level2.evt file, extra rows are filled as -1
| Pixel properties | Quadrant properties | ||||||
|---|---|---|---|---|---|---|---|
| Quadrant | DetID | PixID | Counts | Sigma | Mean | Median | Sigma |
| A | 15 | 169 | 8578180 | 169797.99 | 245 | 241 | 50.5 |
| A | 15 | 237 | 249931 | 4942.55 | 245 | 241 | 50.5 |
| A | 9 | 143 | 5196 | 98.08 | 245 | 241 | 50.5 |
| B | 5 | 172 | 689343 | 6089.95 | 597 | 583 | 113.1 |
| B | 4 | 81 | 27221 | 235.53 | 597 | 583 | 113.1 |
| B | 5 | 255 | 20320 | 174.51 | 597 | 583 | 113.1 |
| C | 3 | 233 | 379634 | 2782.34 | 594 | 601 | 136.2 |
| C | 0 | 10 | 285041 | 2087.97 | 594 | 601 | 136.2 |
| C | 15 | 214 | 226265 | 1656.52 | 594 | 601 | 136.2 |
| D | 8 | 195 | 836272 | 5393.68 | 574 | 563 | 154.9 |
| D | 1 | 52 | 370246 | 2385.94 | 574 | 563 | 154.9 |
| D | 8 | 230 | 352726 | 2272.86 | 574 | 563 | 154.9 |
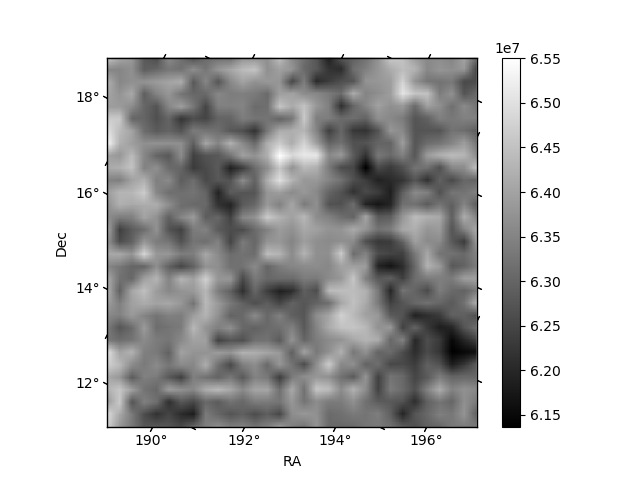
Histogram calculated using DETX and DETY for each event in the final _common_clean file
| Quadrant A | 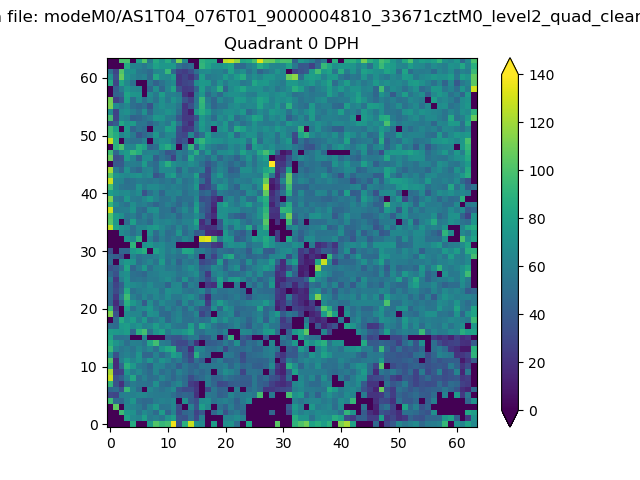 |
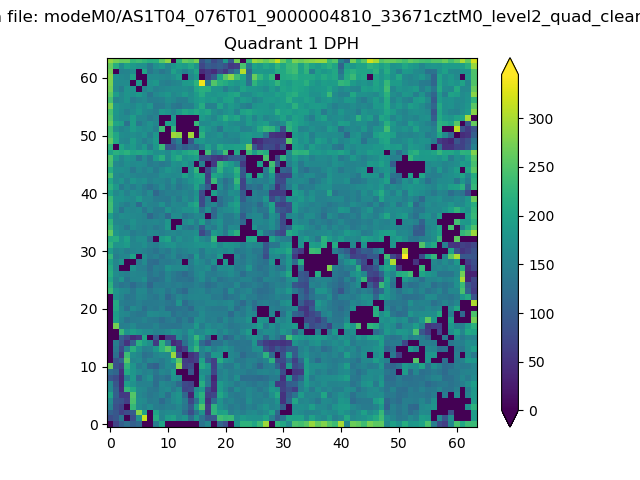 |
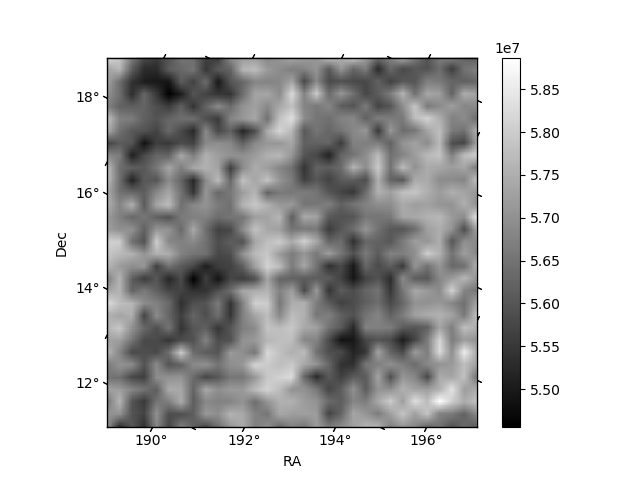
Quadrant B |
|---|---|---|---|
| Quadrant D | 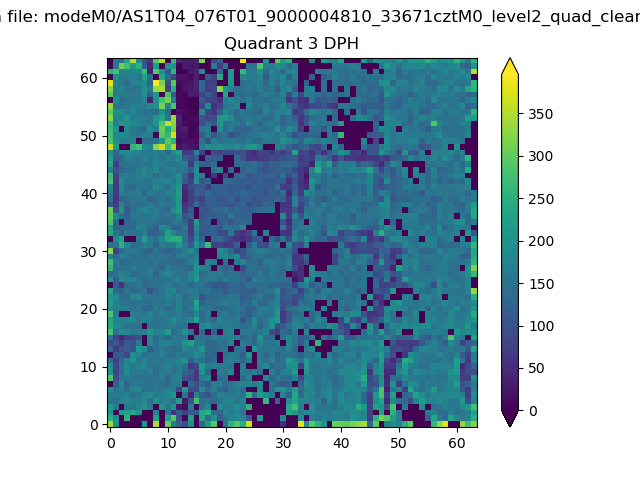 |
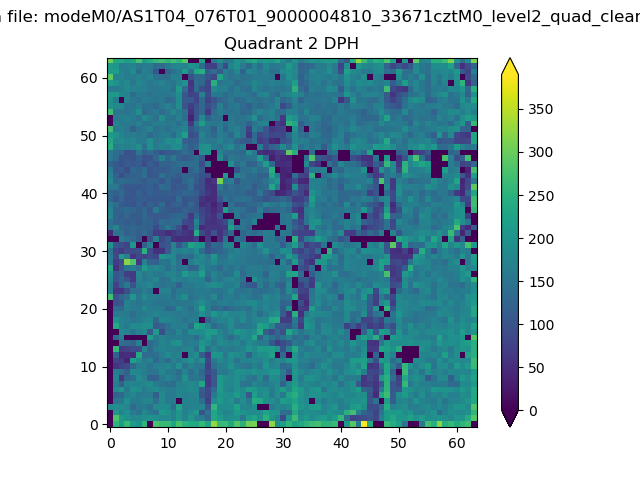 |
Quadrant C |
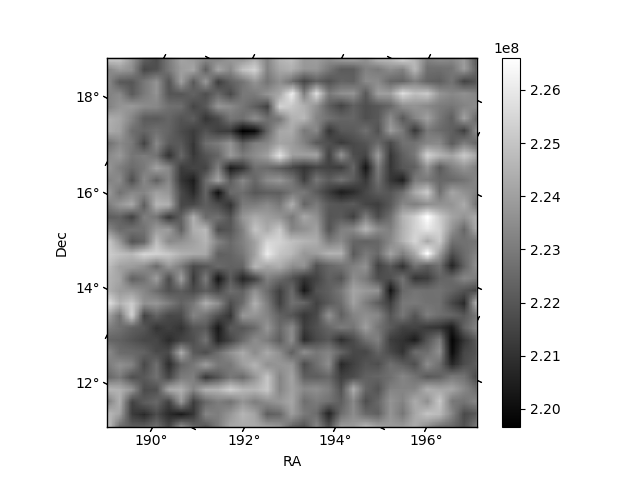
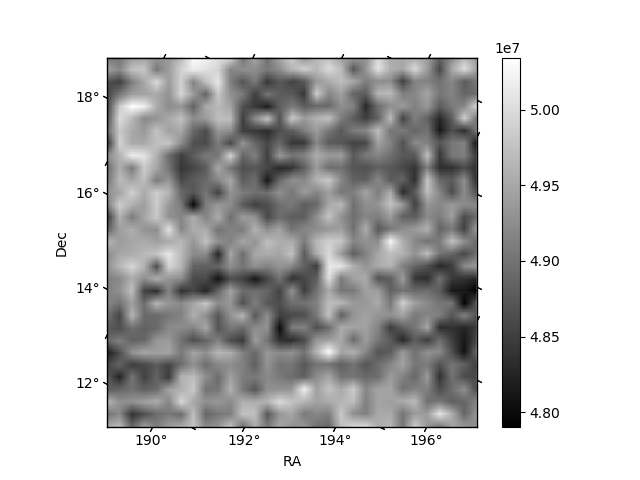
| Plot type | Count rate plots | Images |
|---|---|---|
| Comparison with Poisson distribution Blue bars denote a histogram of data divided into 1 sec bins. Red curve is a Poisson curve with rate = median count rate of data. |
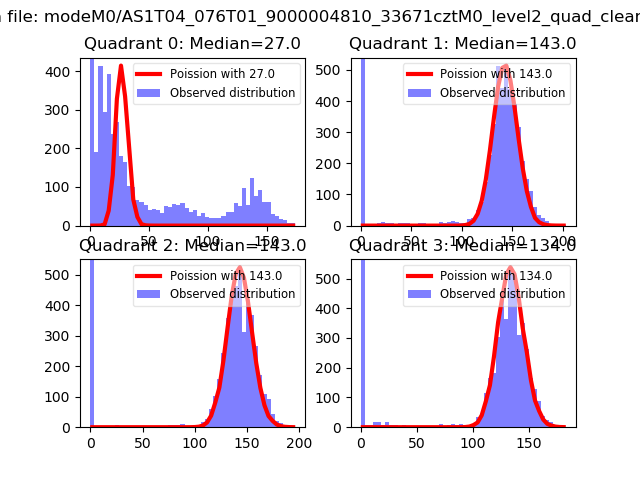 |
 |
| Quadrant-wise count rates Data is divided into 100 sec bins |
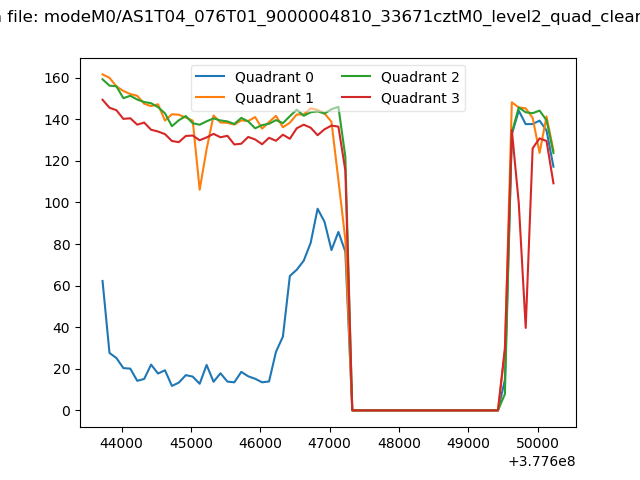 |
|
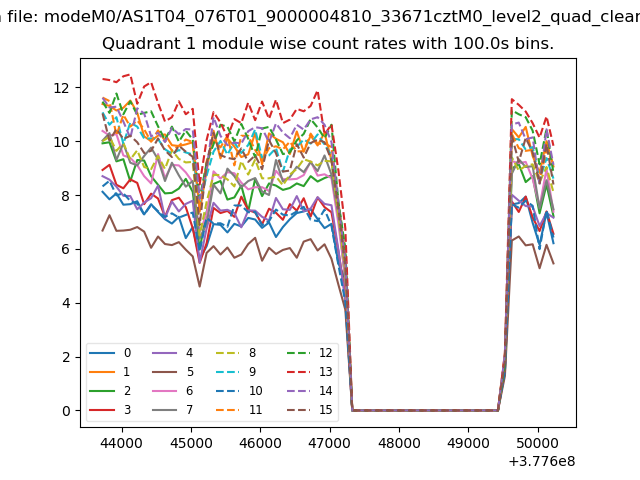
| Module-wise count rates for Quadrant A Data is divided into 100 sec bins |
 |
 |
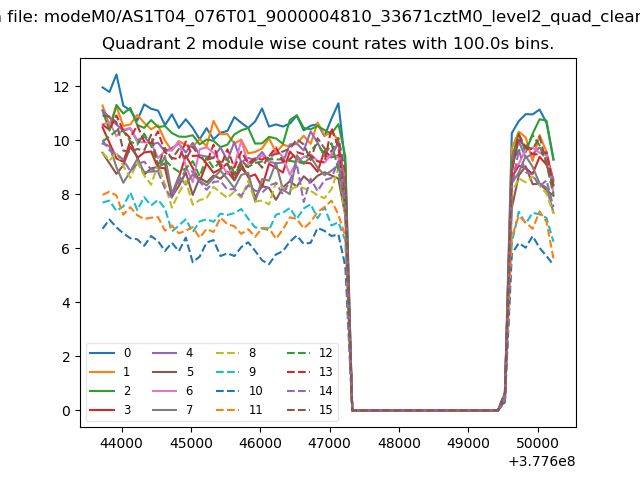
| Module-wise count rates for Quadrant B Data is divided into 100 sec bins |
 |
 |
| Module-wise count rates for Quadrant C Data is divided into 100 sec bins |
 |
 |
| Module-wise count rates for Quadrant D Data is divided into 100 sec bins |
 |
 |
| Parameter | Plot |
|---|---|
| CZT HV Monitor | 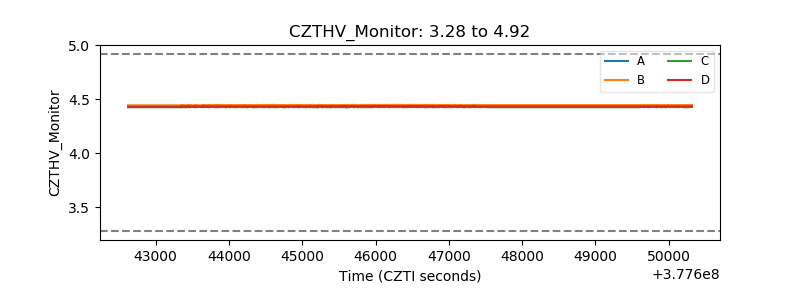 |
| D_VDD | 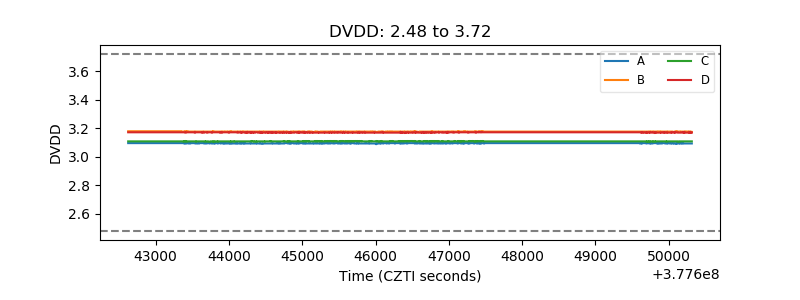 |
| Temperature 1 | 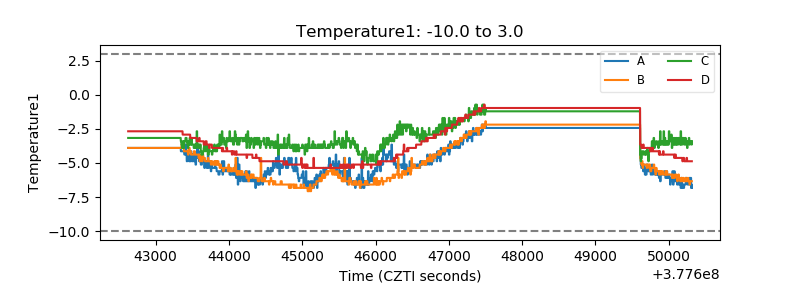 |
| Veto HV Monitor | 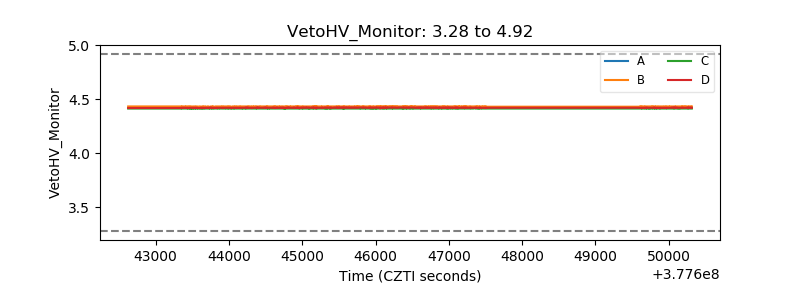 |
| Veto LLD | 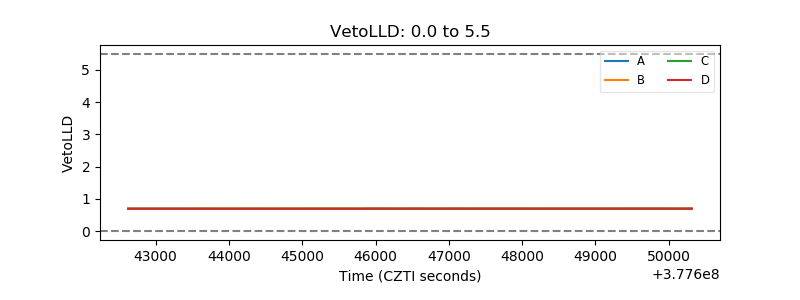 |
| Alpha Counter | 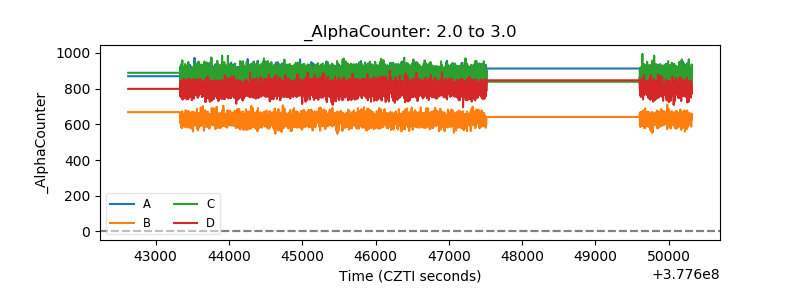 |
| _CPM_Rate | 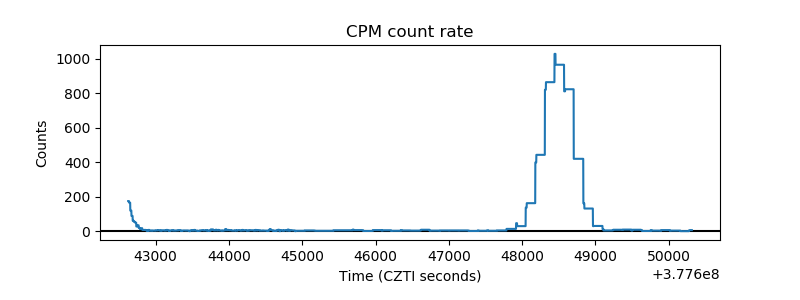 |
| CZT Counter | 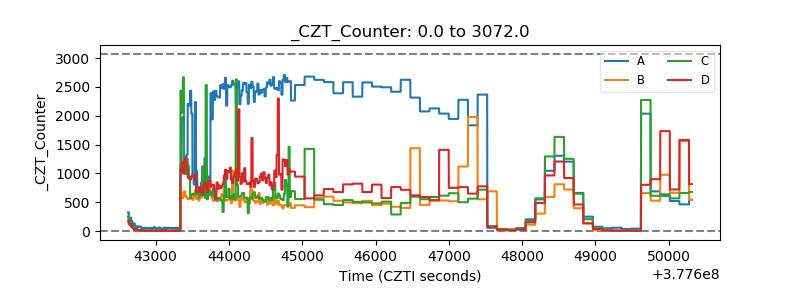 |
| +2.5 Volts monitor |  |
| +5 Volts monitor |  |
| _ROLL_ROT |  |
| _Roll_DEC | 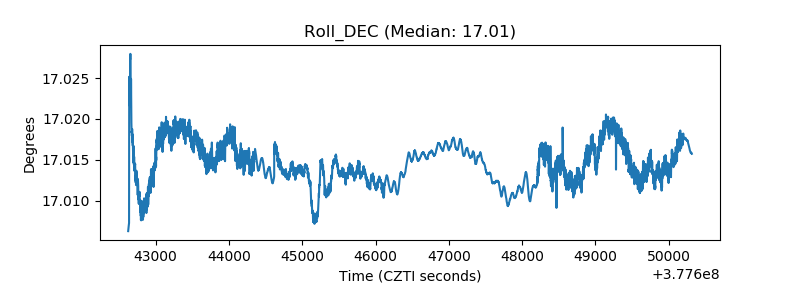 |
| _Roll_RA | 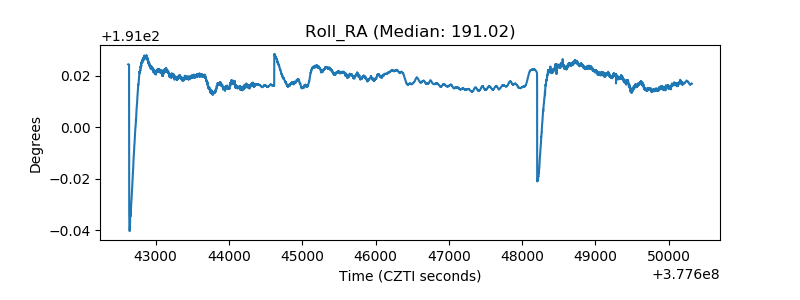 |
| Veto Counter |  |