| Param | Original file | Final file |
|---|---|---|
| Filename | modeM0/AS1T04_076T01_9000004810_33672cztM0_level2.evt | modeM0/AS1T04_076T01_9000004810_33672cztM0_level2_quad_clean.evt |
| Size (bytes) | 625,481,280 | 81,210,240 |
| Size | 596.5 MB | 77.4 MB |
| Events in quadrant A | 7,106,543 | 408,169 |
| Events in quadrant B | 3,390,955 | 575,501 |
| Events in quadrant C | 3,351,879 | 578,798 |
| Events in quadrant D | 4,742,983 | 532,767 |
| Mode SS | |||
|---|---|---|---|
| Quadrant | BADHDUFLAG | Total packets | Discarded packets |
| A | 0 | 106 | 0 |
| B | 0 | 106 | 0 |
| C | 0 | 106 | 0 |
| D | 0 | 106 | 0 |
| Mode M9 | |||
|---|---|---|---|
| Quadrant | BADHDUFLAG | Total packets | Discarded packets |
| A | 0 | 28 | 0 |
| B | 0 | 28 | 0 |
| C | 0 | 28 | 0 |
| D | 0 | 29 | 0 |
| Mode M0 | |||
|---|---|---|---|
| Quadrant | BADHDUFLAG | Total packets | Discarded packets |
| A | 0 | 24576 | 3 |
| B | 0 | 13406 | 2 |
| C | 0 | 13500 | 2 |
| D | 0 | 17947 | 2 |
| Quadrant | Total seconds | Saturated seconds | Saturation percentage |
|---|---|---|---|
| A | 5182 | 2121 | 40.930143% |
| B | 5182 | 248 | 4.785797% |
| C | 5182 | 86 | 1.659591% |
| D | 5182 | 266 | 5.133153% |
Noise dominated data is calculated using 1-second bins in cleaned event files. If a bin has >2000 counts, and if more than 50% of those come from <1% of pixels, then it is considered to be noise-dominated and hence unusable.
| Quadrant | # 1 sec bins | Bins with >0 counts | Bins with >2000 counts | High rate bins dominated by noise | Noise dominated (total time) | Noise dominated (detector-on time) | Marked lightcurve |
|---|---|---|---|---|---|---|---|
| A | 7093 | 5181 | 1757 | 1757 | 24.77% | 33.91% | 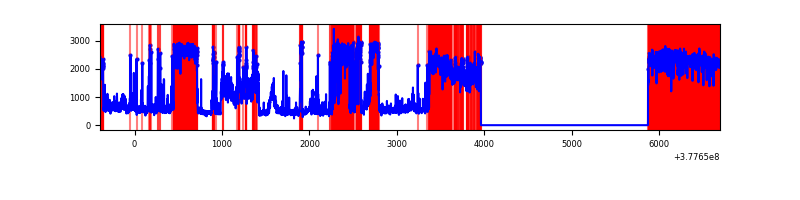 |
| B | 7094 | 5183 | 216 | 216 | 3.04% | 4.17% | 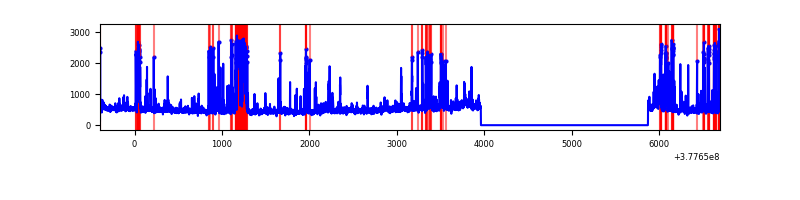 |
| C | 7094 | 5183 | 70 | 70 | 0.99% | 1.35% | 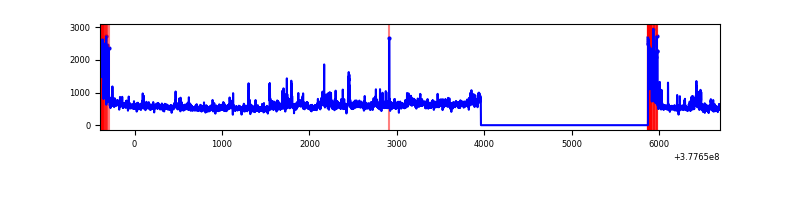 |
| D | 7094 | 5183 | 248 | 248 | 3.50% | 4.78% | 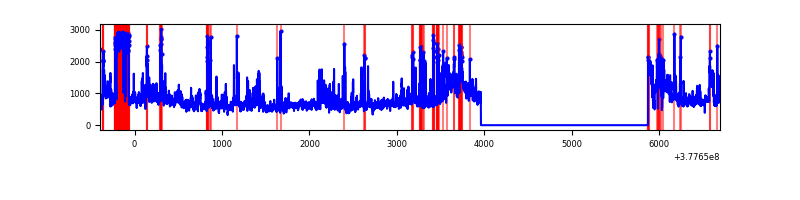 |
Top three noisy pixels from each quadrant. If the there are fewer than three noisy pixels in the level2.evt file, extra rows are filled as -1
| Pixel properties | Quadrant properties | ||||||
|---|---|---|---|---|---|---|---|
| Quadrant | DetID | PixID | Counts | Sigma | Mean | Median | Sigma |
| A | 15 | 169 | 3501800 | 41190.33 | 417 | 410 | 85.0 |
| A | 15 | 237 | 1976933 | 23251.8 | 417 | 410 | 85.0 |
| A | 13 | 254 | 6248 | 68.68 | 417 | 410 | 85.0 |
| B | 5 | 172 | 836278 | 7231.58 | 605 | 590 | 115.6 |
| B | 15 | 201 | 45384 | 387.62 | 605 | 590 | 115.6 |
| B | 15 | 222 | 35455 | 301.7 | 605 | 590 | 115.6 |
| C | 3 | 233 | 453642 | 3237.22 | 600 | 606 | 139.9 |
| C | 0 | 10 | 258400 | 1842.09 | 600 | 606 | 139.9 |
| C | 15 | 214 | 242328 | 1727.25 | 600 | 606 | 139.9 |
| D | 1 | 52 | 779283 | 4893.4 | 575 | 564 | 159.1 |
| D | 8 | 195 | 697515 | 4379.58 | 575 | 564 | 159.1 |
| D | 8 | 230 | 352096 | 2209.0 | 575 | 564 | 159.1 |
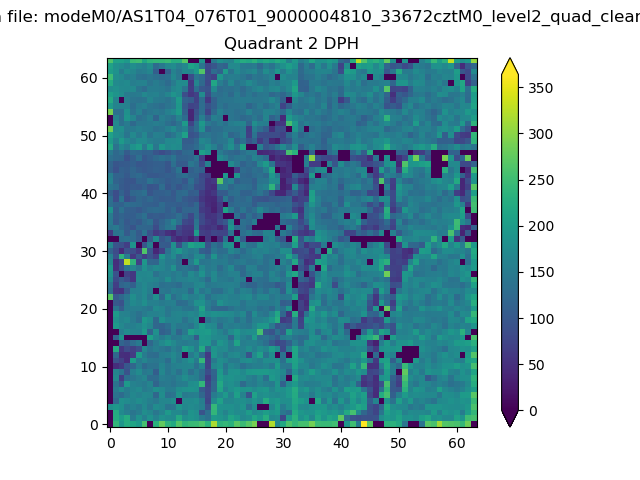
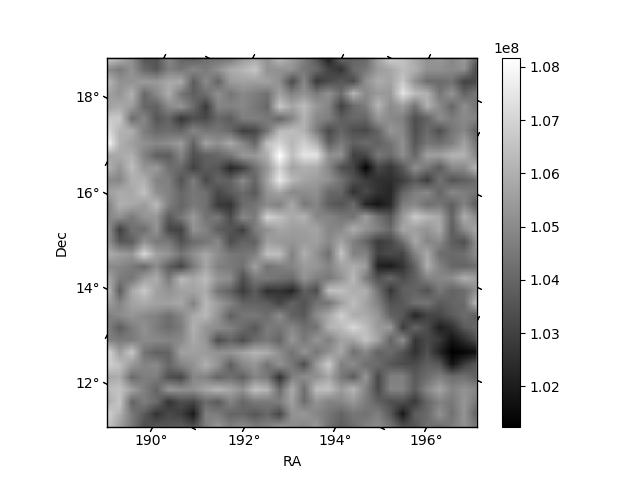
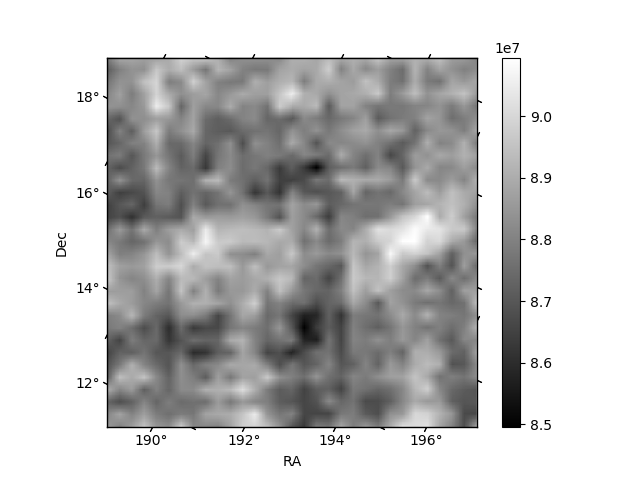
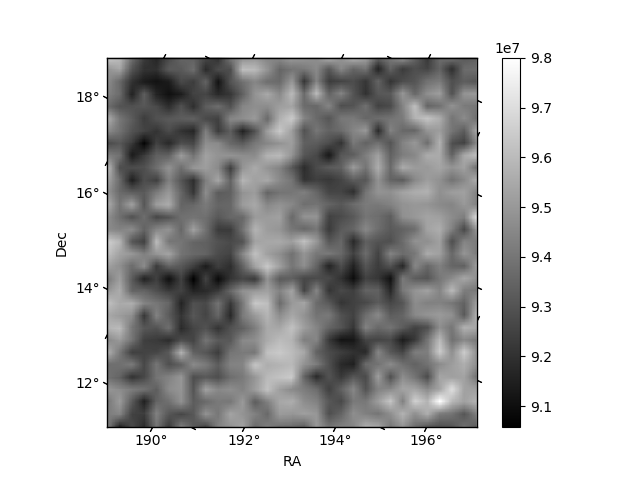
Histogram calculated using DETX and DETY for each event in the final _common_clean file
| Quadrant A | 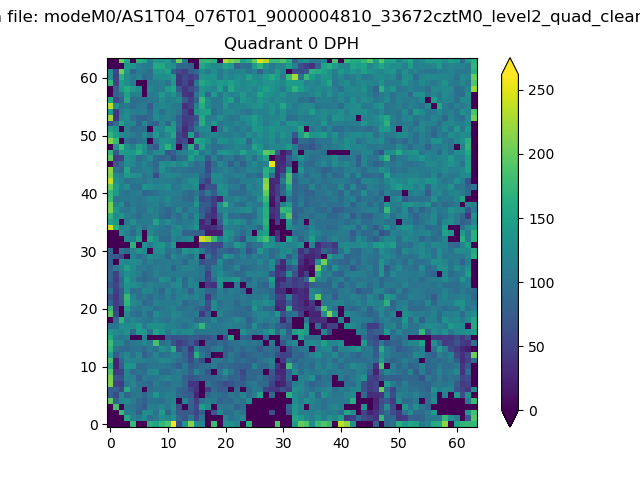 |
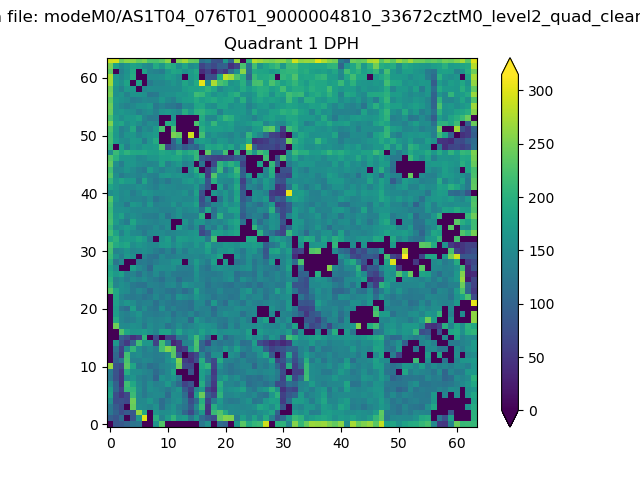 |
Quadrant B |
|---|---|---|---|
| Quadrant D | 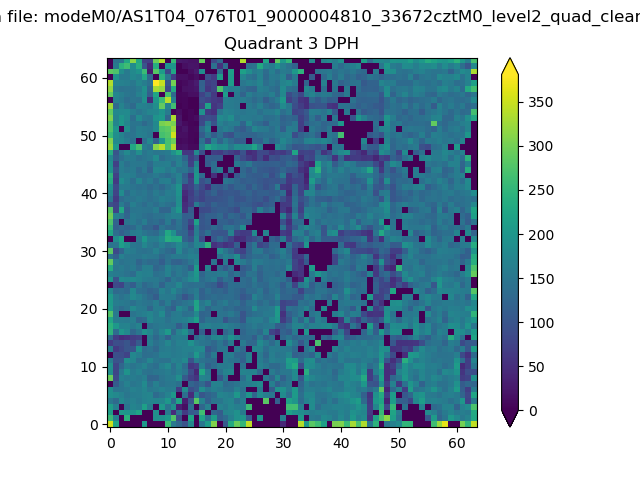 |
 |
Quadrant C |
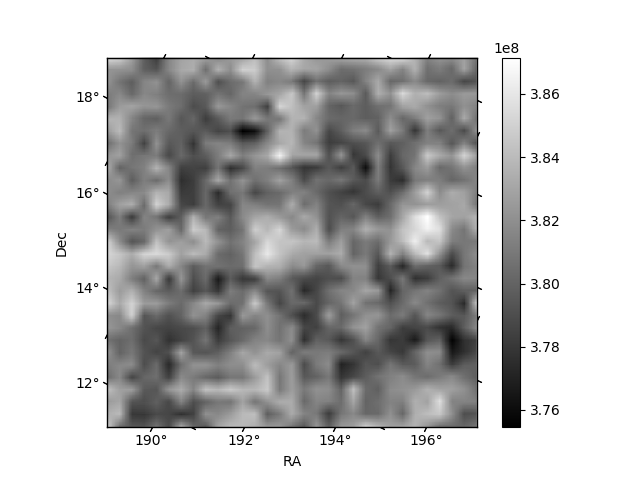
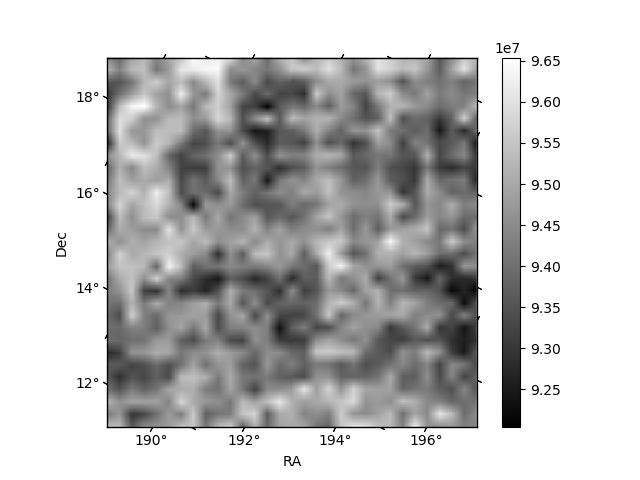
| Plot type | Count rate plots | Images |
|---|---|---|
| Comparison with Poisson distribution Blue bars denote a histogram of data divided into 1 sec bins. Red curve is a Poisson curve with rate = median count rate of data. |
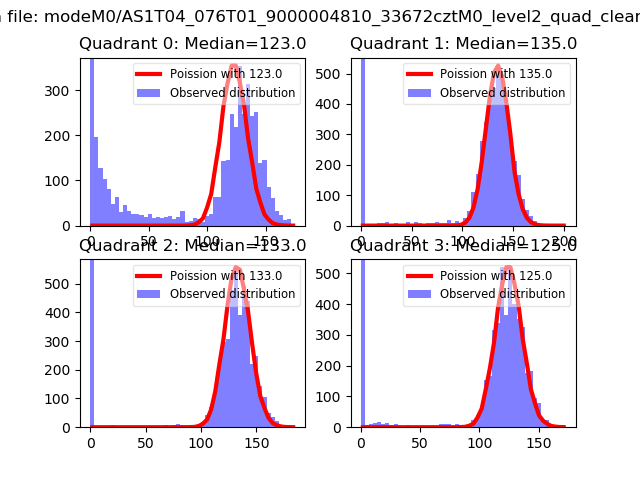 |
 |
| Quadrant-wise count rates Data is divided into 100 sec bins |
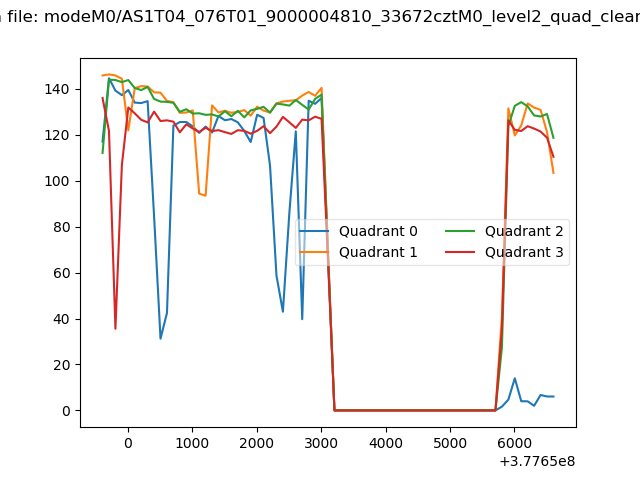 |
|
| Module-wise count rates for Quadrant A Data is divided into 100 sec bins |
 |
 |
| Module-wise count rates for Quadrant B Data is divided into 100 sec bins |
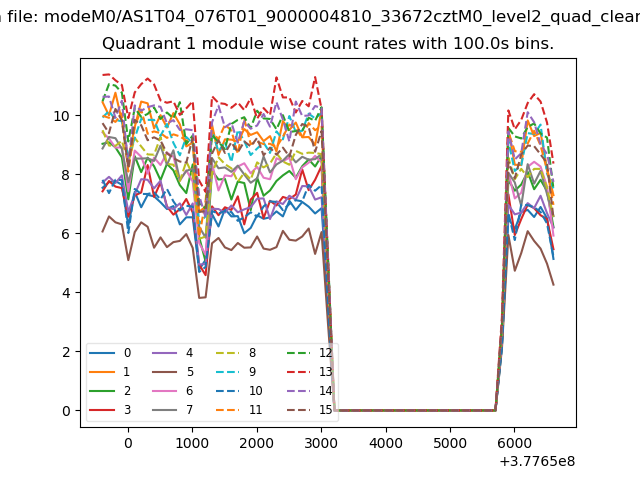 |
 |
| Module-wise count rates for Quadrant C Data is divided into 100 sec bins |
 |
 |
| Module-wise count rates for Quadrant D Data is divided into 100 sec bins |
 |
 |
| Parameter | Plot |
|---|---|
| CZT HV Monitor | 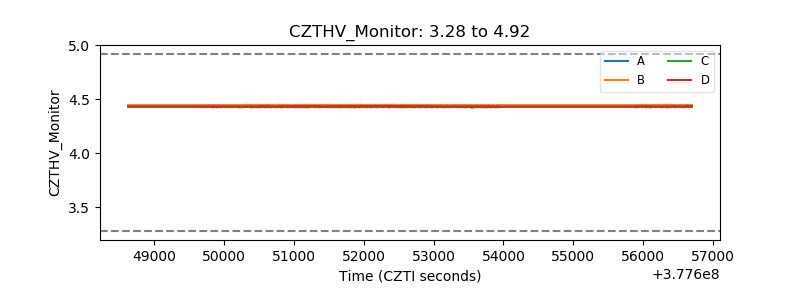 |
| D_VDD | 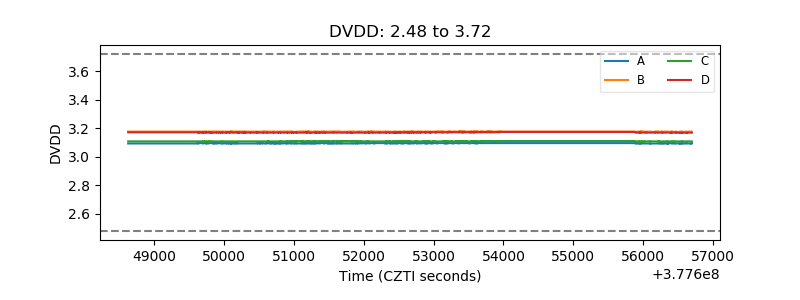 |
| Temperature 1 | 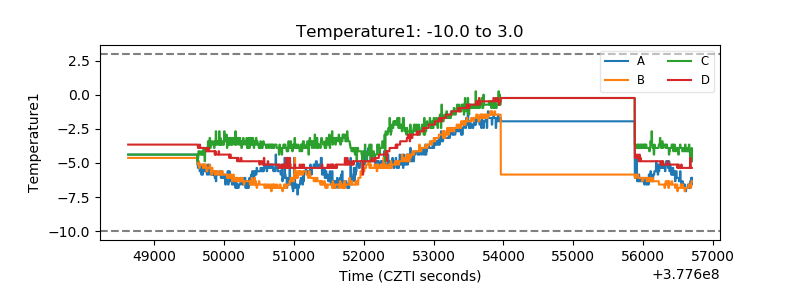 |
| Veto HV Monitor | 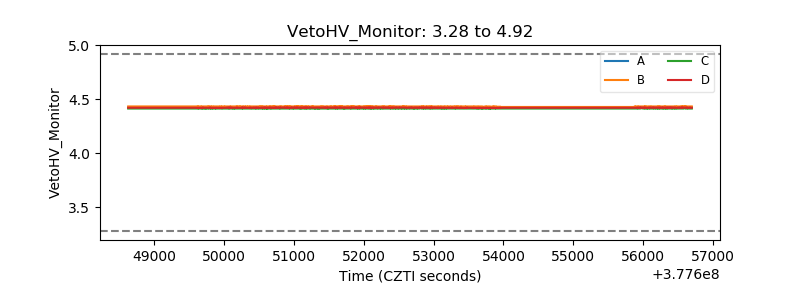 |
| Veto LLD |  |
| Alpha Counter | 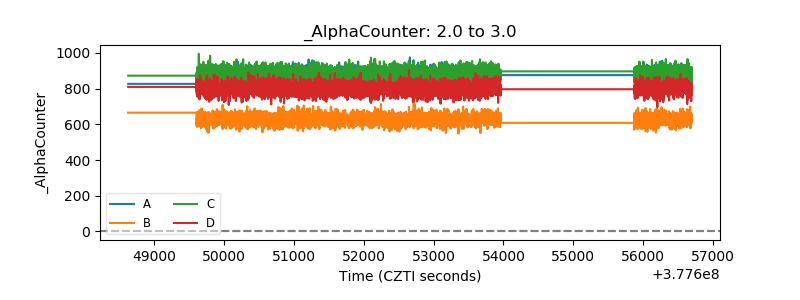 |
| _CPM_Rate |  |
| CZT Counter | 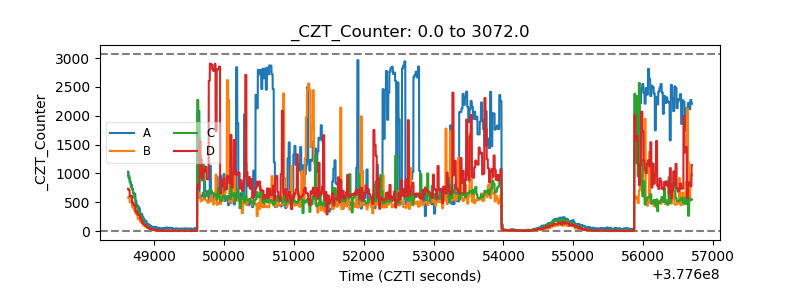 |
| +2.5 Volts monitor | 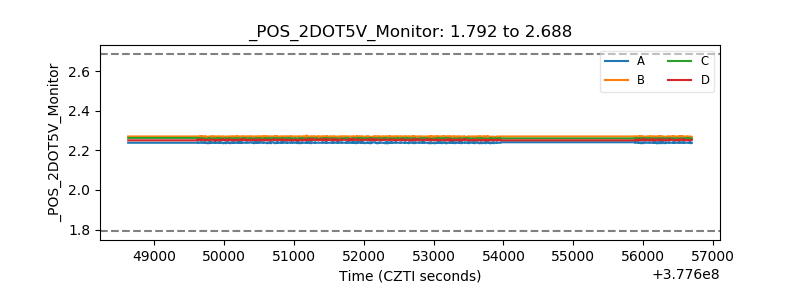 |
| +5 Volts monitor |  |
| _ROLL_ROT |  |
| _Roll_DEC | 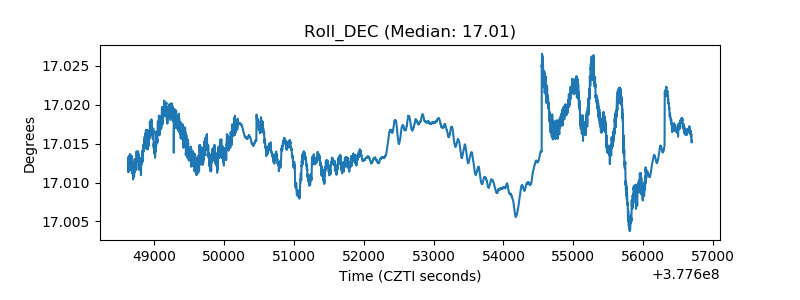 |
| _Roll_RA | 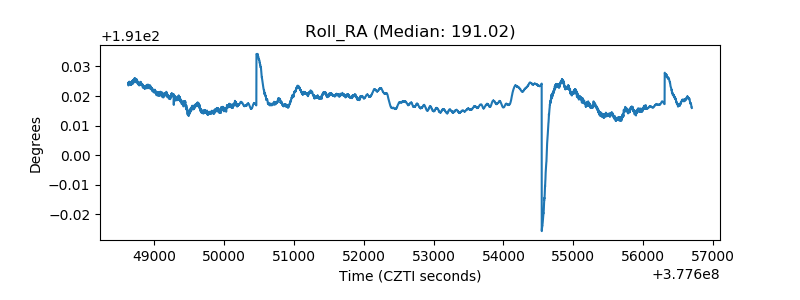 |
| Veto Counter | 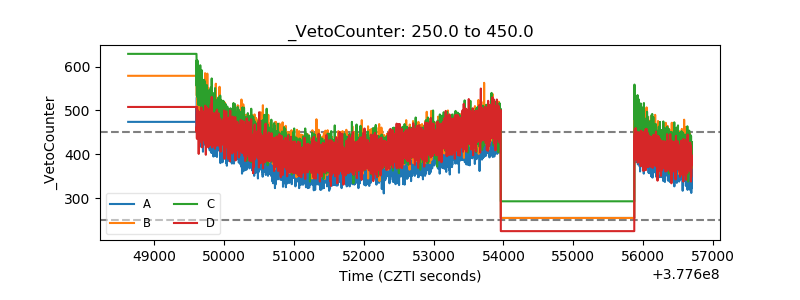 |