| Param | Original file | Final file |
|---|---|---|
| Filename | modeM0/AS1T04_076T01_9000004810_33673cztM0_level2.evt | modeM0/AS1T04_076T01_9000004810_33673cztM0_level2_quad_clean.evt |
| Size (bytes) | 838,967,040 | 65,963,520 |
| Size | 800.1 MB | 62.9 MB |
| Events in quadrant A | 12,289,872 | 45,612 |
| Events in quadrant B | 3,904,766 | 517,030 |
| Events in quadrant C | 3,424,442 | 529,411 |
| Events in quadrant D | 5,398,183 | 498,915 |
| Mode SS | |||
|---|---|---|---|
| Quadrant | BADHDUFLAG | Total packets | Discarded packets |
| A | 0 | 118 | 0 |
| B | 0 | 118 | 0 |
| C | 0 | 118 | 0 |
| D | 0 | 118 | 0 |
| Mode M9 | |||
|---|---|---|---|
| Quadrant | BADHDUFLAG | Total packets | Discarded packets |
| A | 0 | 26 | 0 |
| B | 0 | 26 | 0 |
| C | 0 | 26 | 0 |
| D | 0 | 27 | 0 |
| Mode M0 | |||
|---|---|---|---|
| Quadrant | BADHDUFLAG | Total packets | Discarded packets |
| A | 0 | 40451 | 3 |
| B | 0 | 15477 | 2 |
| C | 0 | 13833 | 2 |
| D | 0 | 20202 | 2 |
| Quadrant | Total seconds | Saturated seconds | Saturation percentage |
|---|---|---|---|
| A | 5779 | 5763 | 99.723135% |
| B | 5779 | 362 | 6.264060% |
| C | 5779 | 76 | 1.315106% |
| D | 5779 | 104 | 1.799619% |
Noise dominated data is calculated using 1-second bins in cleaned event files. If a bin has >2000 counts, and if more than 50% of those come from <1% of pixels, then it is considered to be noise-dominated and hence unusable.
| Quadrant | # 1 sec bins | Bins with >0 counts | Bins with >2000 counts | High rate bins dominated by noise | Noise dominated (total time) | Noise dominated (detector-on time) | Marked lightcurve |
|---|---|---|---|---|---|---|---|
| A | 7360 | 5778 | 4323 | 4323 | 58.74% | 74.82% | 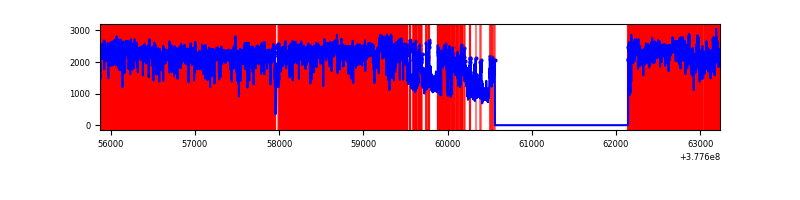 |
| B | 7361 | 5780 | 313 | 313 | 4.25% | 5.42% | 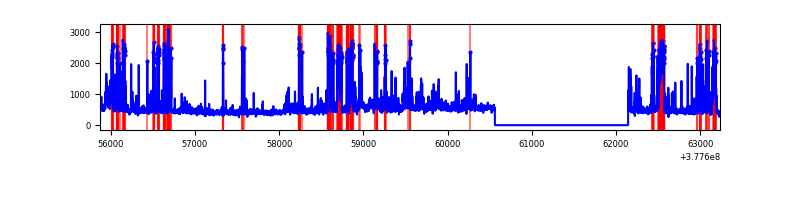 |
| C | 7361 | 5780 | 71 | 71 | 0.96% | 1.23% |  |
| D | 7361 | 5780 | 83 | 83 | 1.13% | 1.44% | 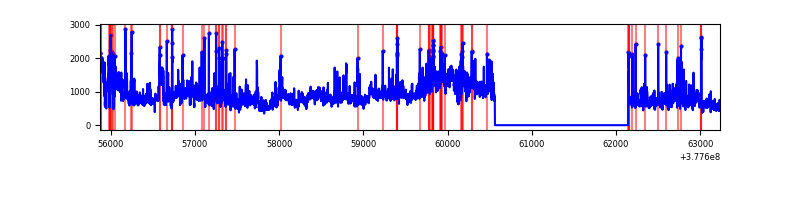 |
Top three noisy pixels from each quadrant. If the there are fewer than three noisy pixels in the level2.evt file, extra rows are filled as -1
| Pixel properties | Quadrant properties | ||||||
|---|---|---|---|---|---|---|---|
| Quadrant | DetID | PixID | Counts | Sigma | Mean | Median | Sigma |
| A | 15 | 169 | 11351773 | 688126.86 | 74 | 72 | 16.5 |
| A | 15 | 237 | 647434 | 39242.33 | 74 | 72 | 16.5 |
| A | 13 | 6 | 1473 | 84.93 | 74 | 72 | 16.5 |
| B | 5 | 172 | 1072951 | 8488.3 | 654 | 638 | 126.3 |
| B | 0 | 219 | 60705 | 475.48 | 654 | 638 | 126.3 |
| B | 5 | 255 | 55133 | 431.38 | 654 | 638 | 126.3 |
| C | 3 | 233 | 273576 | 1813.24 | 653 | 659 | 150.5 |
| C | 0 | 10 | 272552 | 1806.43 | 653 | 659 | 150.5 |
| C | 15 | 214 | 268570 | 1779.98 | 653 | 659 | 150.5 |
| D | 1 | 52 | 1491805 | 8479.74 | 643 | 630 | 175.9 |
| D | 8 | 195 | 938717 | 5334.54 | 643 | 630 | 175.9 |
| D | 13 | 249 | 99727 | 563.53 | 643 | 630 | 175.9 |
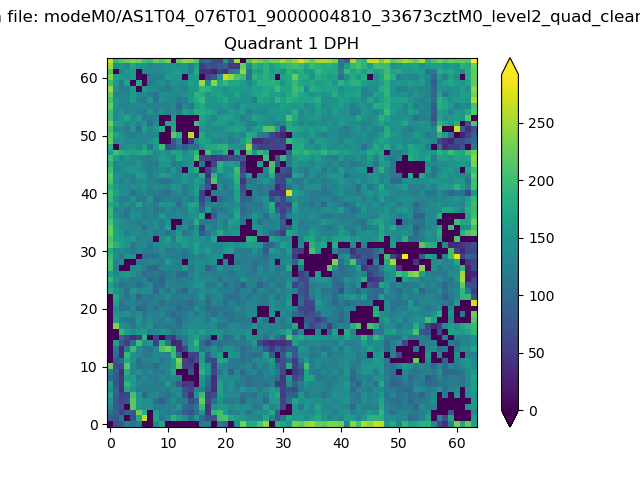
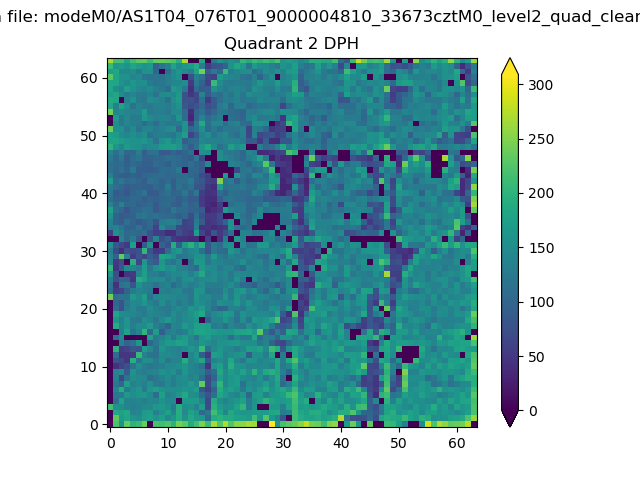
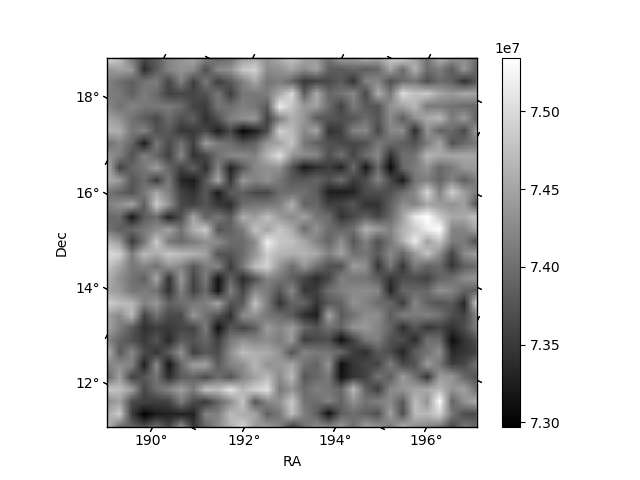
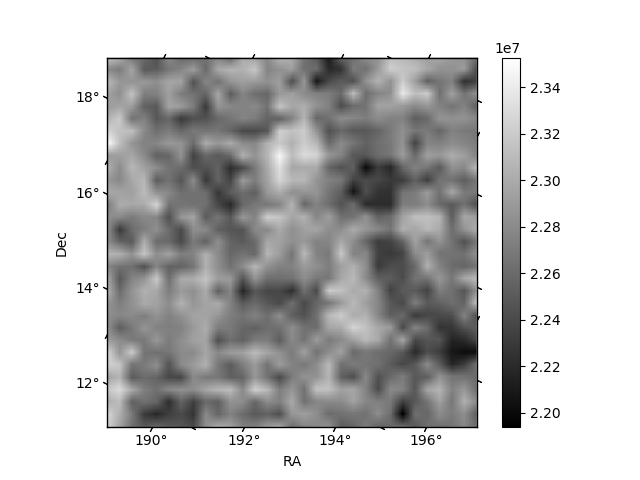
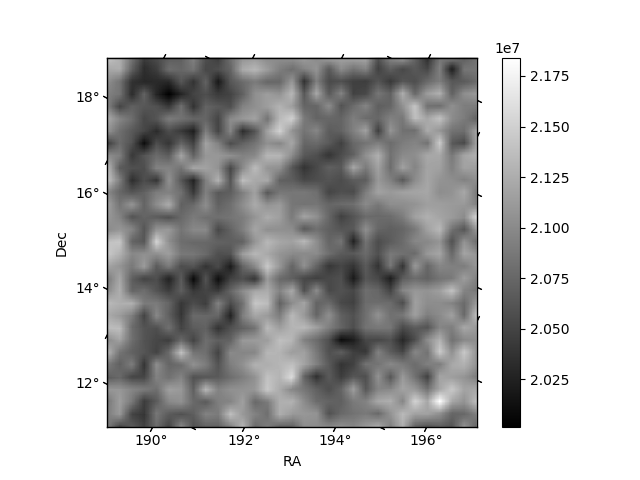
Histogram calculated using DETX and DETY for each event in the final _common_clean file
| Quadrant A | 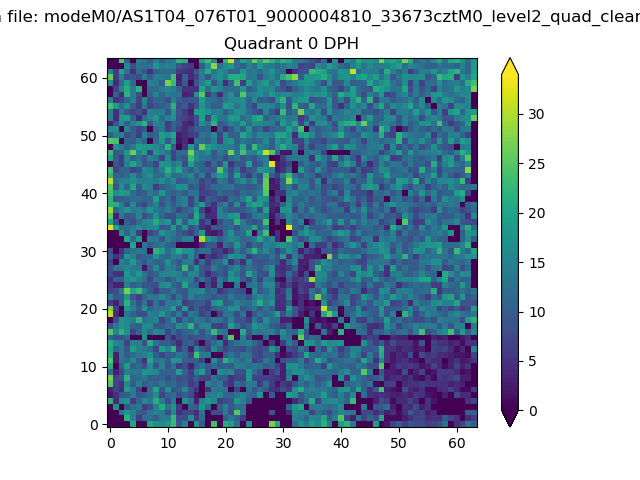 |
 |
Quadrant B |
|---|---|---|---|
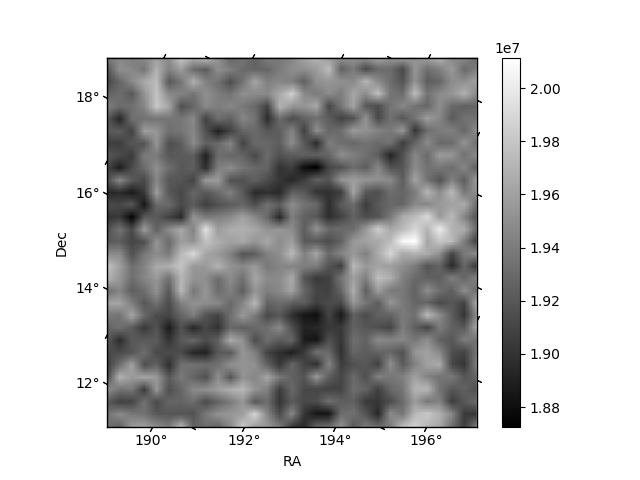
| Quadrant D | 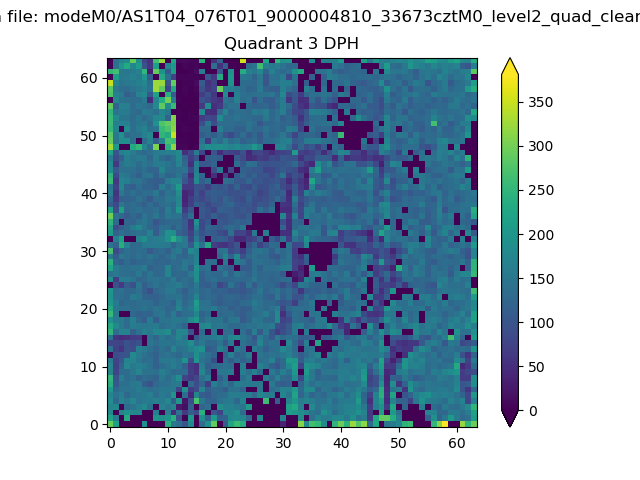 |
 |
Quadrant C |
| Plot type | Count rate plots | Images |
|---|---|---|
| Comparison with Poisson distribution Blue bars denote a histogram of data divided into 1 sec bins. Red curve is a Poisson curve with rate = median count rate of data. |
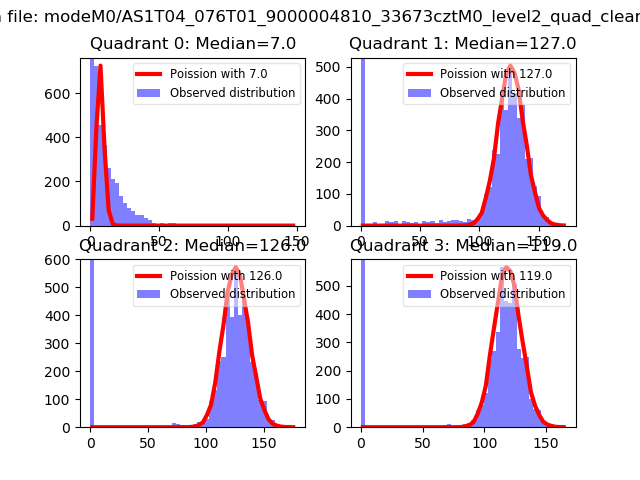 |
 |
| Quadrant-wise count rates Data is divided into 100 sec bins |
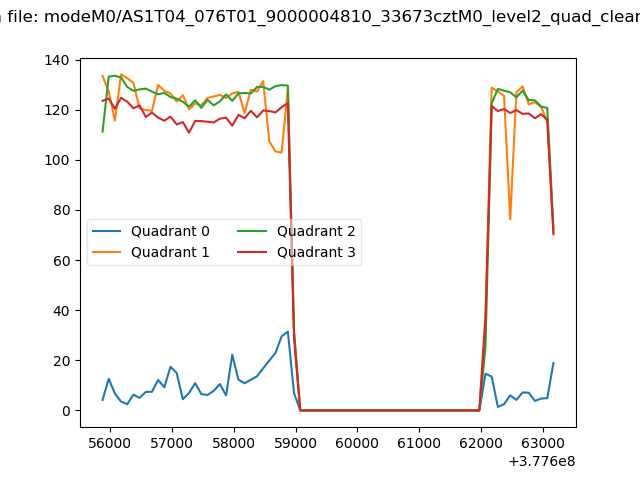 |
|
| Module-wise count rates for Quadrant A Data is divided into 100 sec bins |
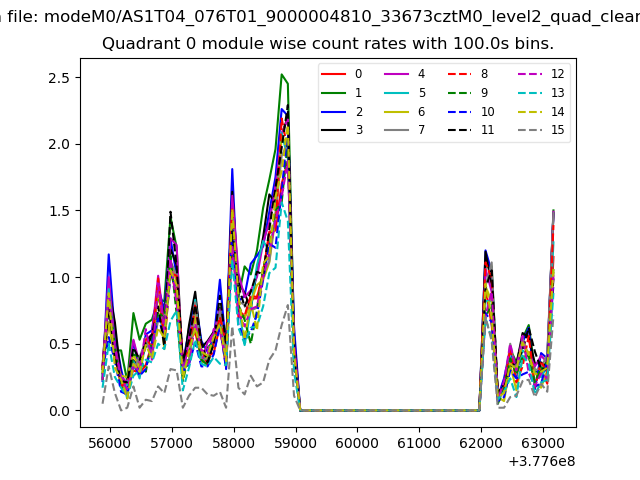 |
 |
| Module-wise count rates for Quadrant B Data is divided into 100 sec bins |
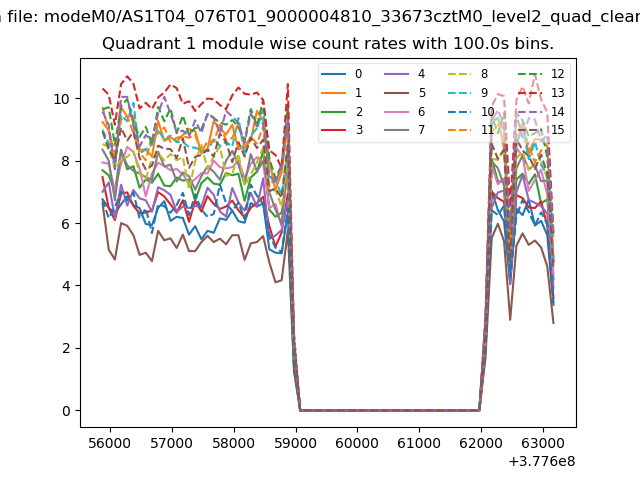 |
 |
| Module-wise count rates for Quadrant C Data is divided into 100 sec bins |
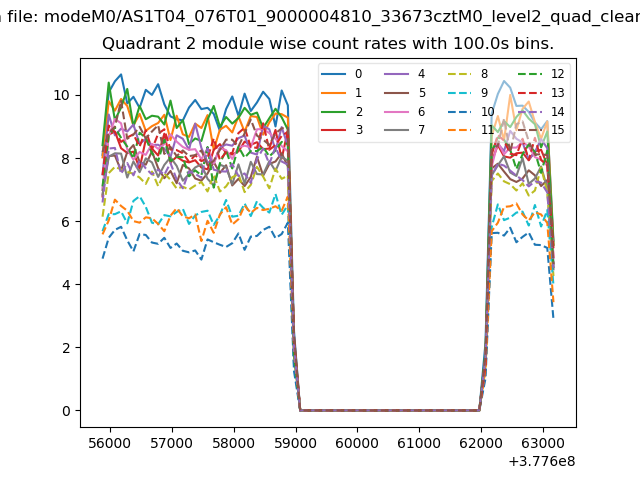 |
 |
| Module-wise count rates for Quadrant D Data is divided into 100 sec bins |
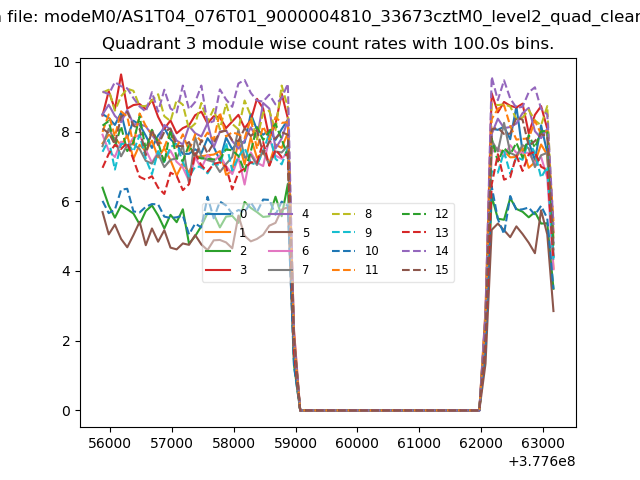 |
 |
| Parameter | Plot |
|---|---|
| CZT HV Monitor | 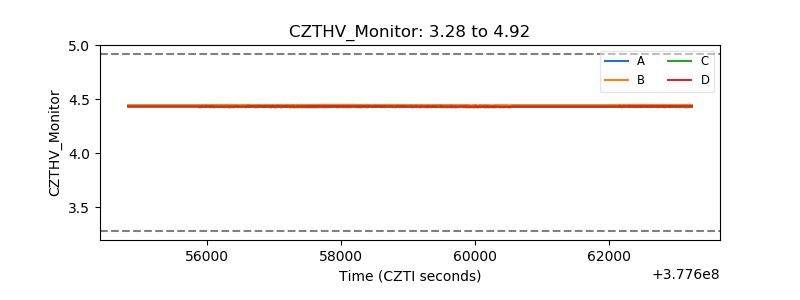 |
| D_VDD | 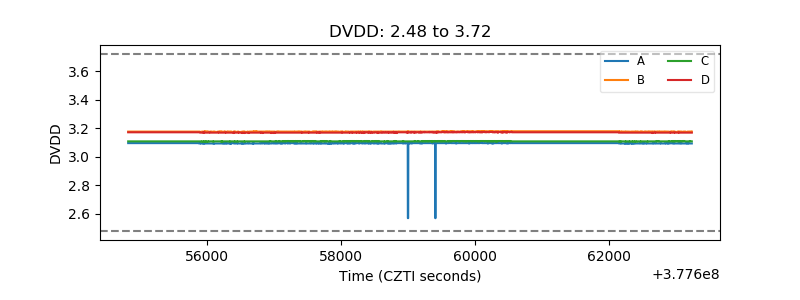 |
| Temperature 1 |  |
| Veto HV Monitor | 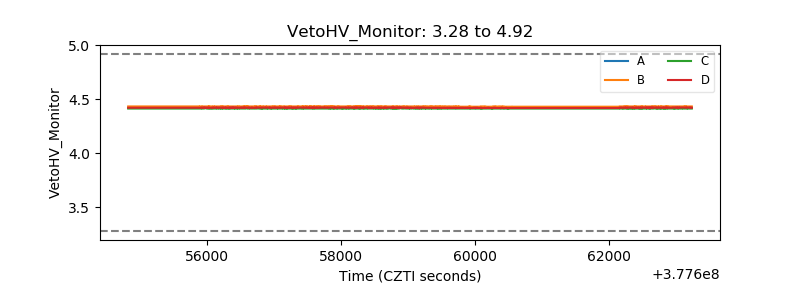 |
| Veto LLD | 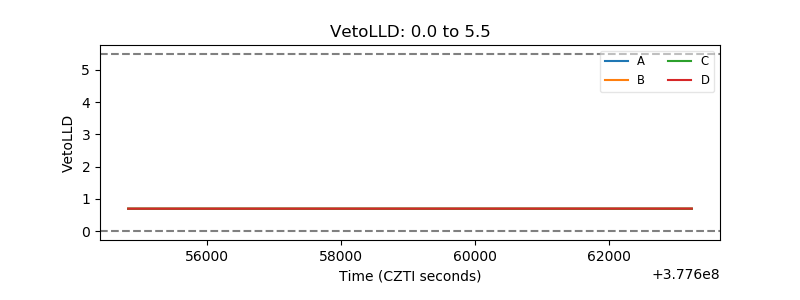 |
| Alpha Counter | 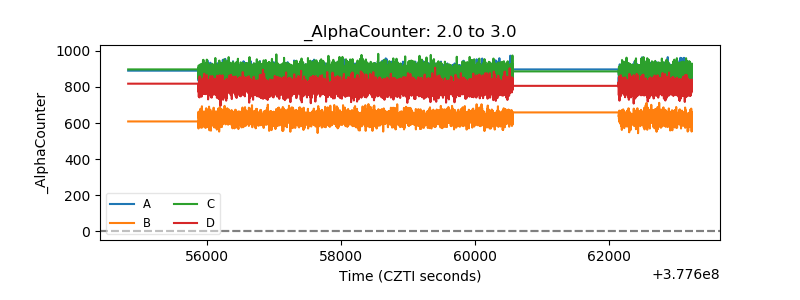 |
| _CPM_Rate | 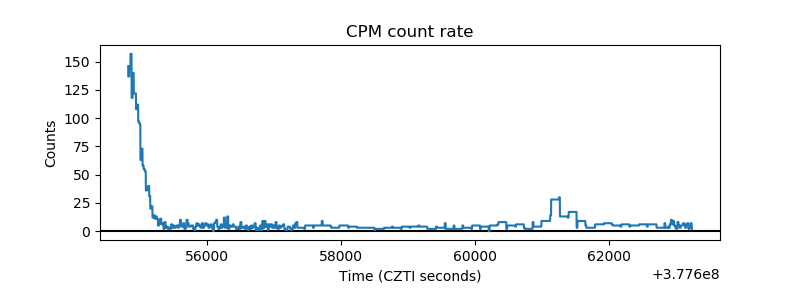 |
| CZT Counter | 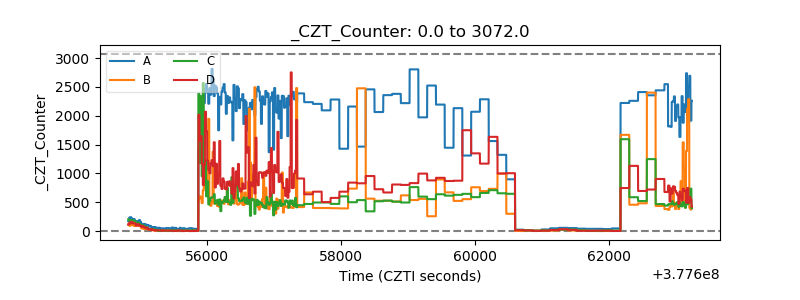 |
| +2.5 Volts monitor |  |
| +5 Volts monitor |  |
| _ROLL_ROT | 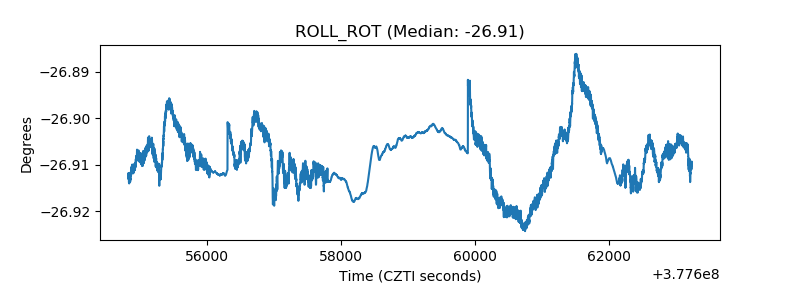 |
| _Roll_DEC | 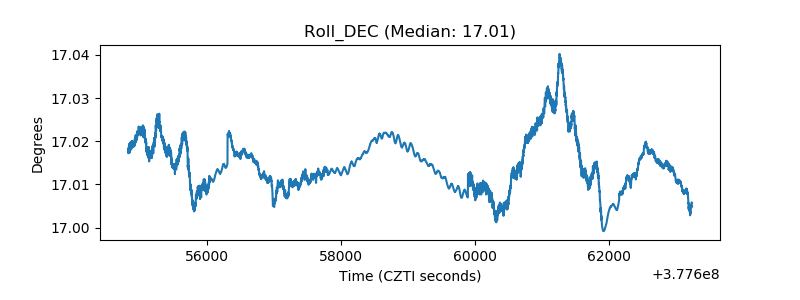 |
| _Roll_RA | 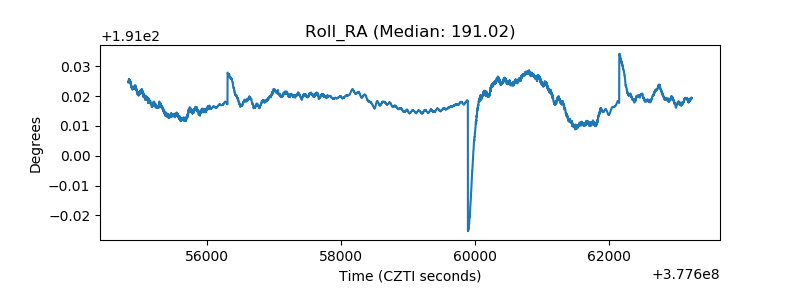 |
| Veto Counter | 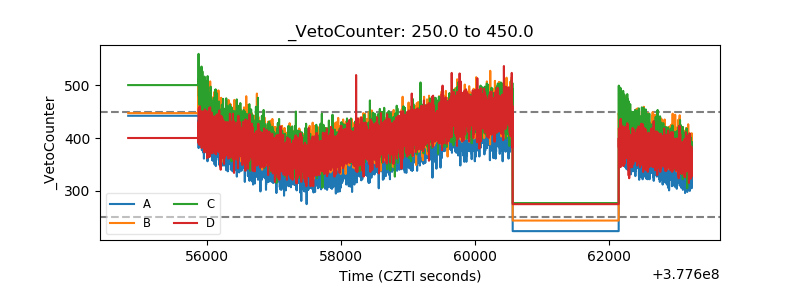 |