| Param | Original file | Final file |
|---|---|---|
| Filename | modeM0/AS1T04_076T01_9000004810_33674cztM0_level2.evt | modeM0/AS1T04_076T01_9000004810_33674cztM0_level2_quad_clean.evt |
| Size (bytes) | 822,378,240 | 60,647,040 |
| Size | 784.3 MB | 57.8 MB |
| Events in quadrant A | 12,047,594 | 30,559 |
| Events in quadrant B | 4,080,173 | 458,991 |
| Events in quadrant C | 4,202,338 | 469,025 |
| Events in quadrant D | 4,163,610 | 451,083 |
| Mode SS | |||
|---|---|---|---|
| Quadrant | BADHDUFLAG | Total packets | Discarded packets |
| A | 0 | 124 | 0 |
| B | 0 | 124 | 0 |
| C | 0 | 124 | 0 |
| D | 0 | 124 | 0 |
| Mode M9 | |||
|---|---|---|---|
| Quadrant | BADHDUFLAG | Total packets | Discarded packets |
| A | 0 | 19 | 0 |
| B | 0 | 19 | 0 |
| C | 0 | 19 | 0 |
| D | 0 | 20 | 0 |
| Mode M0 | |||
|---|---|---|---|
| Quadrant | BADHDUFLAG | Total packets | Discarded packets |
| A | 0 | 39981 | 3 |
| B | 0 | 16138 | 2 |
| C | 0 | 16370 | 2 |
| D | 0 | 16661 | 2 |
| Quadrant | Total seconds | Saturated seconds | Saturation percentage |
|---|---|---|---|
| A | 6078 | 6026 | 99.144455% |
| B | 6078 | 392 | 6.449490% |
| C | 6078 | 174 | 2.862784% |
| D | 6078 | 52 | 0.855545% |
Noise dominated data is calculated using 1-second bins in cleaned event files. If a bin has >2000 counts, and if more than 50% of those come from <1% of pixels, then it is considered to be noise-dominated and hence unusable.
| Quadrant | # 1 sec bins | Bins with >0 counts | Bins with >2000 counts | High rate bins dominated by noise | Noise dominated (total time) | Noise dominated (detector-on time) | Marked lightcurve |
|---|---|---|---|---|---|---|---|
| A | 7419 | 6077 | 3006 | 3006 | 40.52% | 49.47% | 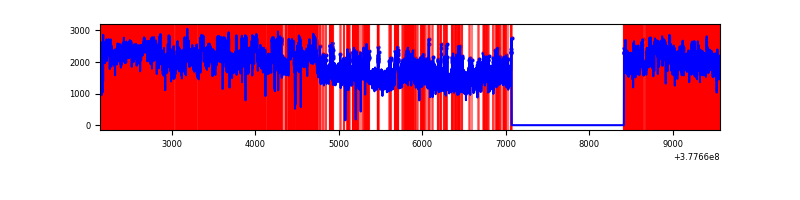 |
| B | 7420 | 6079 | 338 | 338 | 4.56% | 5.56% | 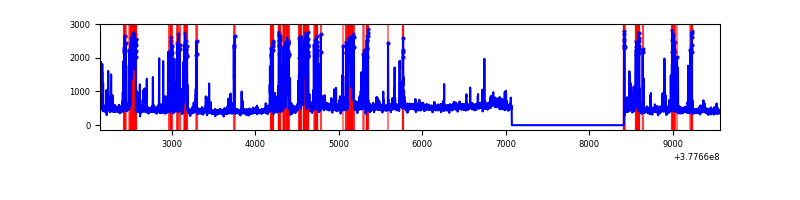 |
| C | 7420 | 6079 | 78 | 78 | 1.05% | 1.28% | 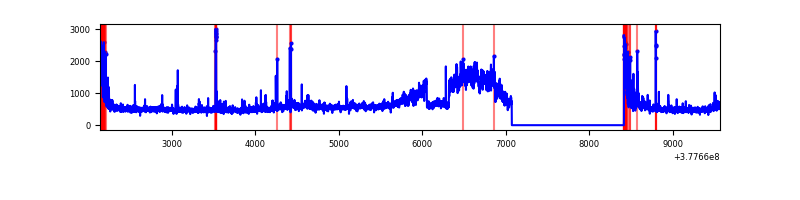 |
| D | 7420 | 6079 | 50 | 50 | 0.67% | 0.82% | 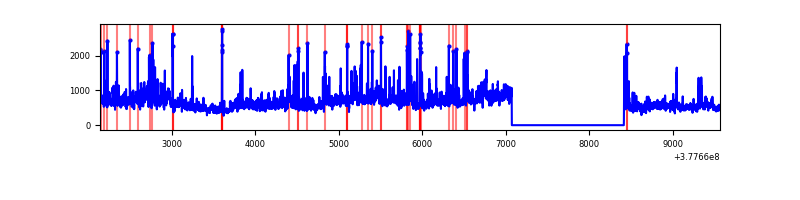 |
Top three noisy pixels from each quadrant. If the there are fewer than three noisy pixels in the level2.evt file, extra rows are filled as -1
| Pixel properties | Quadrant properties | ||||||
|---|---|---|---|---|---|---|---|
| Quadrant | DetID | PixID | Counts | Sigma | Mean | Median | Sigma |
| A | 15 | 169 | 11500798 | 933680.41 | 52 | 51 | 12.3 |
| A | 15 | 237 | 341198 | 27695.79 | 52 | 51 | 12.3 |
| A | 10 | 83 | 1164 | 90.36 | 52 | 51 | 12.3 |
| B | 5 | 172 | 1239019 | 9370.89 | 684 | 667 | 132.1 |
| B | 15 | 85 | 28968 | 214.16 | 684 | 667 | 132.1 |
| B | 0 | 219 | 26537 | 195.76 | 684 | 667 | 132.1 |
| C | 3 | 233 | 955918 | 6007.15 | 682 | 687 | 159.0 |
| C | 15 | 214 | 282926 | 1774.91 | 682 | 687 | 159.0 |
| C | 0 | 10 | 222982 | 1397.94 | 682 | 687 | 159.0 |
| D | 1 | 52 | 551347 | 2950.36 | 679 | 664 | 186.6 |
| D | 8 | 195 | 496166 | 2654.72 | 679 | 664 | 186.6 |
| D | 2 | 249 | 99906 | 531.7 | 679 | 664 | 186.6 |
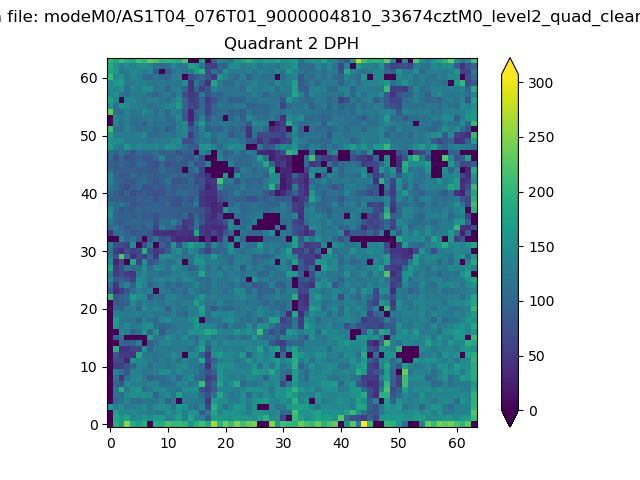
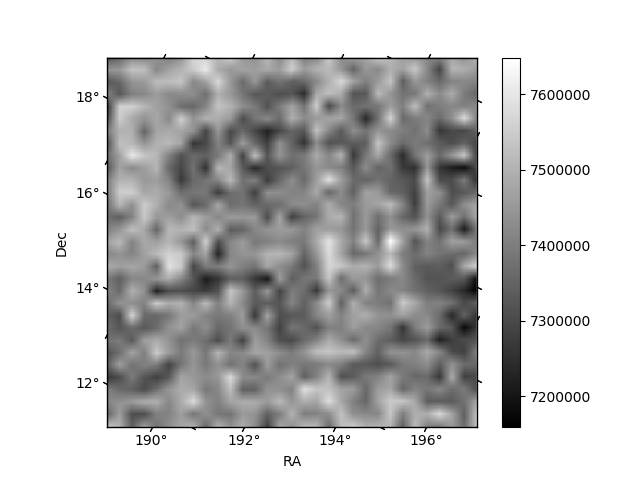
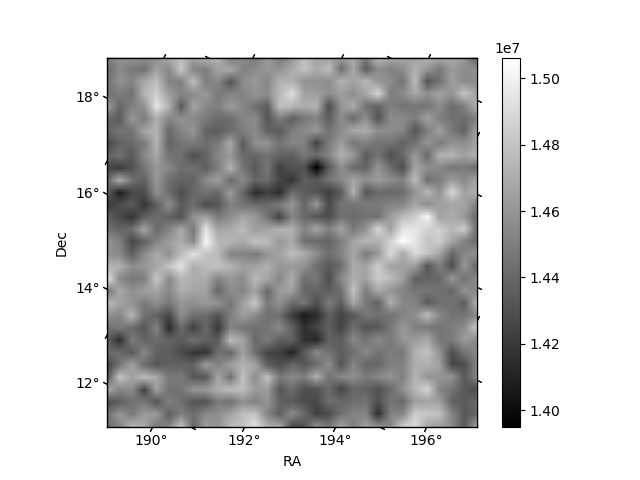
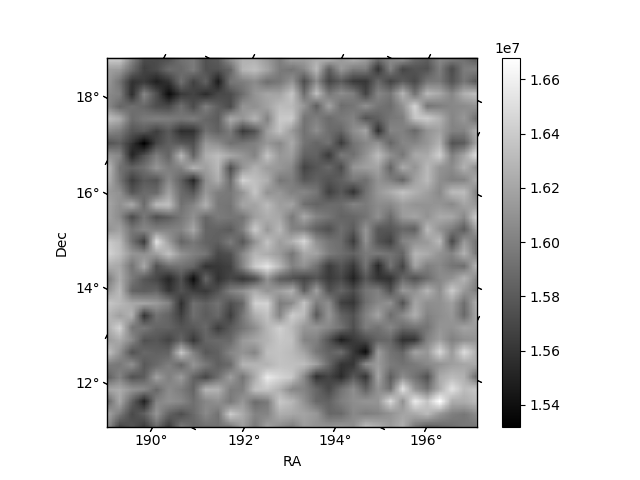
Histogram calculated using DETX and DETY for each event in the final _common_clean file
| Quadrant A |  |
 |
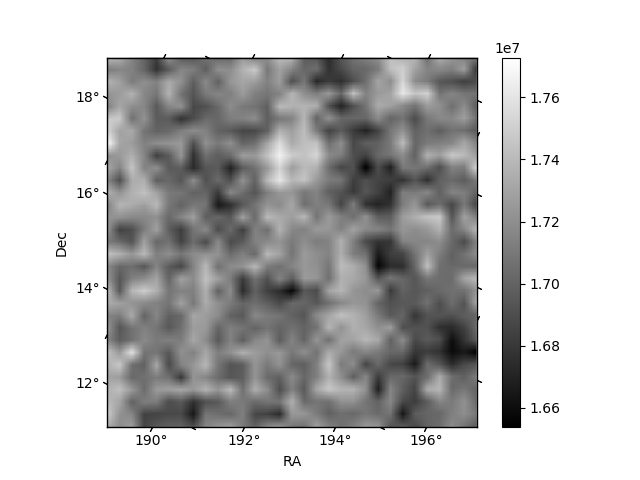
Quadrant B |
|---|---|---|---|
| Quadrant D | 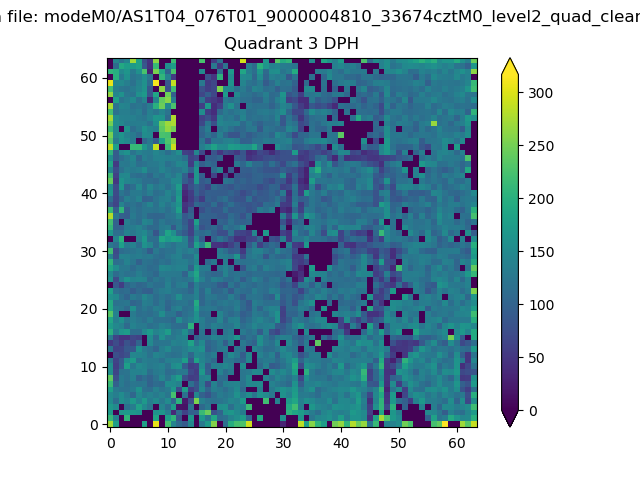 |
 |
Quadrant C |
| Plot type | Count rate plots | Images |
|---|---|---|
| Comparison with Poisson distribution Blue bars denote a histogram of data divided into 1 sec bins. Red curve is a Poisson curve with rate = median count rate of data. |
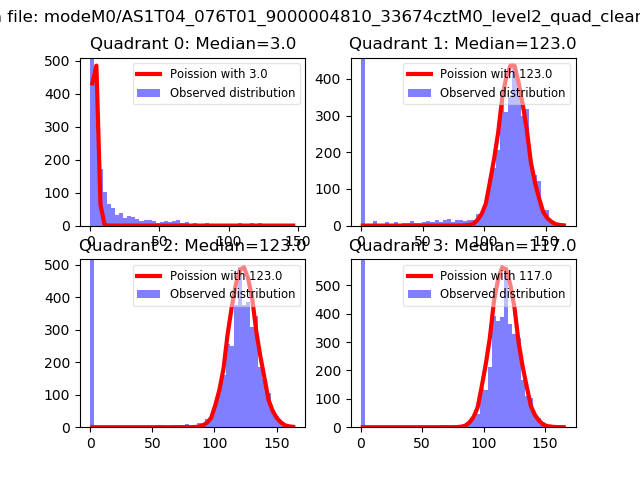 |
 |
| Quadrant-wise count rates Data is divided into 100 sec bins |
 |
|
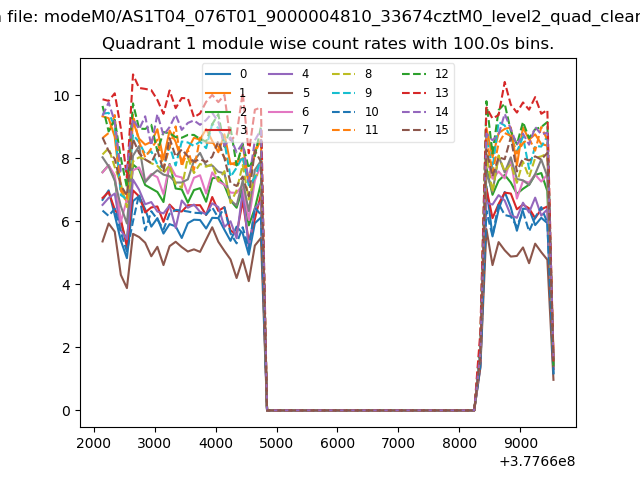
| Module-wise count rates for Quadrant A Data is divided into 100 sec bins |
 |
 |
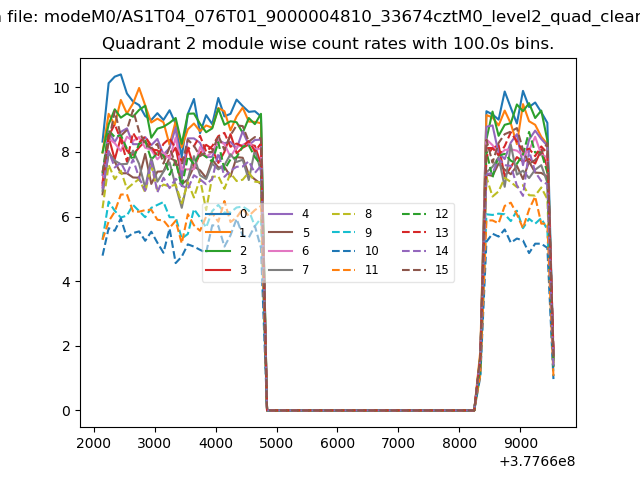
| Module-wise count rates for Quadrant B Data is divided into 100 sec bins |
 |
 |
| Module-wise count rates for Quadrant C Data is divided into 100 sec bins |
 |
 |
| Module-wise count rates for Quadrant D Data is divided into 100 sec bins |
 |
 |
| Parameter | Plot |
|---|---|
| CZT HV Monitor | 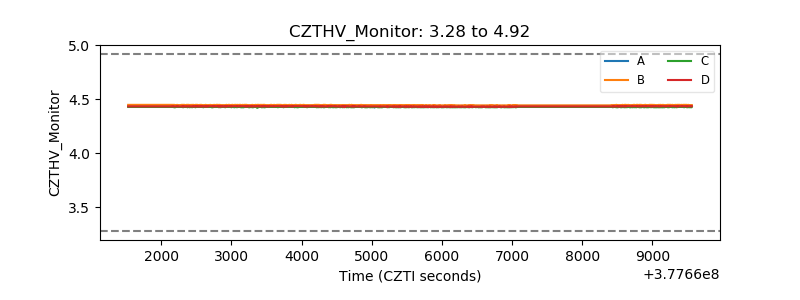 |
| D_VDD | 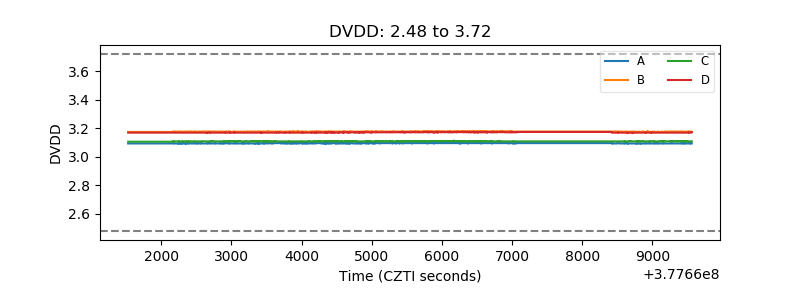 |
| Temperature 1 | 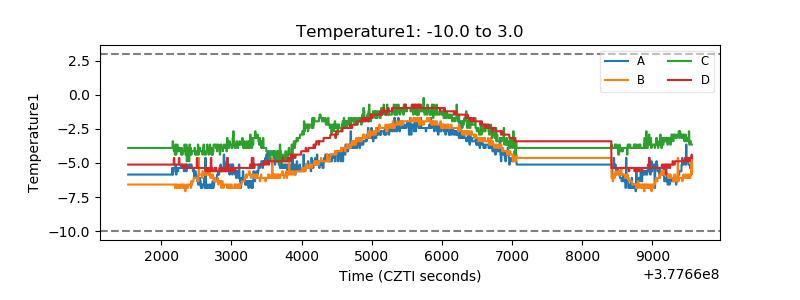 |
| Veto HV Monitor | 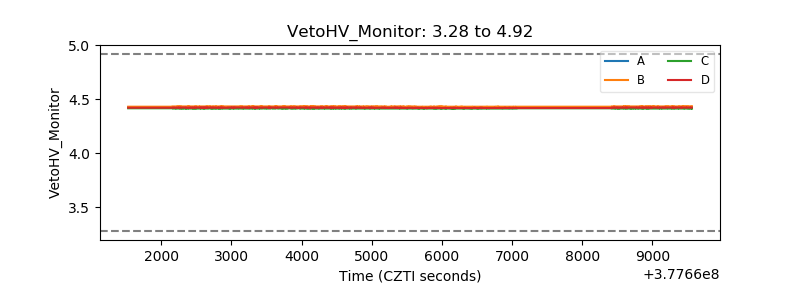 |
| Veto LLD | 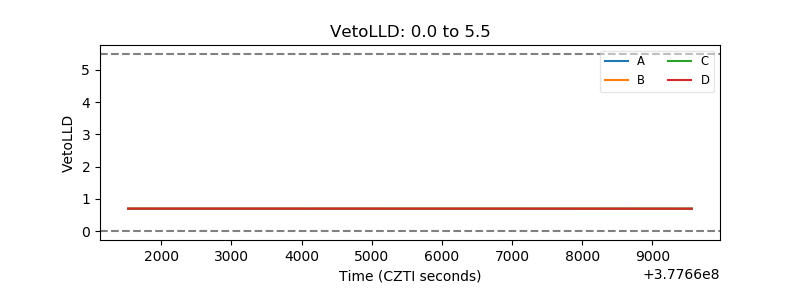 |
| Alpha Counter | 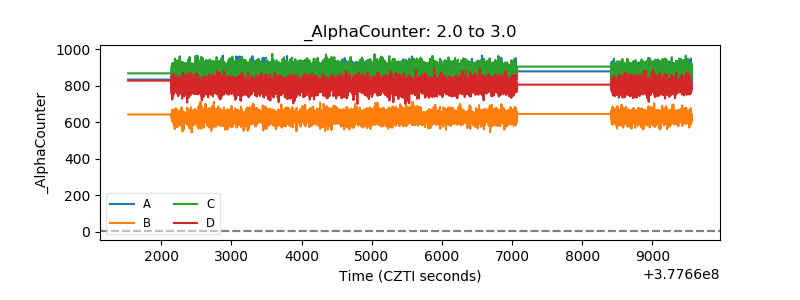 |
| _CPM_Rate | 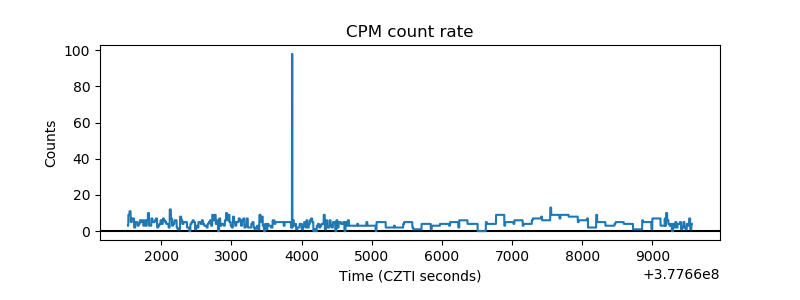 |
| CZT Counter | 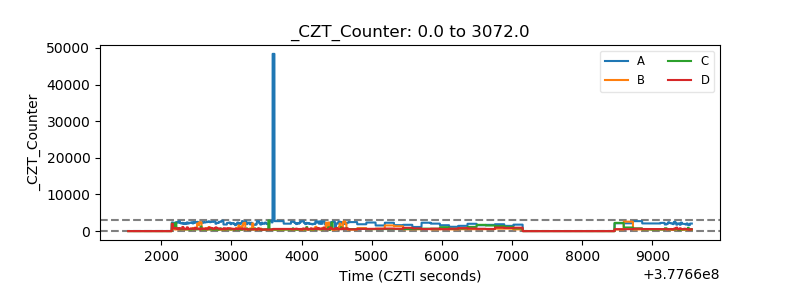 |
| +2.5 Volts monitor |  |
| +5 Volts monitor | 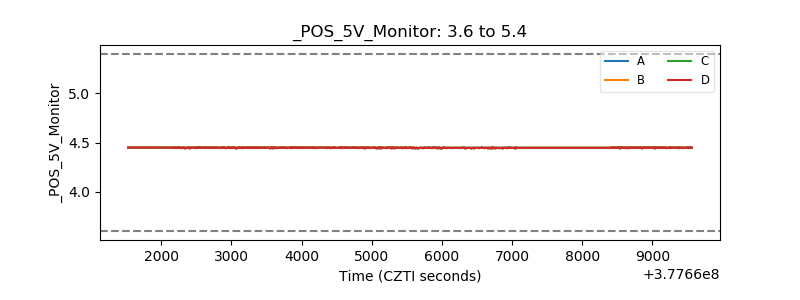 |
| _ROLL_ROT |  |
| _Roll_DEC | 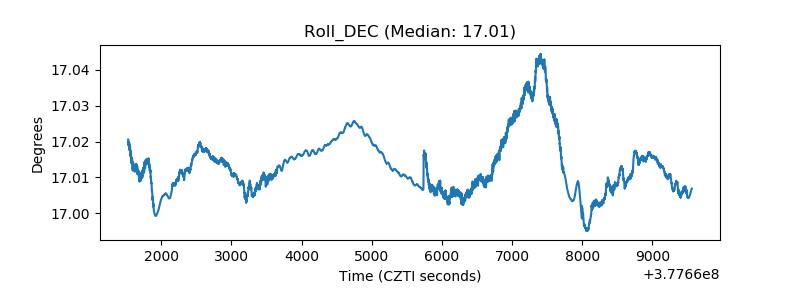 |
| _Roll_RA |  |
| Veto Counter | 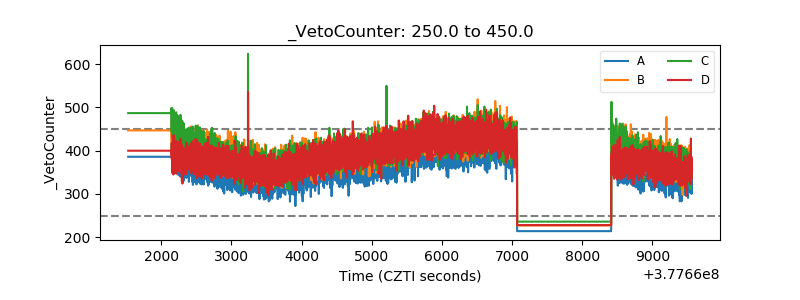 |