| Param | Original file | Final file |
|---|---|---|
| Filename | modeM0/AS1T04_076T01_9000004810_33677cztM0_level2.evt | modeM0/AS1T04_076T01_9000004810_33677cztM0_level2_quad_clean.evt |
| Size (bytes) | 1,543,250,880 | 104,843,520 |
| Size | 1.4 GB | 100.0 MB |
| Events in quadrant A | 22,157,285 | 125,294 |
| Events in quadrant B | 7,718,816 | 762,854 |
| Events in quadrant C | 8,225,521 | 783,628 |
| Events in quadrant D | 7,904,530 | 748,397 |
| Mode SS | |||
|---|---|---|---|
| Quadrant | BADHDUFLAG | Total packets | Discarded packets |
| A | 0 | 222 | 0 |
| B | 0 | 222 | 0 |
| C | 0 | 222 | 0 |
| D | 0 | 222 | 0 |
| Mode M9 | |||
|---|---|---|---|
| Quadrant | BADHDUFLAG | Total packets | Discarded packets |
| A | 0 | 27 | 0 |
| B | 0 | 27 | 0 |
| C | 0 | 27 | 0 |
| D | 0 | 27 | 0 |
| Mode M0 | |||
|---|---|---|---|
| Quadrant | BADHDUFLAG | Total packets | Discarded packets |
| A | 0 | 73278 | 4 |
| B | 0 | 29790 | 3 |
| C | 0 | 31702 | 3 |
| D | 0 | 31035 | 3 |
| Quadrant | Total seconds | Saturated seconds | Saturation percentage |
|---|---|---|---|
| A | 10849 | 10480 | 96.598765% |
| B | 10849 | 742 | 6.839340% |
| C | 10849 | 488 | 4.498110% |
| D | 10850 | 354 | 3.262673% |
Noise dominated data is calculated using 1-second bins in cleaned event files. If a bin has >2000 counts, and if more than 50% of those come from <1% of pixels, then it is considered to be noise-dominated and hence unusable.
| Quadrant | # 1 sec bins | Bins with >0 counts | Bins with >2000 counts | High rate bins dominated by noise | Noise dominated (total time) | Noise dominated (detector-on time) | Marked lightcurve |
|---|---|---|---|---|---|---|---|
| A | 13564 | 10849 | 6823 | 6823 | 50.30% | 62.89% | 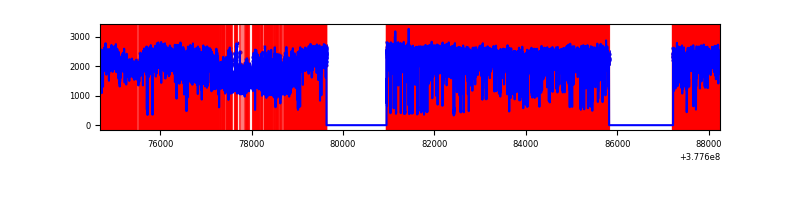 |
| B | 13565 | 10851 | 619 | 619 | 4.56% | 5.70% | 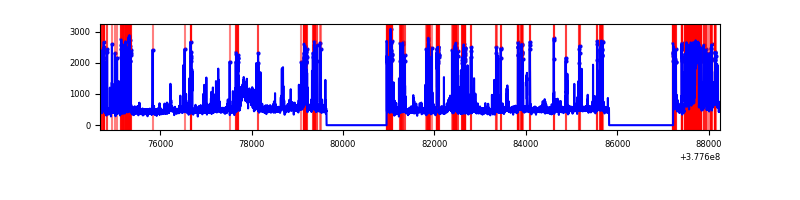 |
| C | 13565 | 10851 | 470 | 470 | 3.46% | 4.33% | 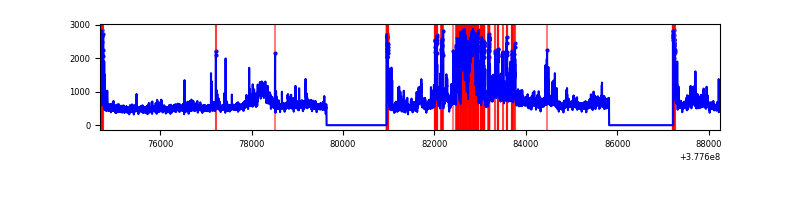 |
| D | 13566 | 10852 | 322 | 322 | 2.37% | 2.97% | 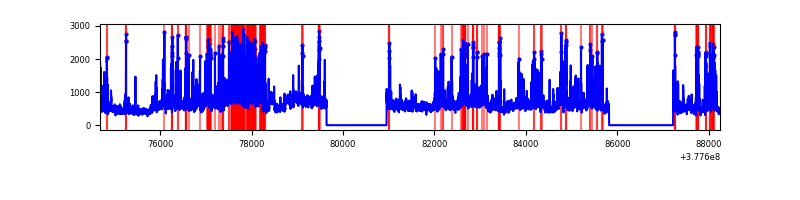 |
Top three noisy pixels from each quadrant. If the there are fewer than three noisy pixels in the level2.evt file, extra rows are filled as -1
| Pixel properties | Quadrant properties | ||||||
|---|---|---|---|---|---|---|---|
| Quadrant | DetID | PixID | Counts | Sigma | Mean | Median | Sigma |
| A | 15 | 169 | 21160263 | 459390.67 | 221 | 217 | 46.1 |
| A | 15 | 237 | 132757 | 2877.48 | 221 | 217 | 46.1 |
| A | 13 | 6 | 5654 | 118.04 | 221 | 217 | 46.1 |
| B | 5 | 172 | 2385447 | 9954.26 | 1241 | 1209 | 239.5 |
| B | 4 | 170 | 113498 | 468.81 | 1241 | 1209 | 239.5 |
| B | 0 | 244 | 70916 | 291.03 | 1241 | 1209 | 239.5 |
| C | 3 | 233 | 2629059 | 9298.64 | 1226 | 1234 | 282.6 |
| C | 15 | 214 | 463220 | 1634.75 | 1226 | 1234 | 282.6 |
| C | 0 | 10 | 307156 | 1082.51 | 1226 | 1234 | 282.6 |
| D | 8 | 195 | 1197655 | 3908.16 | 1239 | 1203 | 306.1 |
| D | 7 | 80 | 472676 | 1540.05 | 1239 | 1203 | 306.1 |
| D | 13 | 249 | 353454 | 1150.61 | 1239 | 1203 | 306.1 |
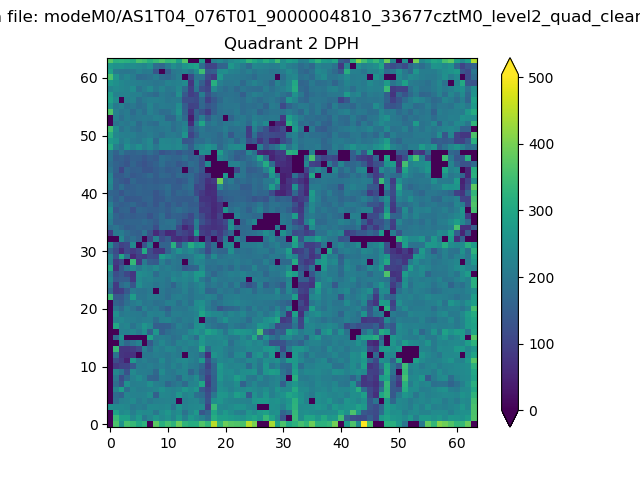
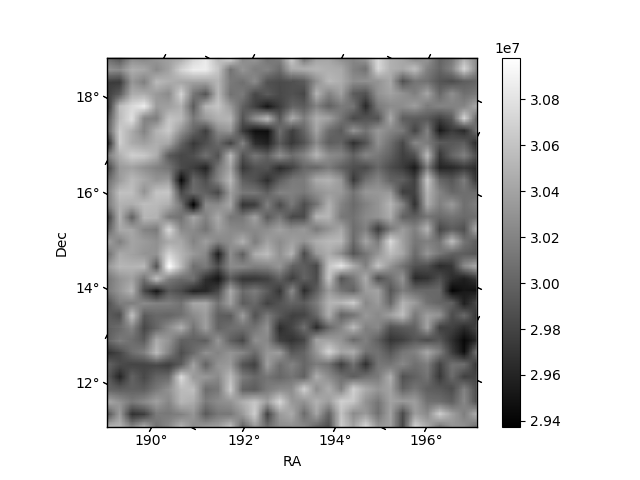
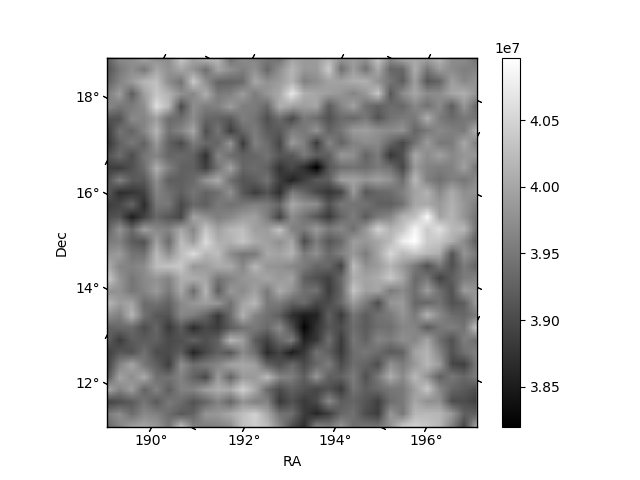
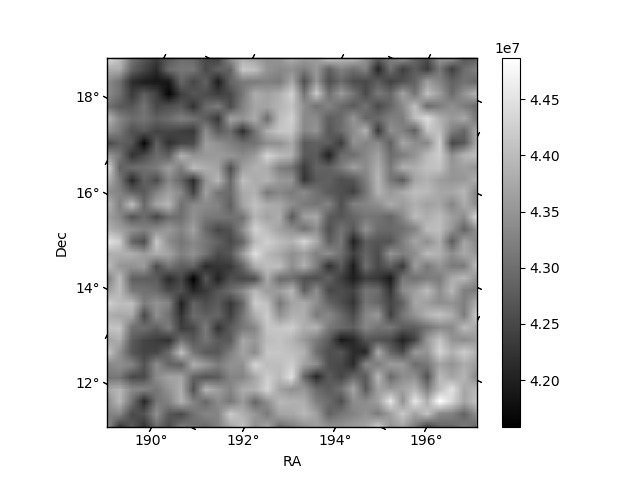
Histogram calculated using DETX and DETY for each event in the final _common_clean file
| Quadrant A |  |
 |
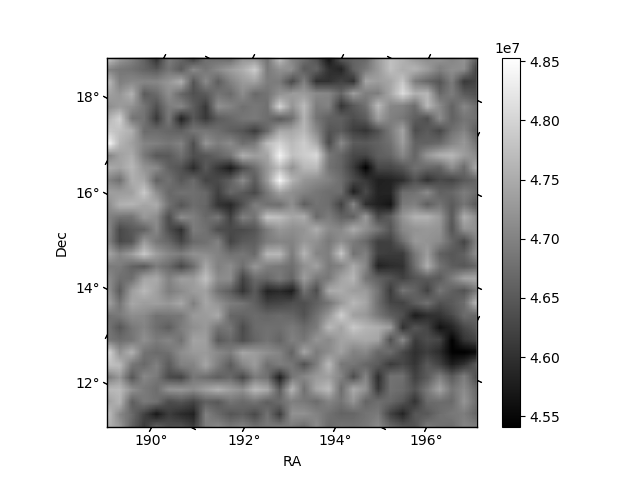
Quadrant B |
|---|---|---|---|
| Quadrant D | 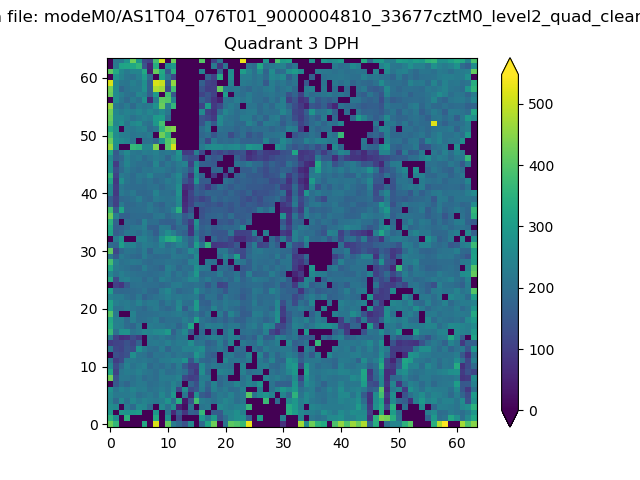 |
 |
Quadrant C |
| Plot type | Count rate plots | Images |
|---|---|---|
| Comparison with Poisson distribution Blue bars denote a histogram of data divided into 1 sec bins. Red curve is a Poisson curve with rate = median count rate of data. |
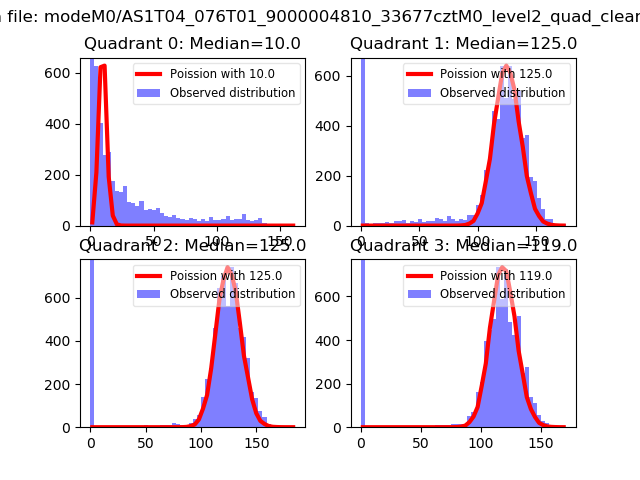 |
 |
| Quadrant-wise count rates Data is divided into 100 sec bins |
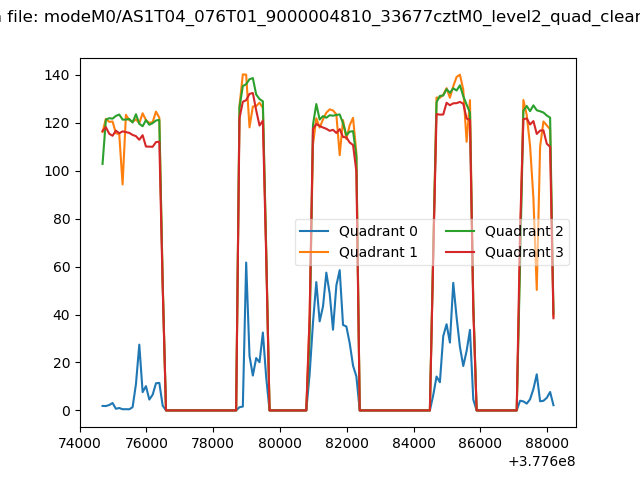 |
|
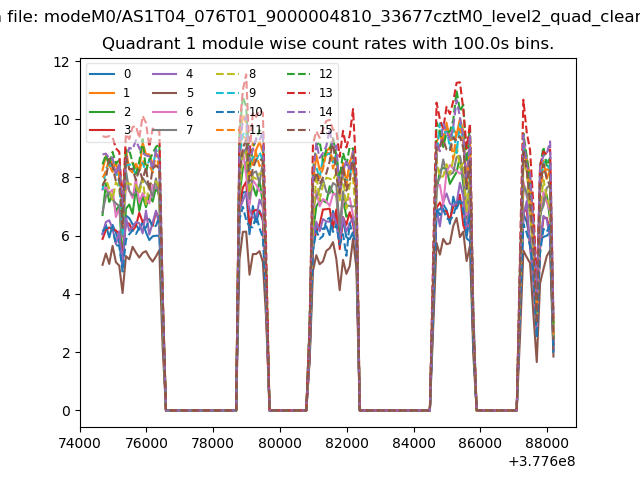
| Module-wise count rates for Quadrant A Data is divided into 100 sec bins |
 |
 |
| Module-wise count rates for Quadrant B Data is divided into 100 sec bins |
 |
 |
| Module-wise count rates for Quadrant C Data is divided into 100 sec bins |
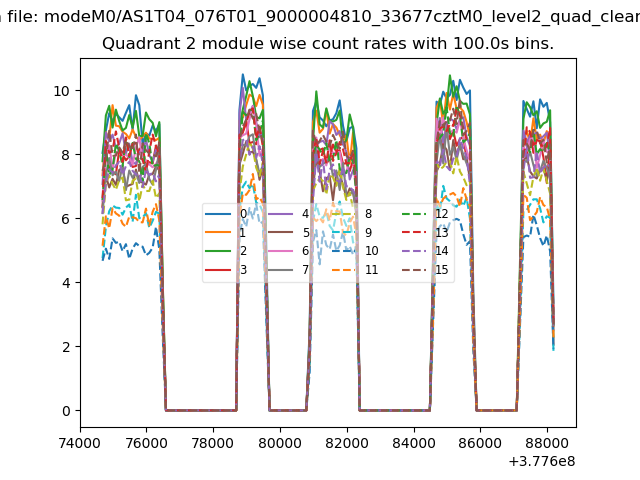 |
 |
| Module-wise count rates for Quadrant D Data is divided into 100 sec bins |
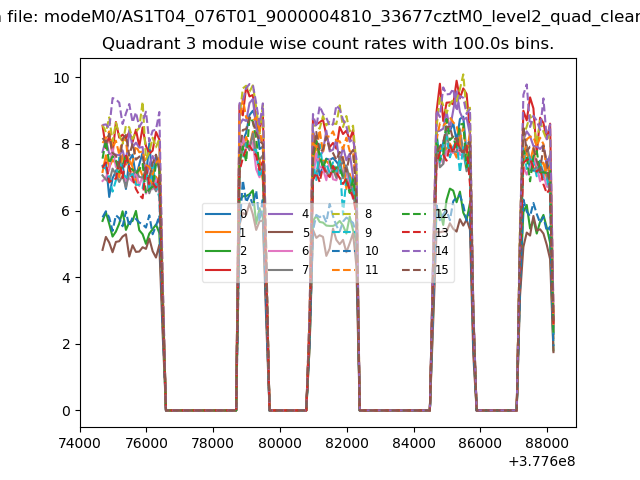 |
 |
| Parameter | Plot |
|---|---|
| CZT HV Monitor |  |
| D_VDD | 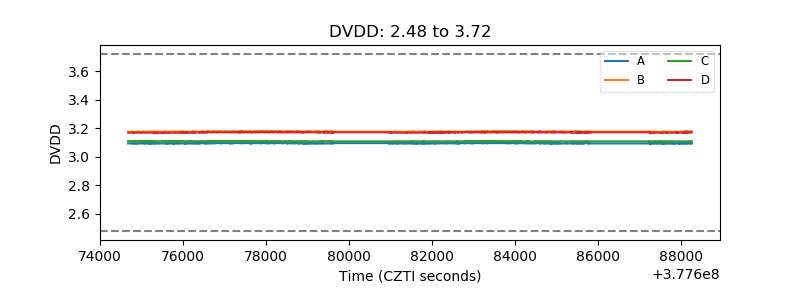 |
| Temperature 1 | 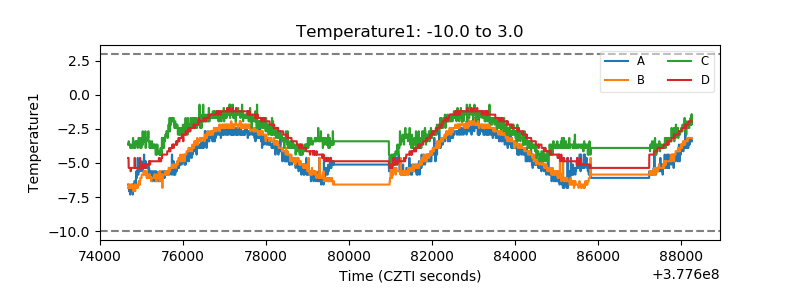 |
| Veto HV Monitor | 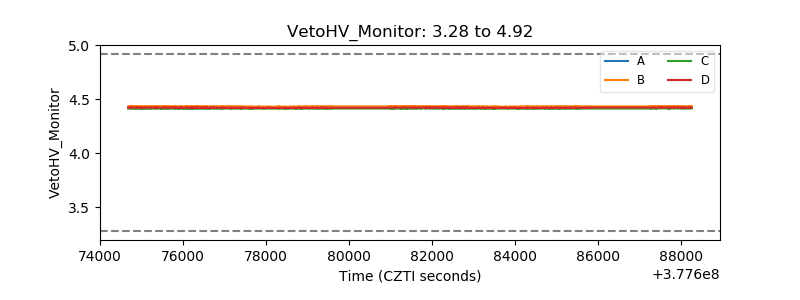 |
| Veto LLD | 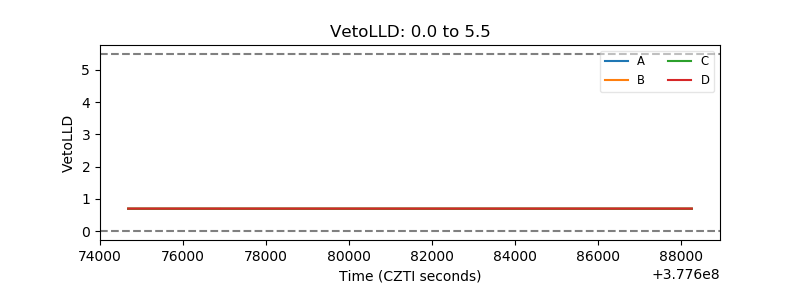 |
| Alpha Counter | 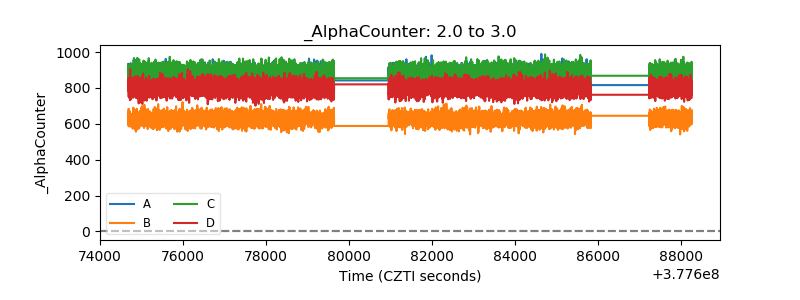 |
| _CPM_Rate | 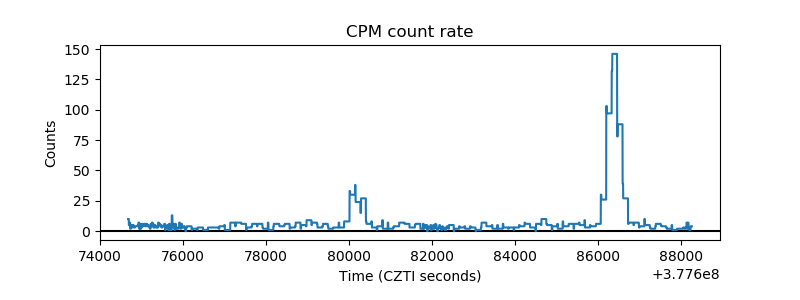 |
| CZT Counter | 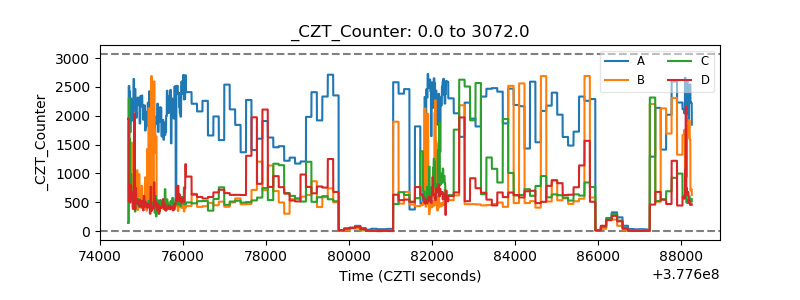 |
| +2.5 Volts monitor |  |
| +5 Volts monitor | 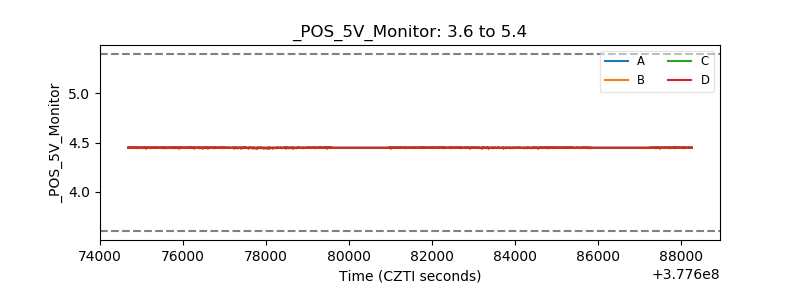 |
| _ROLL_ROT | 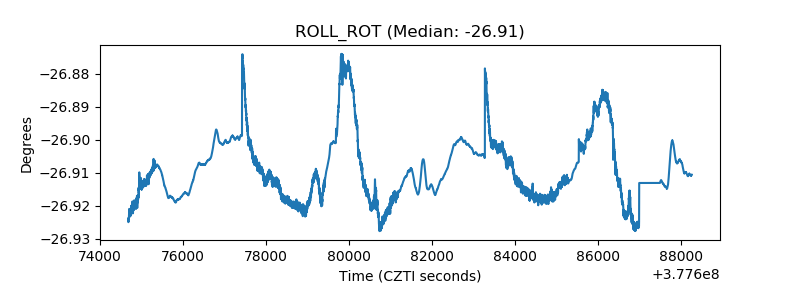 |
| _Roll_DEC | 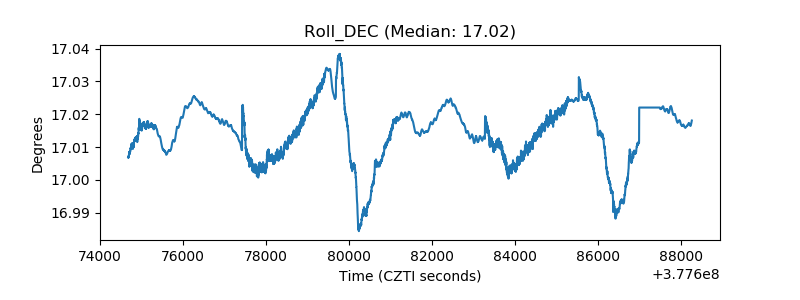 |
| _Roll_RA | 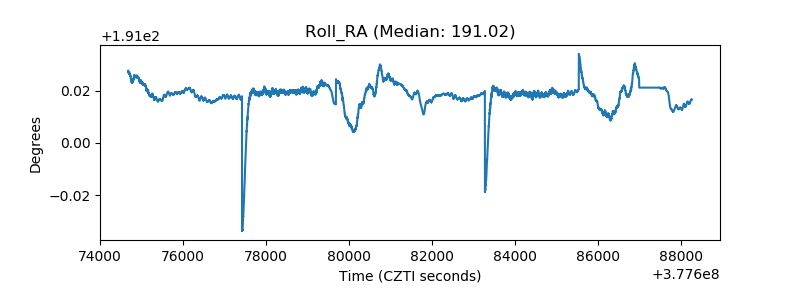 |
| Veto Counter | 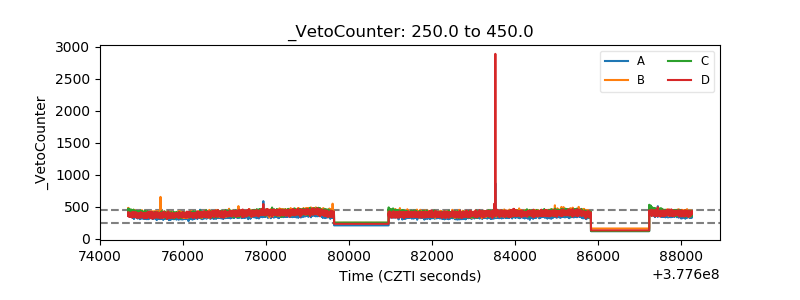 |