| Param | Original file | Final file |
|---|---|---|
| Filename | modeM0/AS1T04_076T01_9000004810_33678cztM0_level2.evt | modeM0/AS1T04_076T01_9000004810_33678cztM0_level2_quad_clean.evt |
| Size (bytes) | 772,505,280 | 50,978,880 |
| Size | 736.7 MB | 48.6 MB |
| Events in quadrant A | 9,880,919 | 15,871 |
| Events in quadrant B | 4,327,804 | 374,415 |
| Events in quadrant C | 5,021,896 | 380,898 |
| Events in quadrant D | 3,777,338 | 370,917 |
| Mode SS | |||
|---|---|---|---|
| Quadrant | BADHDUFLAG | Total packets | Discarded packets |
| A | 0 | 118 | 0 |
| B | 0 | 118 | 0 |
| C | 0 | 118 | 0 |
| D | 0 | 118 | 0 |
| Mode M9 | |||
|---|---|---|---|
| Quadrant | BADHDUFLAG | Total packets | Discarded packets |
| A | 0 | 15 | 0 |
| B | 0 | 15 | 0 |
| C | 0 | 15 | 0 |
| D | 0 | 16 | 0 |
| Mode M0 | |||
|---|---|---|---|
| Quadrant | BADHDUFLAG | Total packets | Discarded packets |
| A | 0 | 33329 | 3 |
| B | 0 | 16446 | 2 |
| C | 0 | 18915 | 2 |
| D | 0 | 14949 | 2 |
| Quadrant | Total seconds | Saturated seconds | Saturation percentage |
|---|---|---|---|
| A | 5705 | 5672 | 99.421560% |
| B | 5705 | 461 | 8.080631% |
| C | 5705 | 375 | 6.573181% |
| D | 5705 | 110 | 1.928133% |
Noise dominated data is calculated using 1-second bins in cleaned event files. If a bin has >2000 counts, and if more than 50% of those come from <1% of pixels, then it is considered to be noise-dominated and hence unusable.
| Quadrant | # 1 sec bins | Bins with >0 counts | Bins with >2000 counts | High rate bins dominated by noise | Noise dominated (total time) | Noise dominated (detector-on time) | Marked lightcurve |
|---|---|---|---|---|---|---|---|
| A | 7229 | 5704 | 2036 | 2036 | 28.16% | 35.69% | 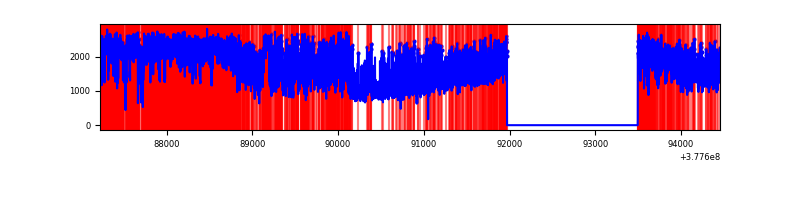 |
| B | 7230 | 5706 | 370 | 370 | 5.12% | 6.48% | 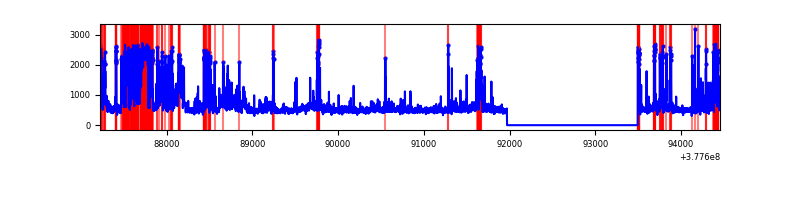 |
| C | 7230 | 5706 | 346 | 346 | 4.79% | 6.06% | 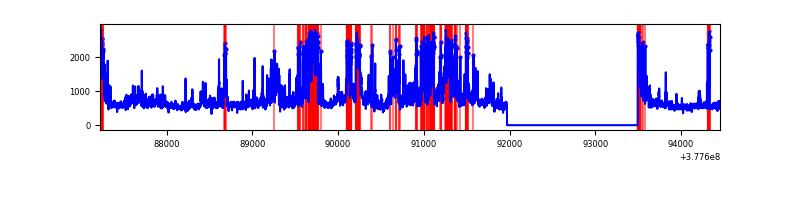 |
| D | 7230 | 5706 | 95 | 95 | 1.31% | 1.66% | 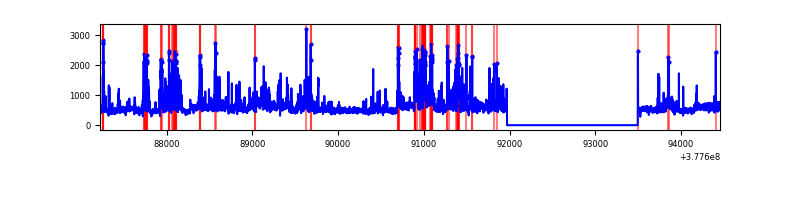 |
Top three noisy pixels from each quadrant. If the there are fewer than three noisy pixels in the level2.evt file, extra rows are filled as -1
| Pixel properties | Quadrant properties | ||||||
|---|---|---|---|---|---|---|---|
| Quadrant | DetID | PixID | Counts | Sigma | Mean | Median | Sigma |
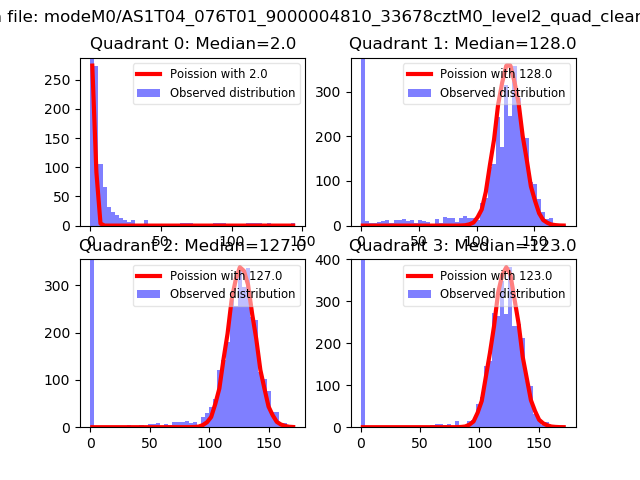
| A | 15 | 169 | 9681032 | 900864.23 | 43 | 42 | 10.7 |
| A | 15 | 237 | 28324 | 2631.78 | 43 | 42 | 10.7 |
| A | 10 | 83 | 2163 | 197.37 | 43 | 42 | 10.7 |
| B | 5 | 172 | 1329392 | 10557.66 | 655 | 638 | 125.9 |
| B | 4 | 170 | 251859 | 1996.08 | 655 | 638 | 125.9 |
| B | 15 | 222 | 48100 | 377.11 | 655 | 638 | 125.9 |
| C | 3 | 233 | 1995332 | 13248.2 | 646 | 652 | 150.6 |
| C | 15 | 214 | 244917 | 1622.35 | 646 | 652 | 150.6 |
| C | 0 | 10 | 164499 | 1088.23 | 646 | 652 | 150.6 |
| D | 8 | 195 | 301154 | 1838.75 | 661 | 644 | 163.4 |
| D | 2 | 250 | 281800 | 1720.33 | 661 | 644 | 163.4 |
| D | 13 | 249 | 170275 | 1037.93 | 661 | 644 | 163.4 |
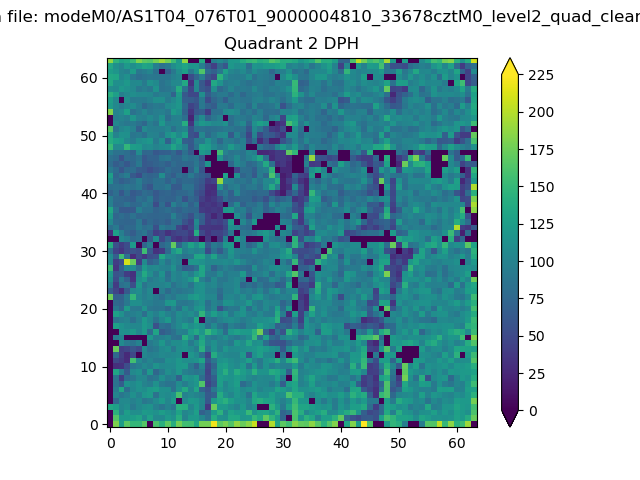
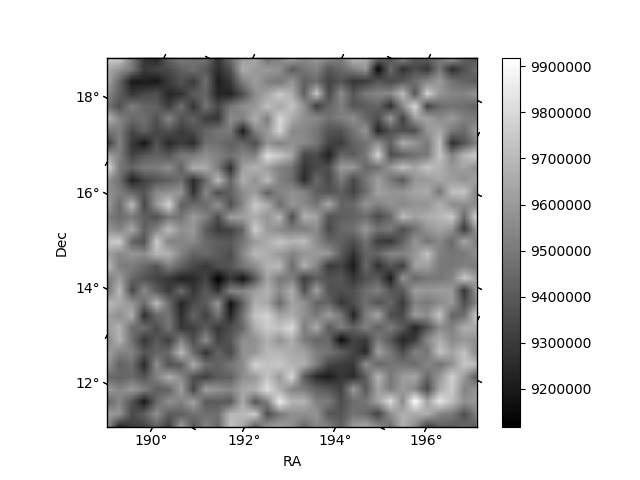
Histogram calculated using DETX and DETY for each event in the final _common_clean file
| Quadrant A | 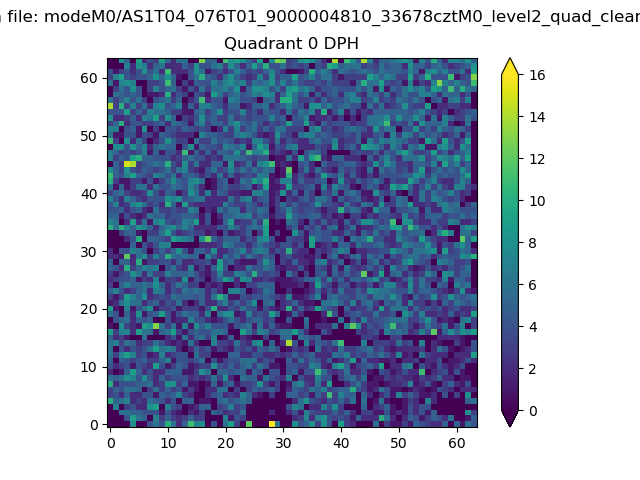 |
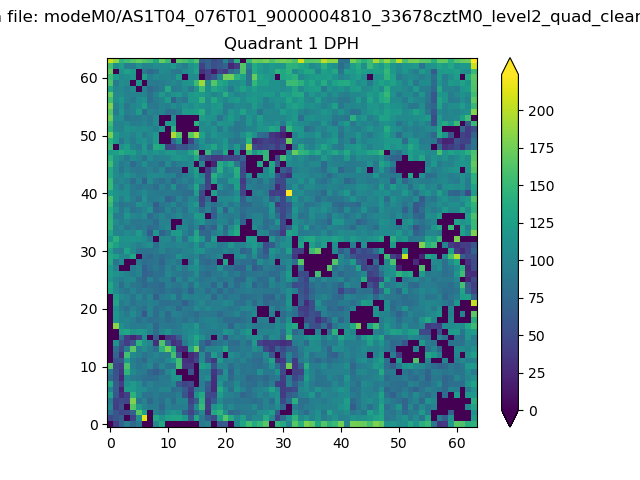 |
Quadrant B |
|---|---|---|---|
| Quadrant D | 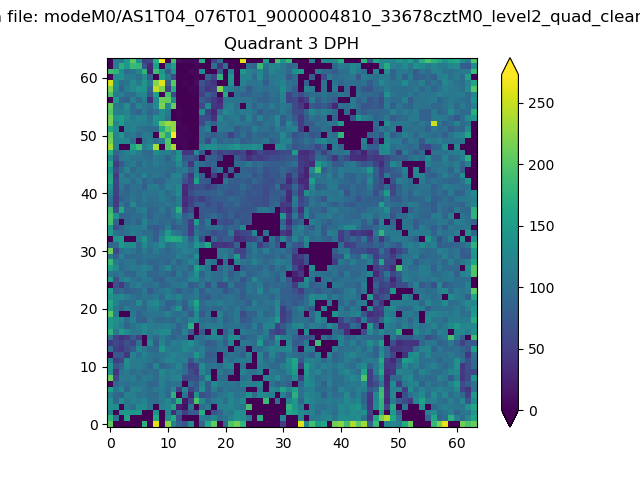 |
 |
Quadrant C |
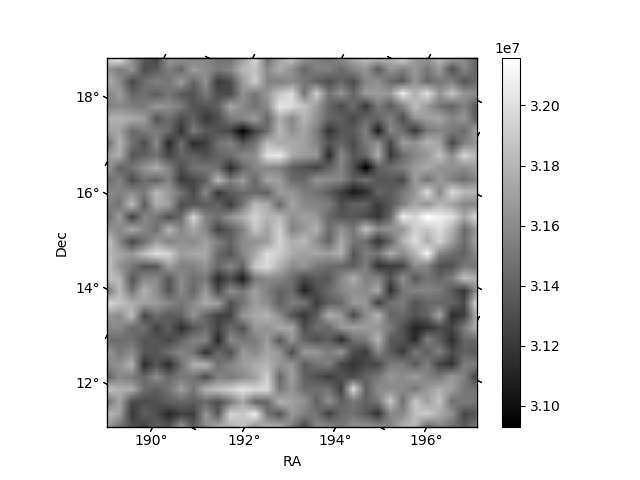
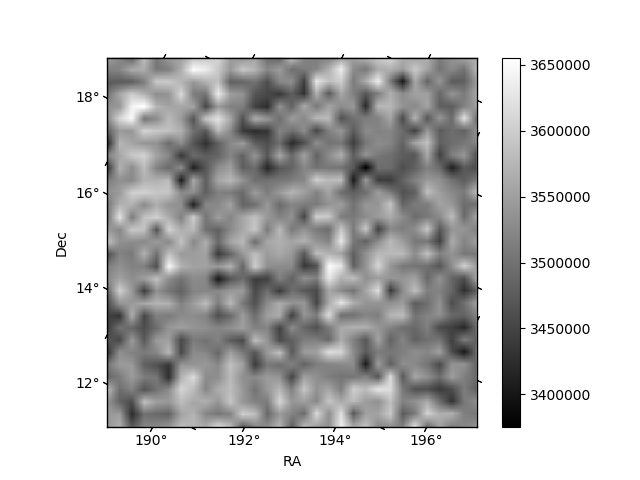
| Plot type | Count rate plots | Images |
|---|---|---|
| Comparison with Poisson distribution Blue bars denote a histogram of data divided into 1 sec bins. Red curve is a Poisson curve with rate = median count rate of data. |
 |
 |
| Quadrant-wise count rates Data is divided into 100 sec bins |
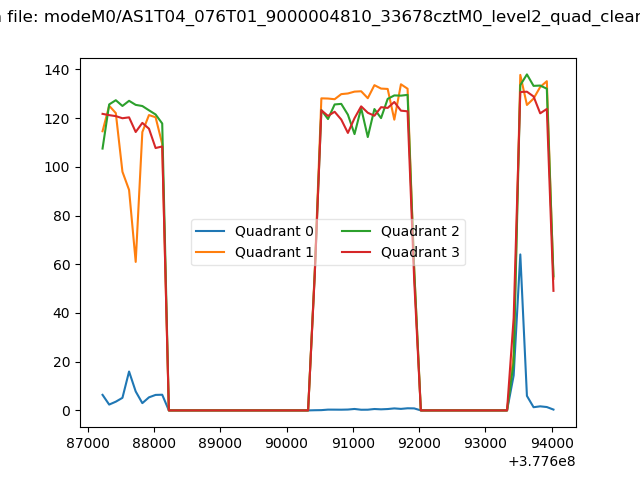 |
|
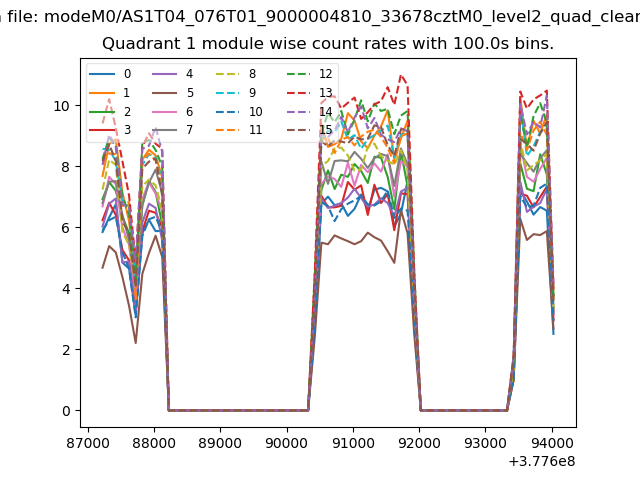
| Module-wise count rates for Quadrant A Data is divided into 100 sec bins |
 |
 |
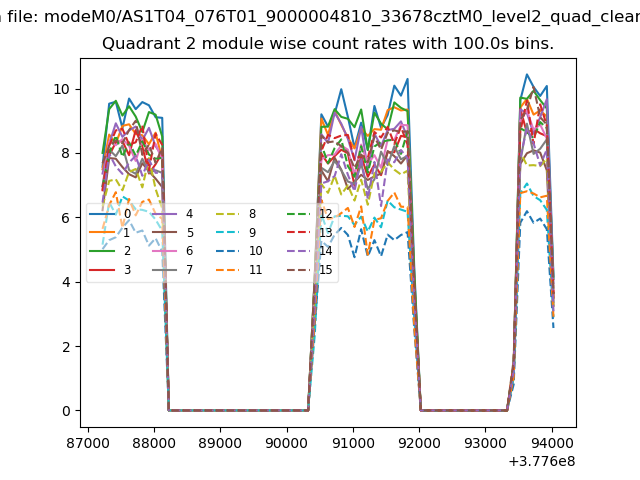
| Module-wise count rates for Quadrant B Data is divided into 100 sec bins |
 |
 |
| Module-wise count rates for Quadrant C Data is divided into 100 sec bins |
 |
 |
| Module-wise count rates for Quadrant D Data is divided into 100 sec bins |
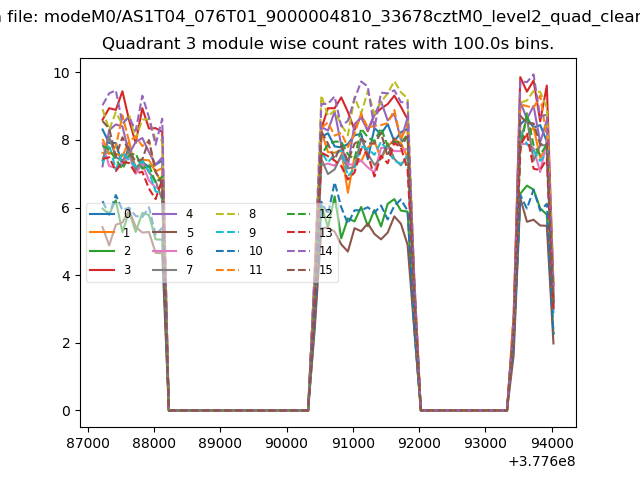 |
 |
| Parameter | Plot |
|---|---|
| CZT HV Monitor | 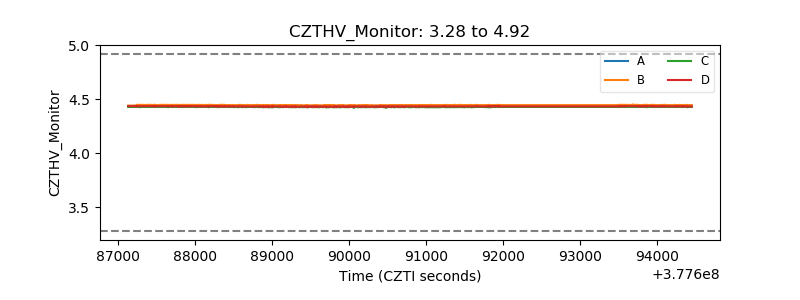 |
| D_VDD | 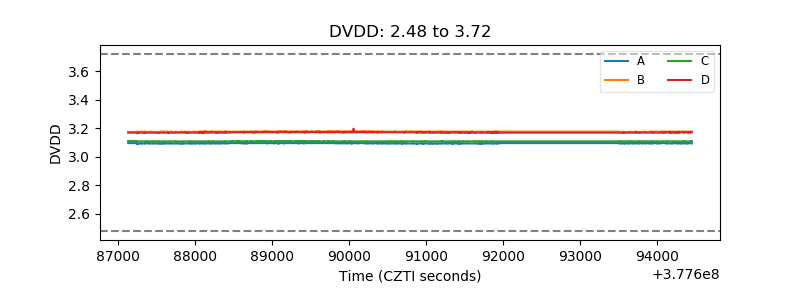 |
| Temperature 1 | 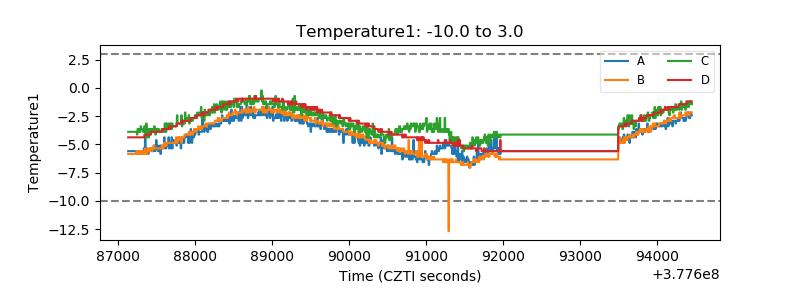 |
| Veto HV Monitor | 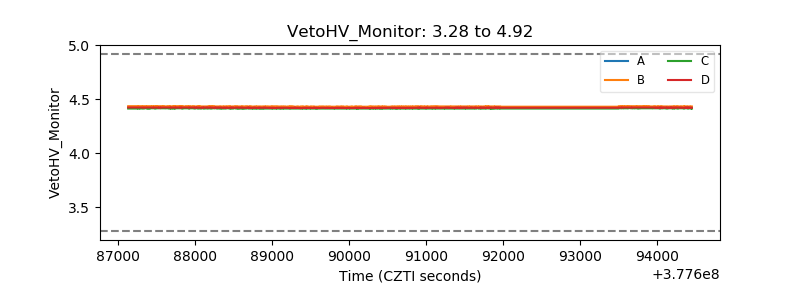 |
| Veto LLD | 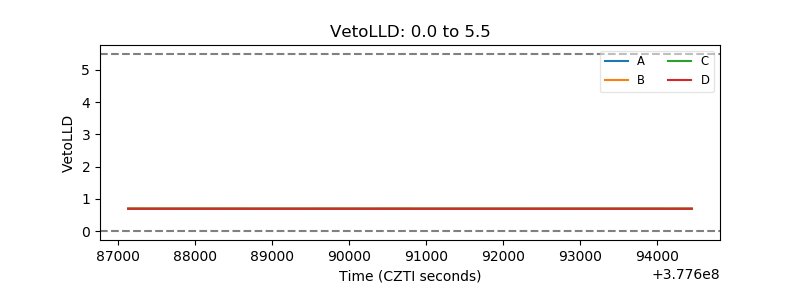 |
| Alpha Counter | 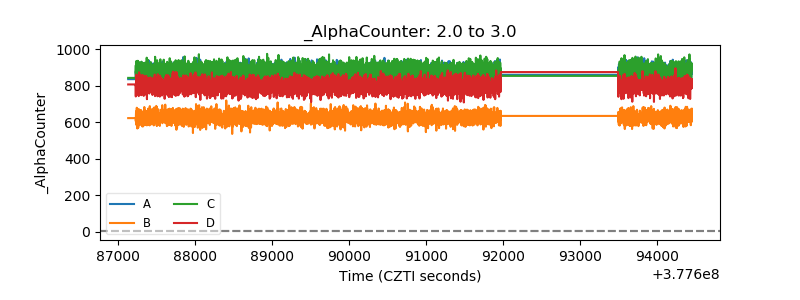 |
| _CPM_Rate | 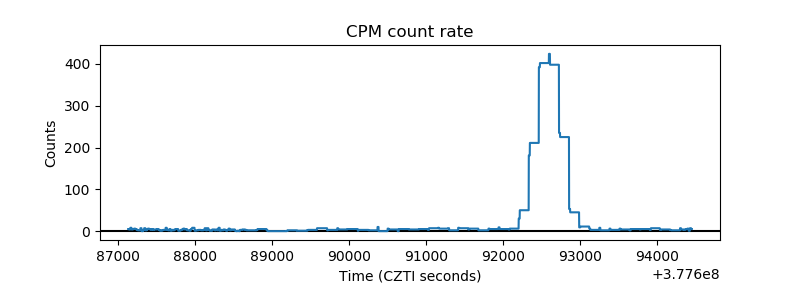 |
| CZT Counter | 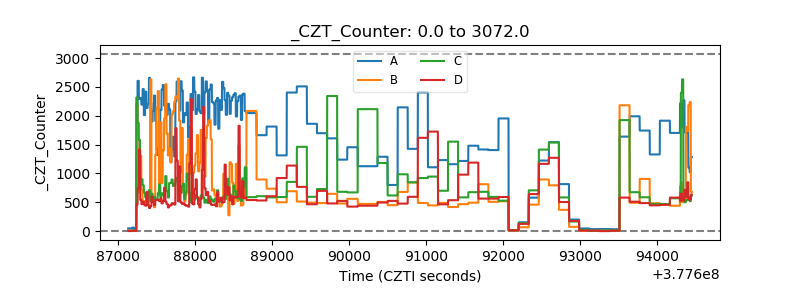 |
| +2.5 Volts monitor |  |
| +5 Volts monitor |  |
| _ROLL_ROT | 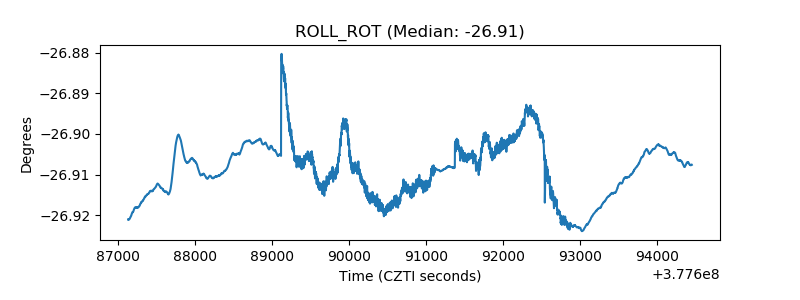 |
| _Roll_DEC |  |
| _Roll_RA | 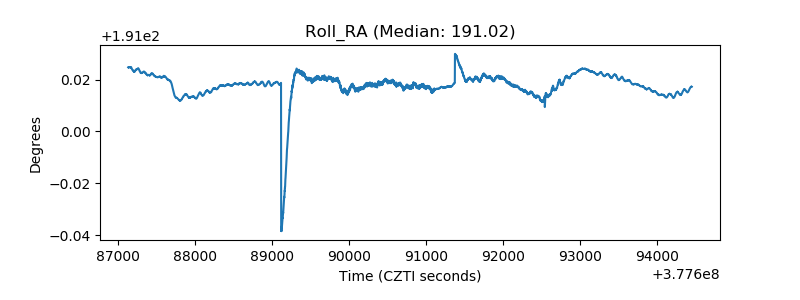 |
| Veto Counter | 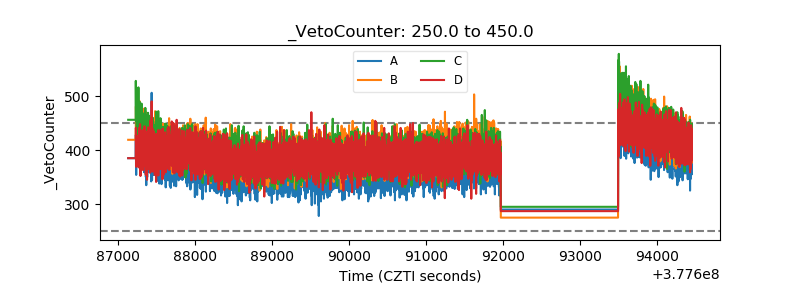 |