| Param | Original file | Final file |
|---|---|---|
| Filename | modeM0/AS1T04_076T01_9000004810_33679cztM0_level2.evt | modeM0/AS1T04_076T01_9000004810_33679cztM0_level2_quad_clean.evt |
| Size (bytes) | 665,893,440 | 43,151,040 |
| Size | 635.0 MB | 41.2 MB |
| Events in quadrant A | 8,539,425 | 9,350 |
| Events in quadrant B | 3,997,430 | 307,249 |
| Events in quadrant C | 3,373,987 | 311,232 |
| Events in quadrant D | 3,883,856 | 294,354 |
| Mode SS | |||
|---|---|---|---|
| Quadrant | BADHDUFLAG | Total packets | Discarded packets |
| A | 0 | 112 | 0 |
| B | 0 | 112 | 0 |
| C | 0 | 112 | 0 |
| D | 0 | 112 | 0 |
| Mode M9 | |||
|---|---|---|---|
| Quadrant | BADHDUFLAG | Total packets | Discarded packets |
| A | 0 | 17 | 0 |
| B | 0 | 17 | 0 |
| C | 0 | 17 | 0 |
| D | 0 | 17 | 0 |
| Mode M0 | |||
|---|---|---|---|
| Quadrant | BADHDUFLAG | Total packets | Discarded packets |
| A | 0 | 29205 | 2 |
| B | 0 | 15461 | 1 |
| C | 0 | 13398 | 1 |
| D | 0 | 15279 | 1 |
| Quadrant | Total seconds | Saturated seconds | Saturation percentage |
|---|---|---|---|
| A | 5463 | 5442 | 99.615596% |
| B | 5463 | 258 | 4.722680% |
| C | 5463 | 62 | 1.134908% |
| D | 5463 | 109 | 1.995241% |
Noise dominated data is calculated using 1-second bins in cleaned event files. If a bin has >2000 counts, and if more than 50% of those come from <1% of pixels, then it is considered to be noise-dominated and hence unusable.
| Quadrant | # 1 sec bins | Bins with >0 counts | Bins with >2000 counts | High rate bins dominated by noise | Noise dominated (total time) | Noise dominated (detector-on time) | Marked lightcurve |
|---|---|---|---|---|---|---|---|
| A | 7135 | 5462 | 785 | 785 | 11.00% | 14.37% | 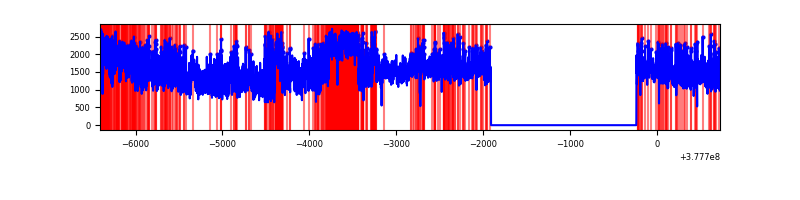 |
| B | 7136 | 5464 | 167 | 167 | 2.34% | 3.06% | 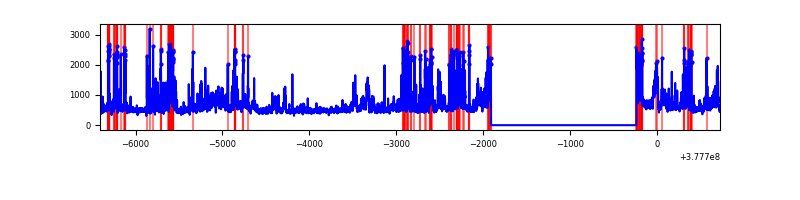 |
| C | 7136 | 5464 | 48 | 48 | 0.67% | 0.88% | 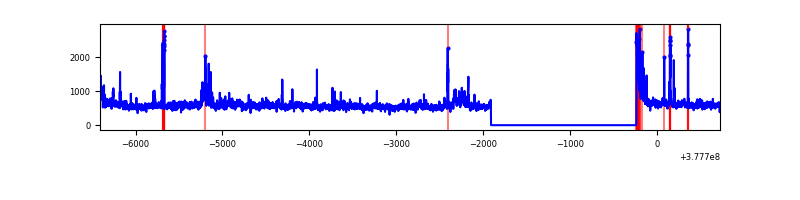 |
| D | 7136 | 5464 | 89 | 89 | 1.25% | 1.63% | 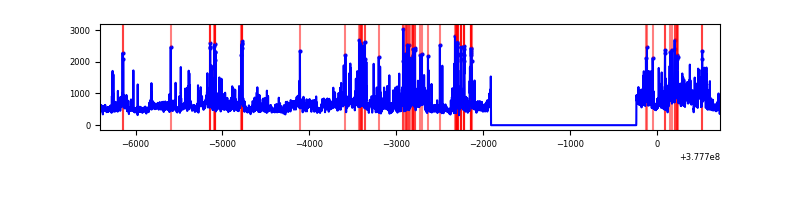 |
Top three noisy pixels from each quadrant. If the there are fewer than three noisy pixels in the level2.evt file, extra rows are filled as -1
| Pixel properties | Quadrant properties | ||||||
|---|---|---|---|---|---|---|---|
| Quadrant | DetID | PixID | Counts | Sigma | Mean | Median | Sigma |
| A | 15 | 169 | 8411343 | 1111693.32 | 28 | 27 | 7.6 |
| A | 15 | 237 | 17564 | 2317.8 | 28 | 27 | 7.6 |
| A | 13 | 254 | 501 | 62.65 | 28 | 27 | 7.6 |
| B | 5 | 172 | 749322 | 5996.06 | 649 | 632 | 124.9 |
| B | 4 | 170 | 576929 | 4615.41 | 649 | 632 | 124.9 |
| B | 0 | 213 | 26100 | 203.96 | 649 | 632 | 124.9 |
| C | 3 | 233 | 493910 | 3301.06 | 645 | 652 | 149.4 |
| C | 15 | 214 | 234111 | 1562.39 | 645 | 652 | 149.4 |
| C | 0 | 10 | 111612 | 742.58 | 645 | 652 | 149.4 |
| D | 8 | 195 | 465853 | 2912.81 | 647 | 630 | 159.7 |
| D | 10 | 118 | 283084 | 1768.47 | 647 | 630 | 159.7 |
| D | 13 | 249 | 200435 | 1251.0 | 647 | 630 | 159.7 |
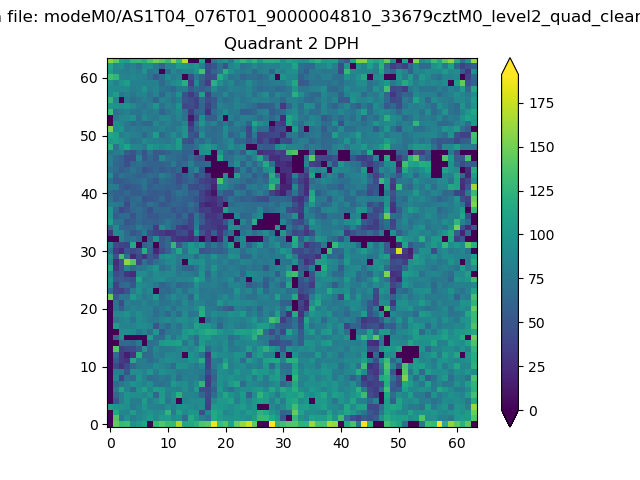
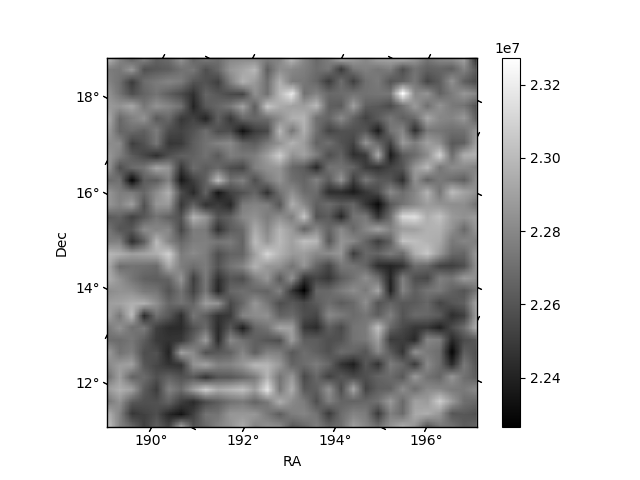
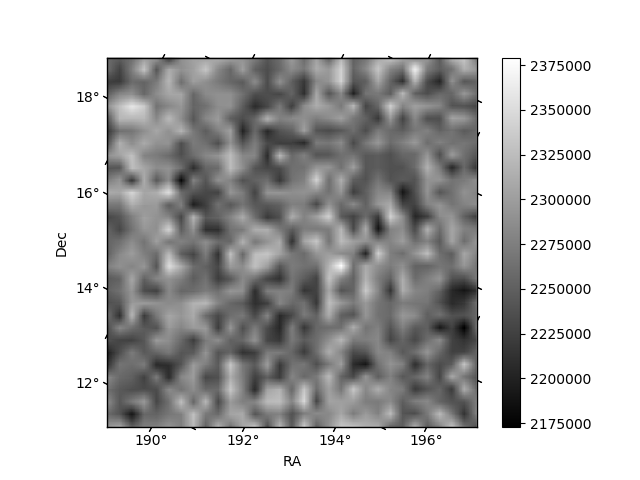
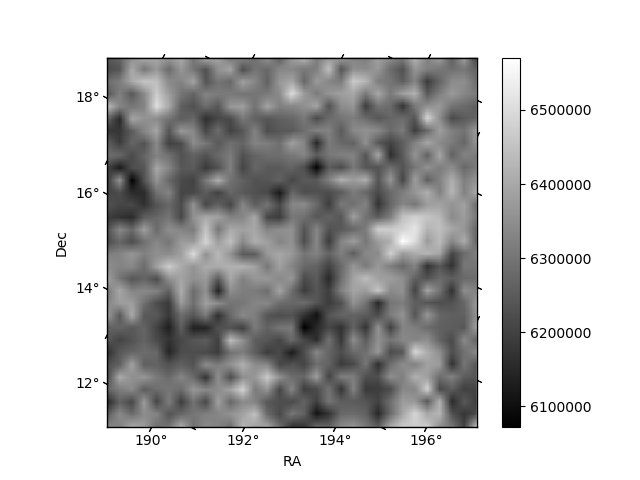
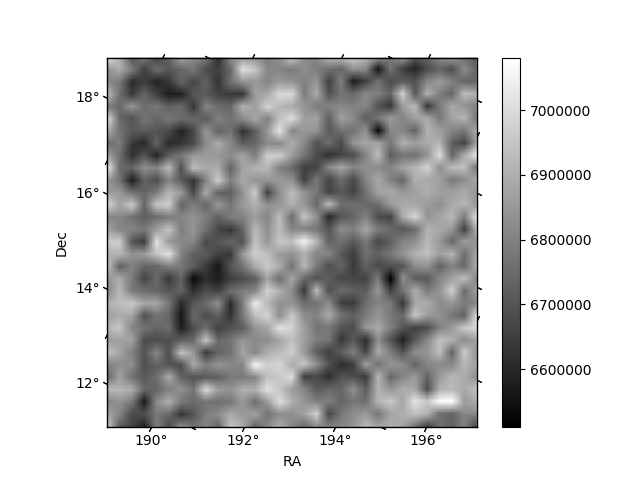
Histogram calculated using DETX and DETY for each event in the final _common_clean file
| Quadrant A | 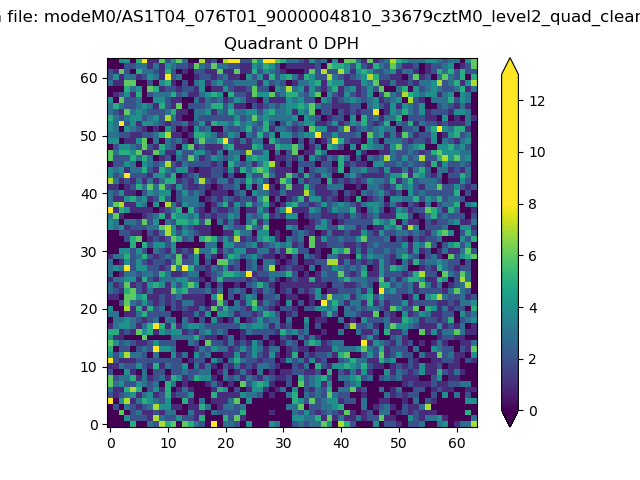 |
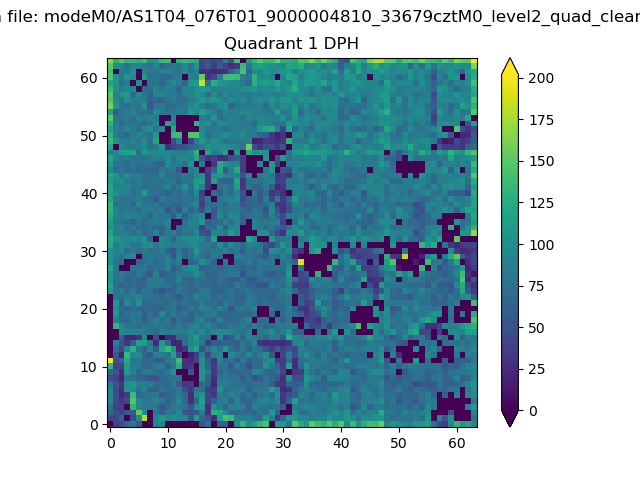 |
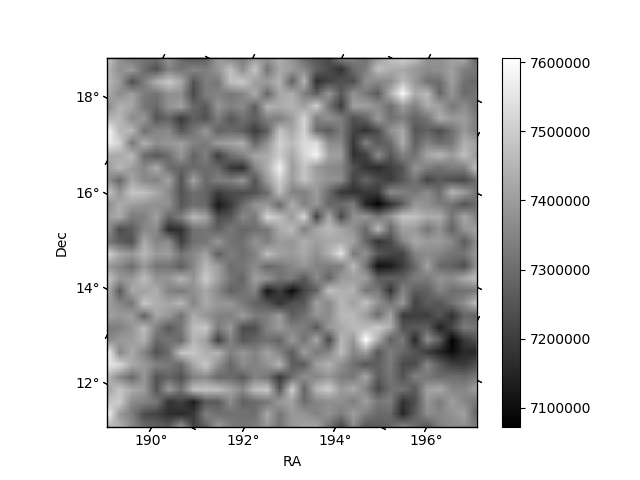
Quadrant B |
|---|---|---|---|
| Quadrant D | 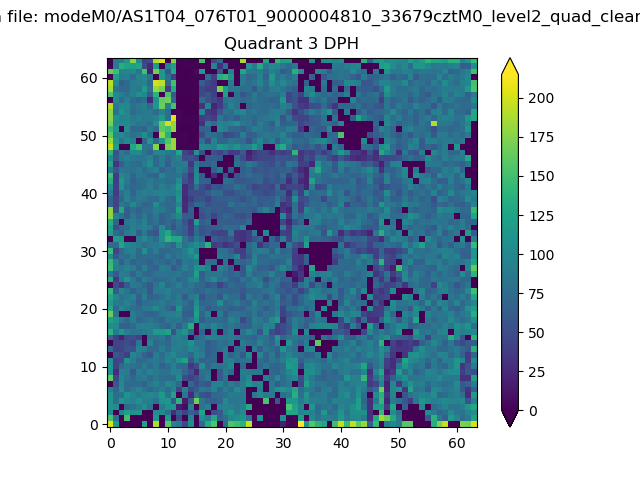 |
 |
Quadrant C |
| Plot type | Count rate plots | Images |
|---|---|---|
| Comparison with Poisson distribution Blue bars denote a histogram of data divided into 1 sec bins. Red curve is a Poisson curve with rate = median count rate of data. |
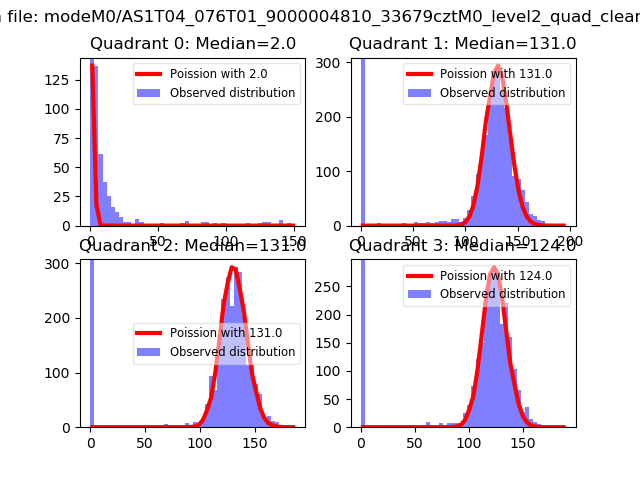 |
 |
| Quadrant-wise count rates Data is divided into 100 sec bins |
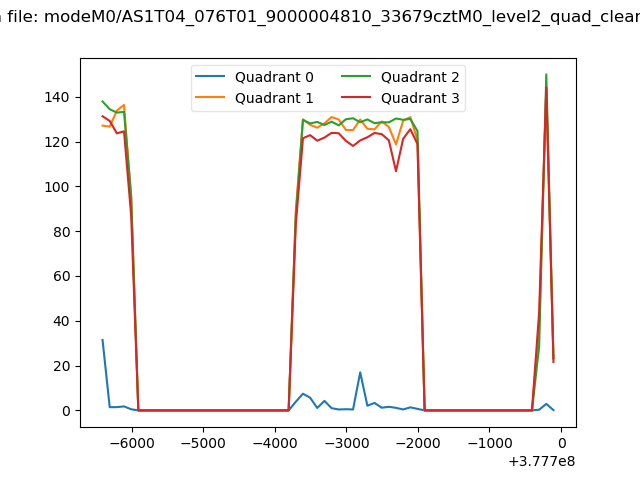 |
|
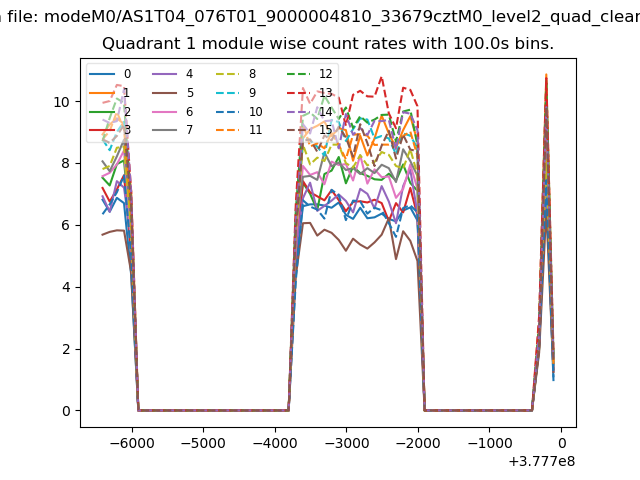
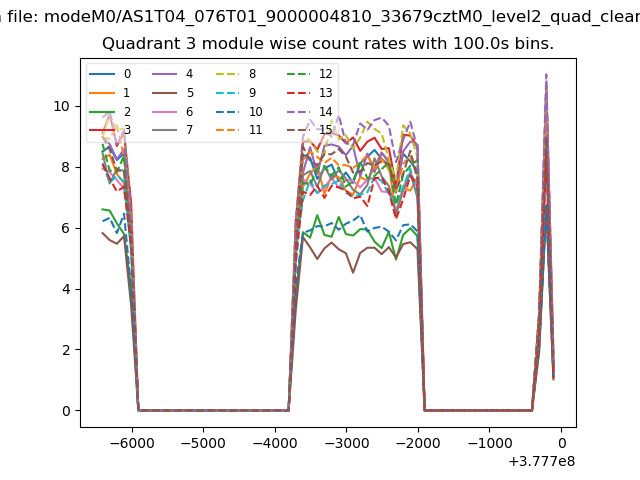
| Module-wise count rates for Quadrant A Data is divided into 100 sec bins |
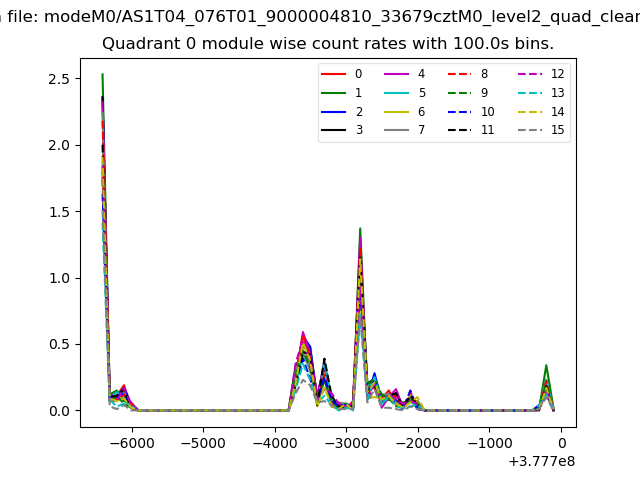 |
 |
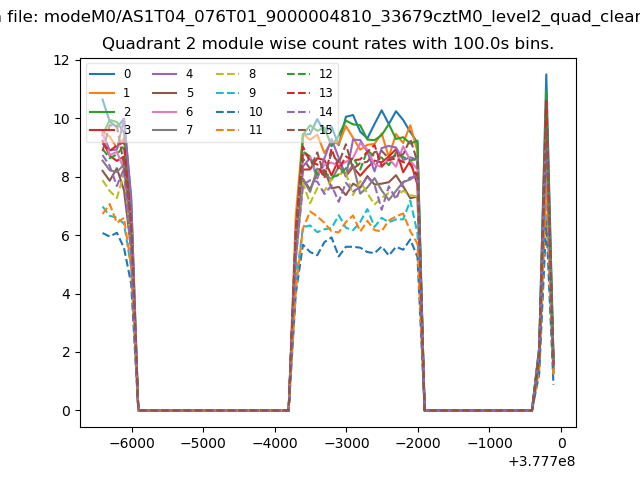
| Module-wise count rates for Quadrant B Data is divided into 100 sec bins |
 |
 |
| Module-wise count rates for Quadrant C Data is divided into 100 sec bins |
 |
 |
| Module-wise count rates for Quadrant D Data is divided into 100 sec bins |
 |
 |
| Parameter | Plot |
|---|---|
| CZT HV Monitor | 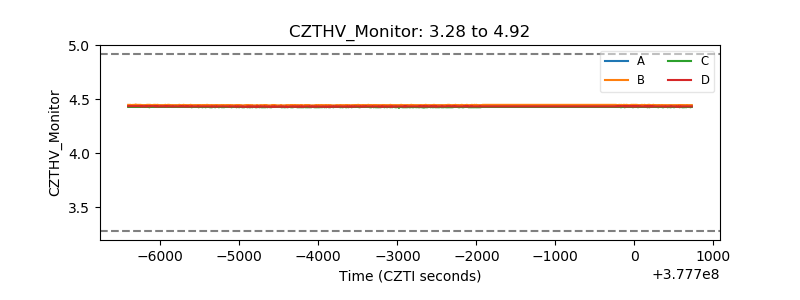 |
| D_VDD | 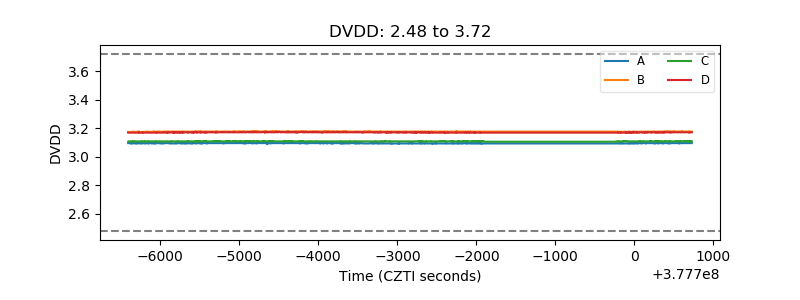 |
| Temperature 1 | 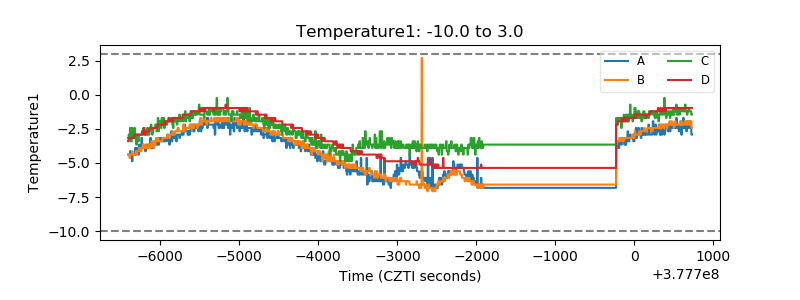 |
| Veto HV Monitor | 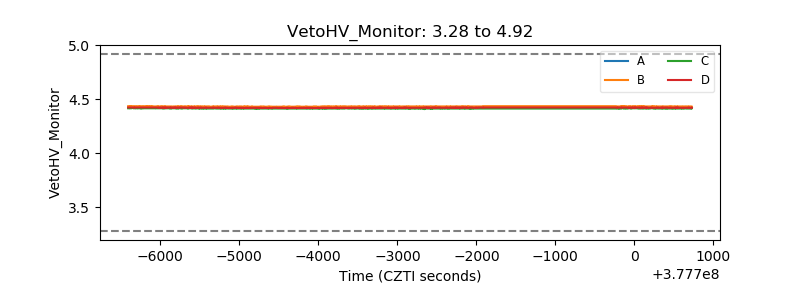 |
| Veto LLD | 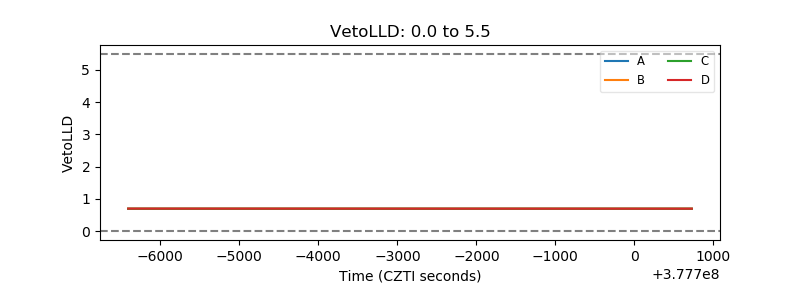 |
| Alpha Counter | 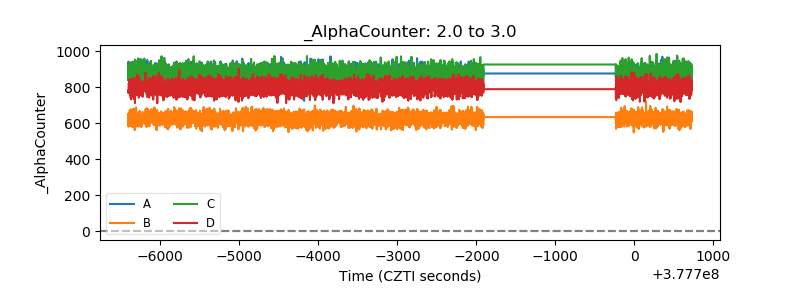 |
| _CPM_Rate | 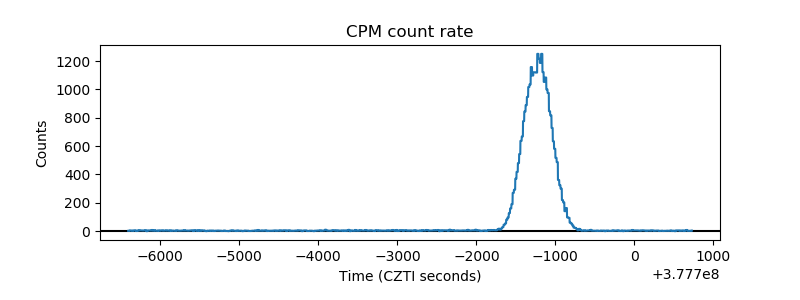 |
| CZT Counter | 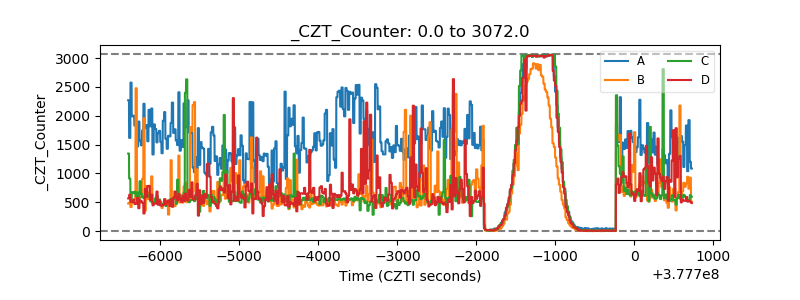 |
| +2.5 Volts monitor |  |
| +5 Volts monitor |  |
| _ROLL_ROT | 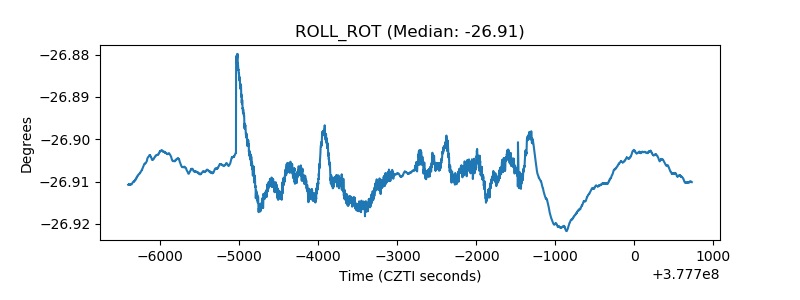 |
| _Roll_DEC | 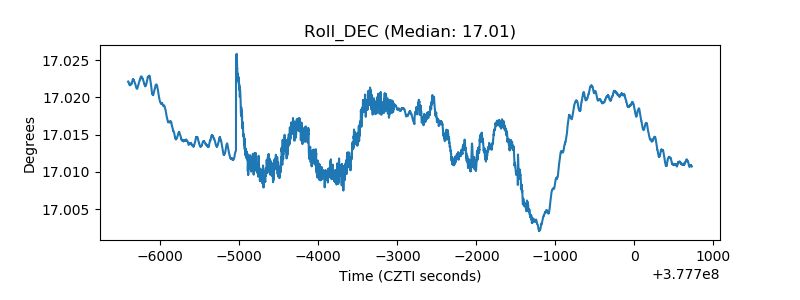 |
| _Roll_RA | 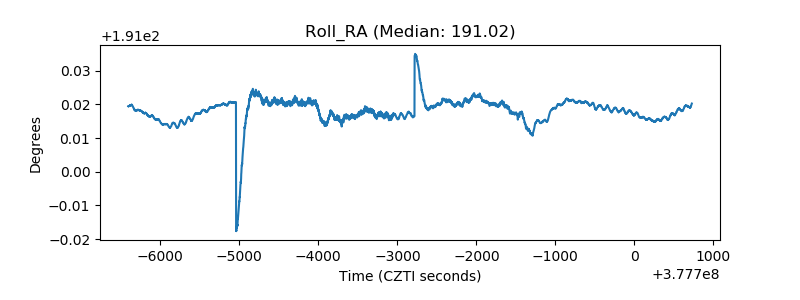 |
| Veto Counter |  |