| Param | Original file | Final file |
|---|---|---|
| Filename | modeM0/AS1T04_076T01_9000004810_33681cztM0_level2.evt | modeM0/AS1T04_076T01_9000004810_33681cztM0_level2_quad_clean.evt |
| Size (bytes) | 621,195,840 | 49,115,520 |
| Size | 592.4 MB | 46.8 MB |
| Events in quadrant A | 6,785,842 | 256,059 |
| Events in quadrant B | 3,667,670 | 288,481 |
| Events in quadrant C | 3,361,933 | 292,176 |
| Events in quadrant D | 4,638,035 | 277,792 |
| Mode SS | |||
|---|---|---|---|
| Quadrant | BADHDUFLAG | Total packets | Discarded packets |
| A | 0 | 108 | 0 |
| B | 0 | 108 | 0 |
| C | 0 | 108 | 0 |
| D | 0 | 108 | 0 |
| Mode M9 | |||
|---|---|---|---|
| Quadrant | BADHDUFLAG | Total packets | Discarded packets |
| A | 0 | 18 | 0 |
| B | 0 | 18 | 0 |
| C | 0 | 18 | 0 |
| D | 0 | 19 | 0 |
| Mode M0 | |||
|---|---|---|---|
| Quadrant | BADHDUFLAG | Total packets | Discarded packets |
| A | 0 | 23863 | 3 |
| B | 0 | 14450 | 2 |
| C | 0 | 13490 | 2 |
| D | 0 | 17541 | 2 |
| Quadrant | Total seconds | Saturated seconds | Saturation percentage |
|---|---|---|---|
| A | 5312 | 2266 | 42.658133% |
| B | 5312 | 238 | 4.480422% |
| C | 5312 | 82 | 1.543675% |
| D | 5312 | 303 | 5.704066% |
Noise dominated data is calculated using 1-second bins in cleaned event files. If a bin has >2000 counts, and if more than 50% of those come from <1% of pixels, then it is considered to be noise-dominated and hence unusable.
| Quadrant | # 1 sec bins | Bins with >0 counts | Bins with >2000 counts | High rate bins dominated by noise | Noise dominated (total time) | Noise dominated (detector-on time) | Marked lightcurve |
|---|---|---|---|---|---|---|---|
| A | 7105 | 5312 | 748 | 748 | 10.53% | 14.08% |  |
| B | 7106 | 5313 | 165 | 165 | 2.32% | 3.11% | 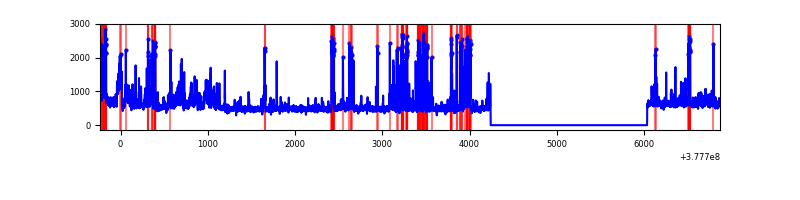 |
| C | 7106 | 5313 | 67 | 67 | 0.94% | 1.26% | 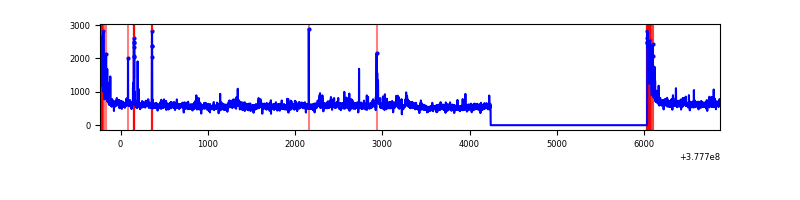 |
| D | 7106 | 5313 | 297 | 297 | 4.18% | 5.59% | 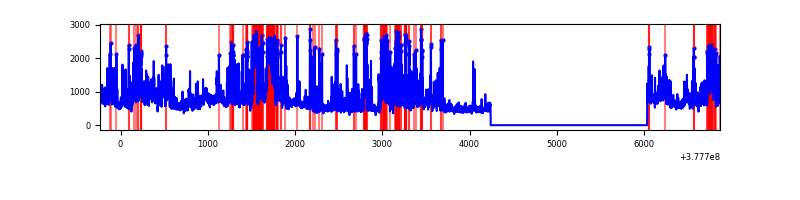 |
Top three noisy pixels from each quadrant. If the there are fewer than three noisy pixels in the level2.evt file, extra rows are filled as -1
| Pixel properties | Quadrant properties | ||||||
|---|---|---|---|---|---|---|---|
| Quadrant | DetID | PixID | Counts | Sigma | Mean | Median | Sigma |
| A | 15 | 169 | 4734864 | 52371.71 | 448 | 439 | 90.4 |
| A | 15 | 237 | 302472 | 3341.06 | 448 | 439 | 90.4 |
| A | 13 | 6 | 9005 | 94.76 | 448 | 439 | 90.4 |
| B | 5 | 172 | 631071 | 5051.72 | 655 | 640 | 124.8 |
| B | 4 | 170 | 263638 | 2107.43 | 655 | 640 | 124.8 |
| B | 0 | 213 | 33535 | 263.59 | 655 | 640 | 124.8 |
| C | 3 | 233 | 340465 | 2287.01 | 651 | 657 | 148.6 |
| C | 15 | 214 | 229426 | 1539.68 | 651 | 657 | 148.6 |
| C | 0 | 10 | 222731 | 1494.62 | 651 | 657 | 148.6 |
| D | 2 | 250 | 785996 | 4937.29 | 646 | 626 | 159.1 |
| D | 8 | 195 | 514089 | 3227.93 | 646 | 626 | 159.1 |
| D | 10 | 118 | 193636 | 1213.37 | 646 | 626 | 159.1 |
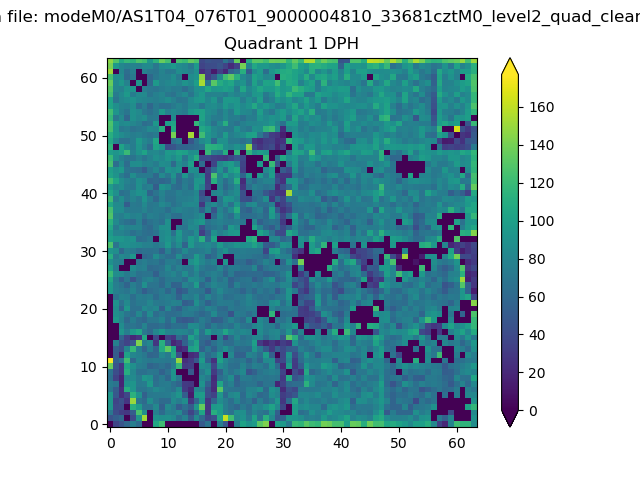
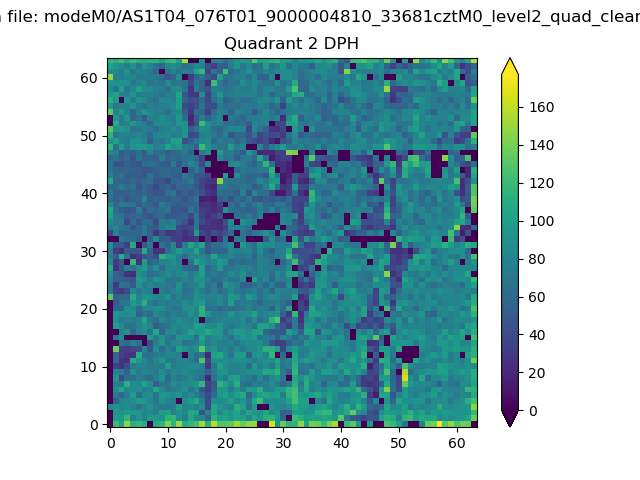
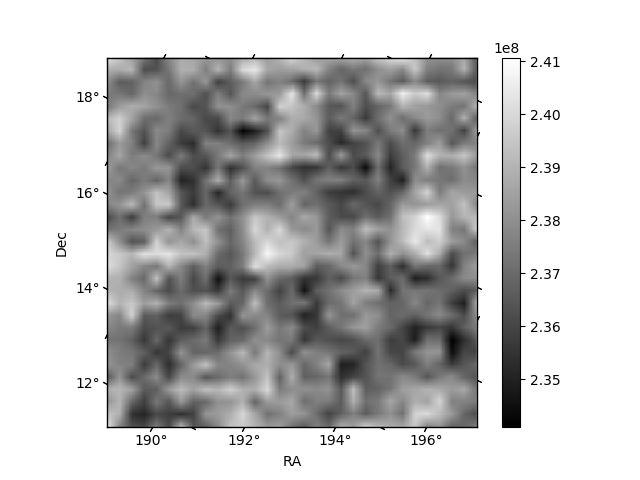
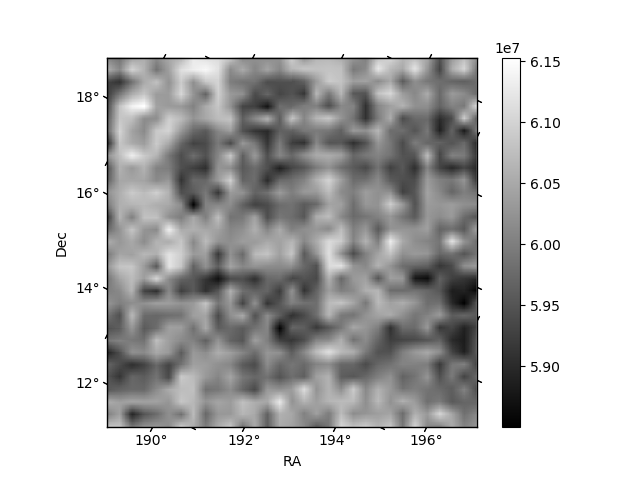
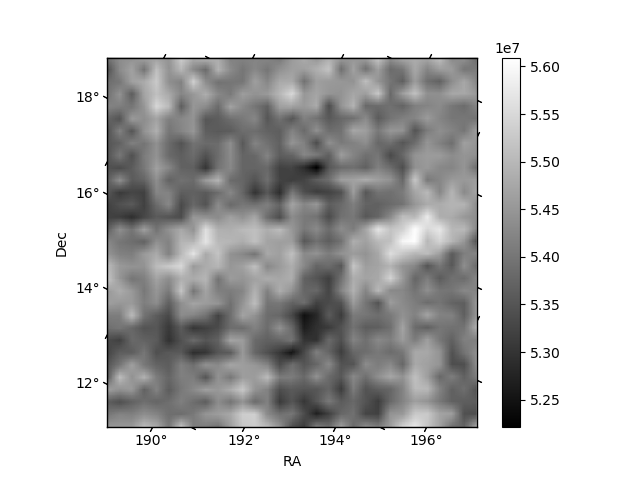
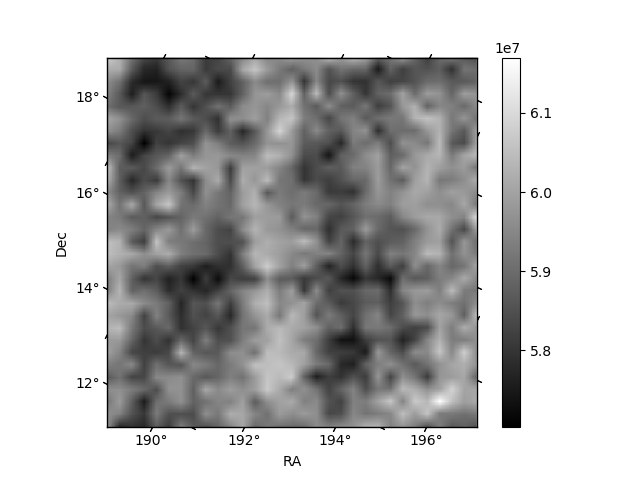
Histogram calculated using DETX and DETY for each event in the final _common_clean file
| Quadrant A | 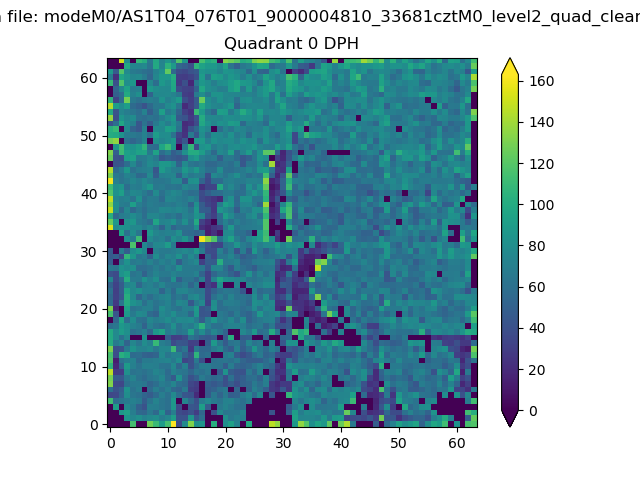 |
 |
Quadrant B |
|---|---|---|---|
| Quadrant D | 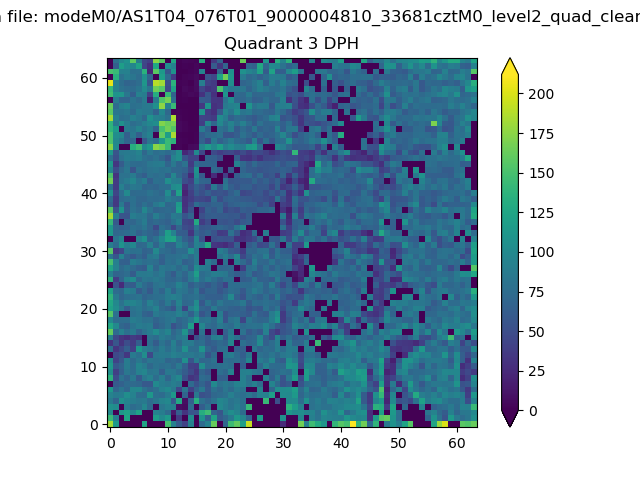 |
 |
Quadrant C |
| Plot type | Count rate plots | Images |
|---|---|---|
| Comparison with Poisson distribution Blue bars denote a histogram of data divided into 1 sec bins. Red curve is a Poisson curve with rate = median count rate of data. |
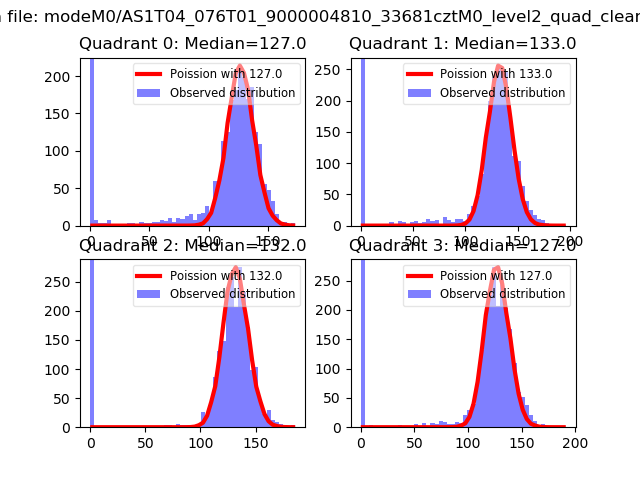 |
 |
| Quadrant-wise count rates Data is divided into 100 sec bins |
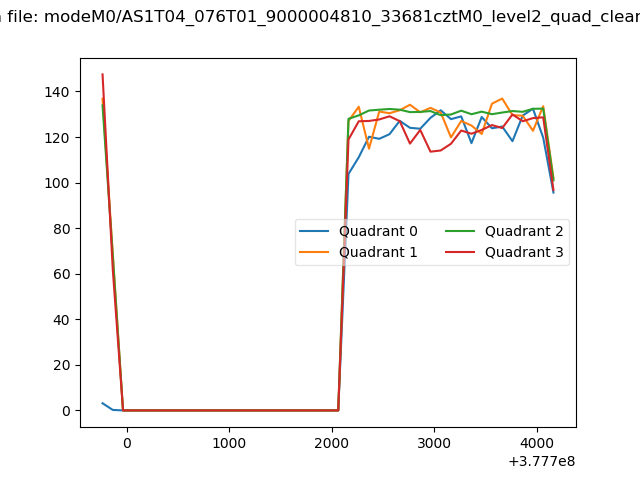 |
|
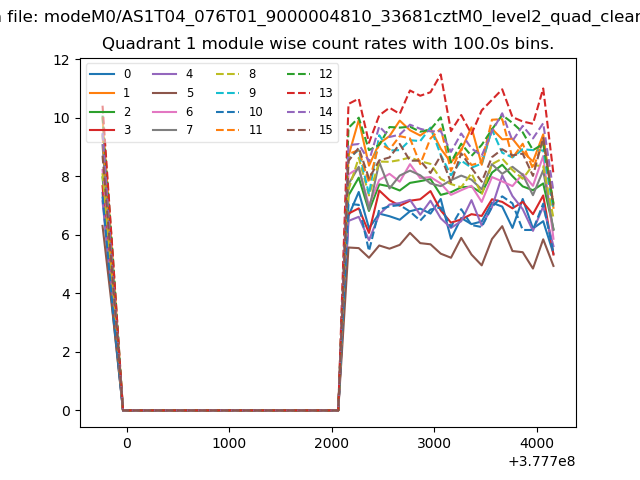
| Module-wise count rates for Quadrant A Data is divided into 100 sec bins |
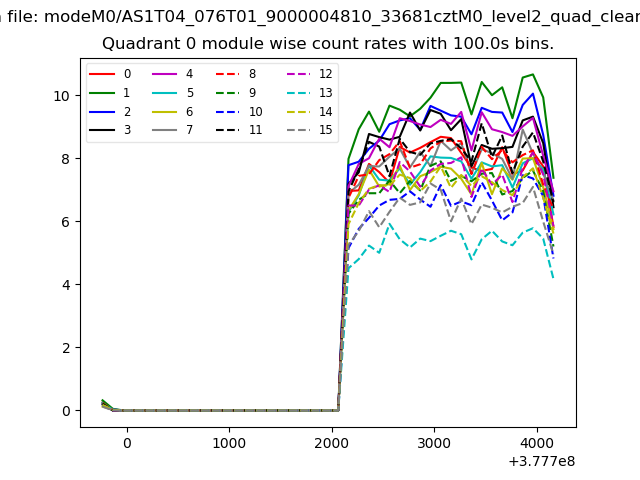 |
 |
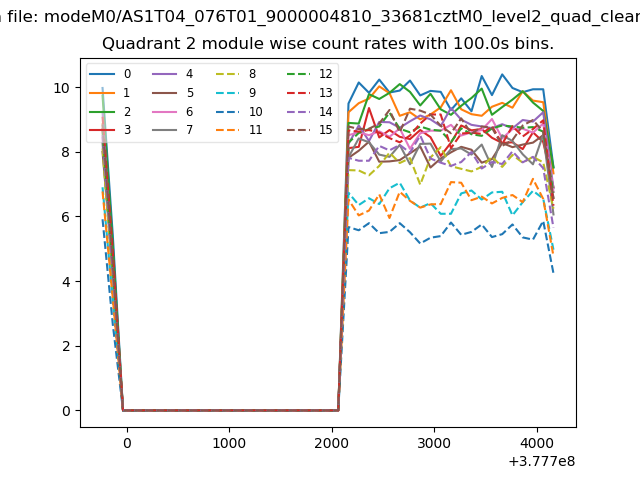
| Module-wise count rates for Quadrant B Data is divided into 100 sec bins |
 |
 |
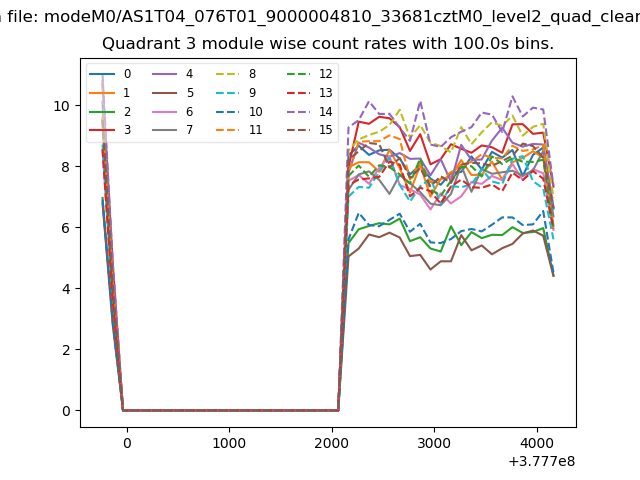
| Module-wise count rates for Quadrant C Data is divided into 100 sec bins |
 |
 |
| Module-wise count rates for Quadrant D Data is divided into 100 sec bins |
 |
 |
| Parameter | Plot |
|---|---|
| CZT HV Monitor | 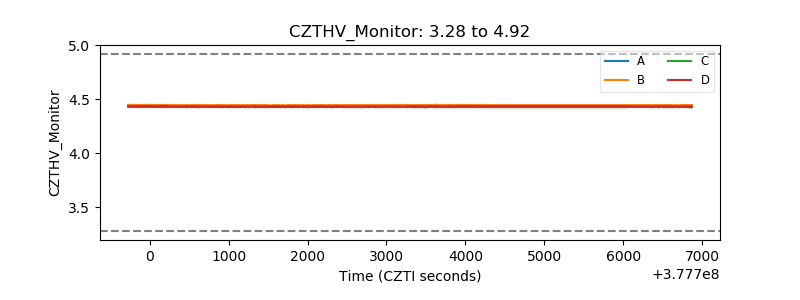 |
| D_VDD | 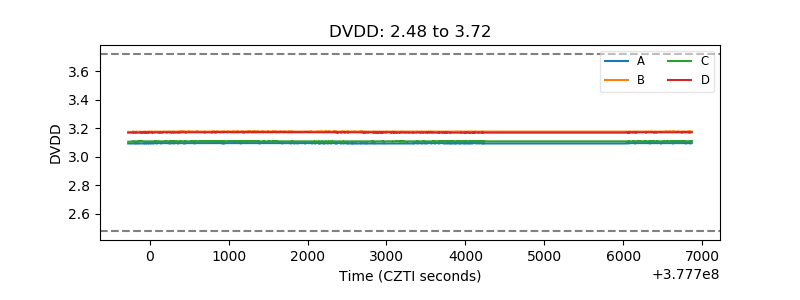 |
| Temperature 1 | 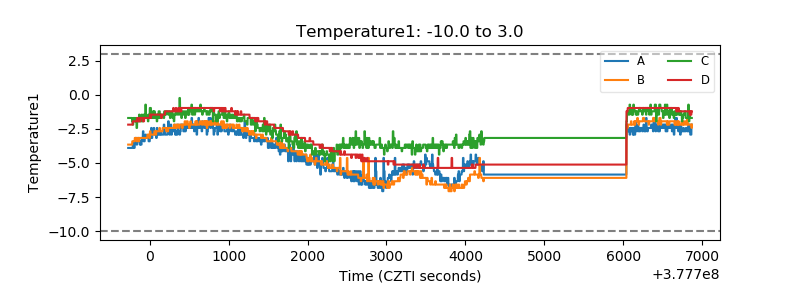 |
| Veto HV Monitor | 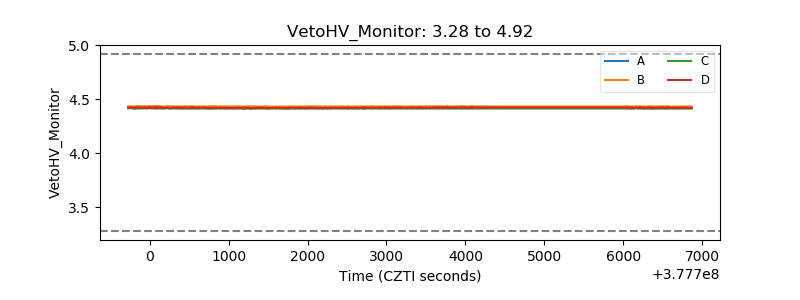 |
| Veto LLD | 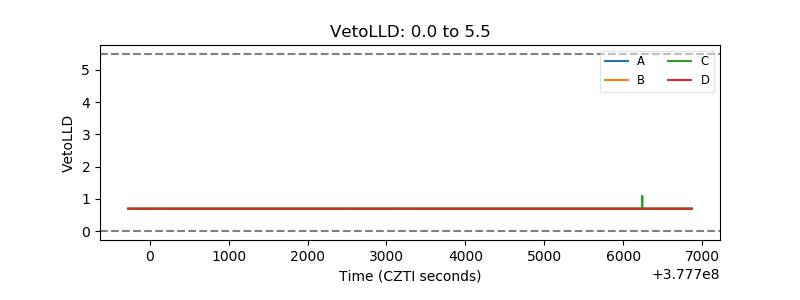 |
| Alpha Counter | 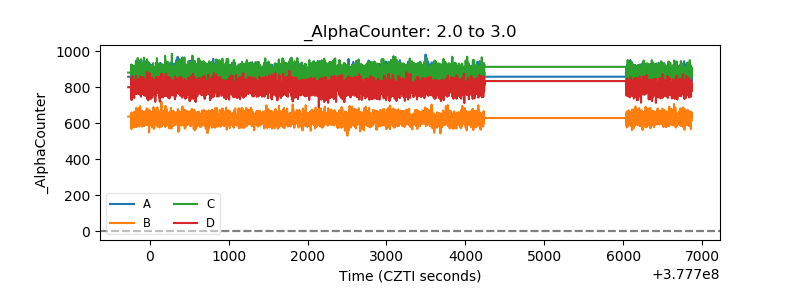 |
| _CPM_Rate | 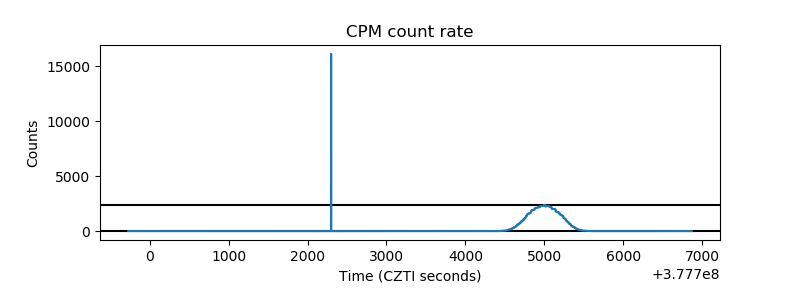 |
| CZT Counter | 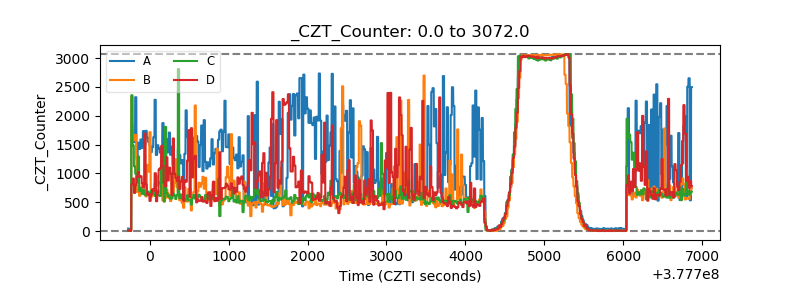 |
| +2.5 Volts monitor |  |
| +5 Volts monitor | 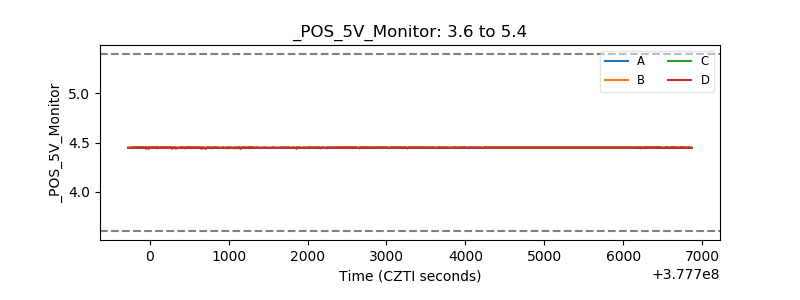 |
| _ROLL_ROT | 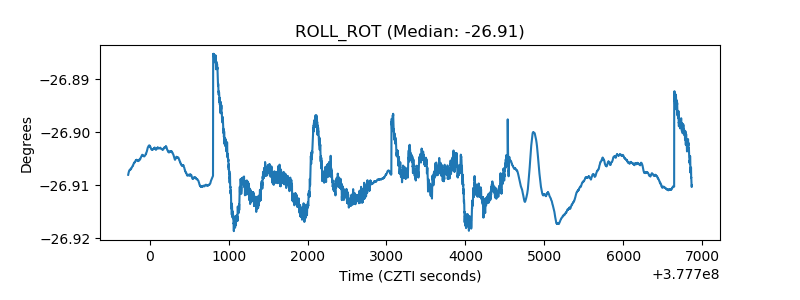 |
| _Roll_DEC | 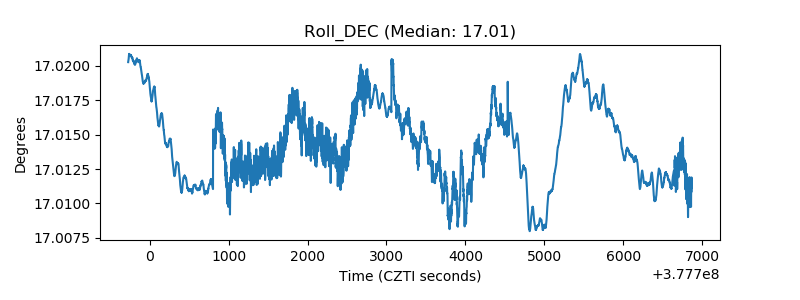 |
| _Roll_RA | 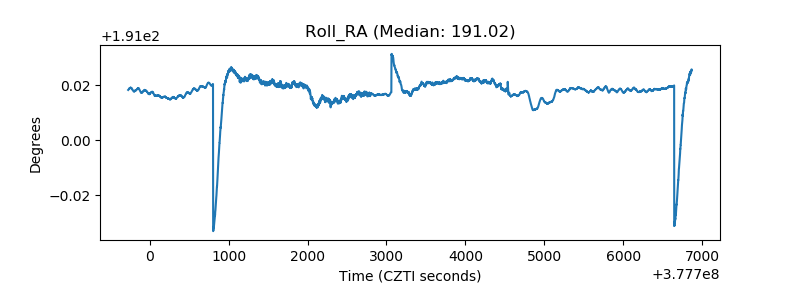 |
| Veto Counter | 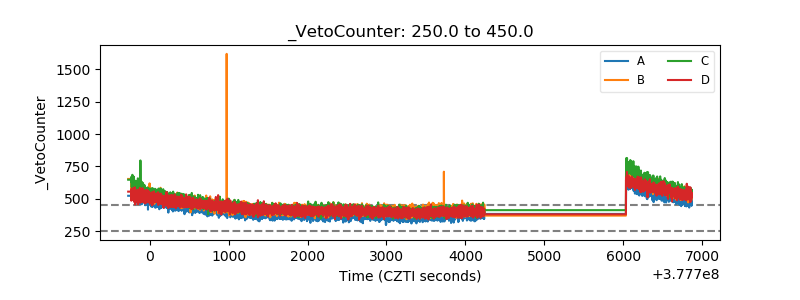 |