| Param | Original file | Final file |
|---|---|---|
| Filename | modeM0/AS1T04_090T01_9000004812_33683cztM0_level2.evt | modeM0/AS1T04_090T01_9000004812_33683cztM0_level2_quad_clean.evt |
| Size (bytes) | 520,269,120 | 54,766,080 |
| Size | 496.2 MB | 52.2 MB |
| Events in quadrant A | 3,618,925 | 316,436 |
| Events in quadrant B | 3,430,521 | 325,115 |
| Events in quadrant C | 3,580,316 | 333,912 |
| Events in quadrant D | 4,772,523 | 316,036 |
| Mode M9 | |||
|---|---|---|---|
| Quadrant | BADHDUFLAG | Total packets | Discarded packets |
| A | 0 | 26 | 0 |
| B | 0 | 26 | 0 |
| C | 0 | 26 | 0 |
| D | 0 | 27 | 0 |
| Mode M0 | |||
|---|---|---|---|
| Quadrant | BADHDUFLAG | Total packets | Discarded packets |
| A | 0 | 14129 | 3 |
| B | 0 | 13529 | 2 |
| C | 0 | 14702 | 2 |
| D | 0 | 17847 | 2 |
| Mode SS | |||
|---|---|---|---|
| Quadrant | BADHDUFLAG | Total packets | Discarded packets |
| A | 0 | 108 | 0 |
| B | 0 | 108 | 0 |
| C | 0 | 108 | 0 |
| D | 0 | 108 | 0 |
| Quadrant | Total seconds | Saturated seconds | Saturation percentage |
|---|---|---|---|
| A | 5226 | 262 | 5.013395% |
| B | 5226 | 181 | 3.463452% |
| C | 5226 | 98 | 1.875239% |
| D | 5226 | 376 | 7.194795% |
Noise dominated data is calculated using 1-second bins in cleaned event files. If a bin has >2000 counts, and if more than 50% of those come from <1% of pixels, then it is considered to be noise-dominated and hence unusable.
| Quadrant | # 1 sec bins | Bins with >0 counts | Bins with >2000 counts | High rate bins dominated by noise | Noise dominated (total time) | Noise dominated (detector-on time) | Marked lightcurve |
|---|---|---|---|---|---|---|---|
| A | 7259 | 5227 | 216 | 216 | 2.98% | 4.13% | 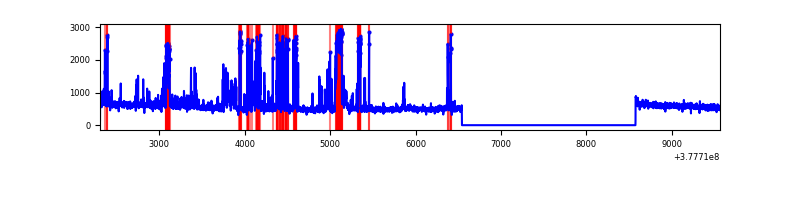 |
| B | 7259 | 5227 | 131 | 131 | 1.80% | 2.51% | 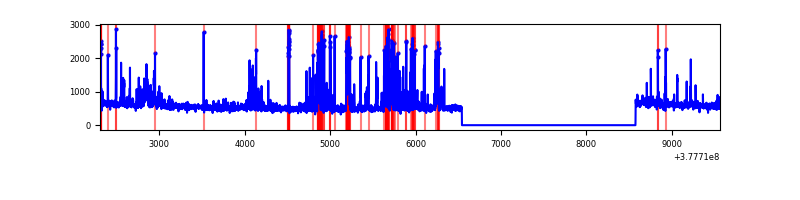 |
| C | 7259 | 5227 | 78 | 78 | 1.07% | 1.49% | 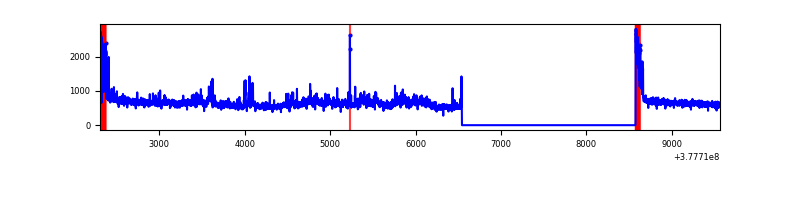 |
| D | 7259 | 5227 | 384 | 384 | 5.29% | 7.35% | 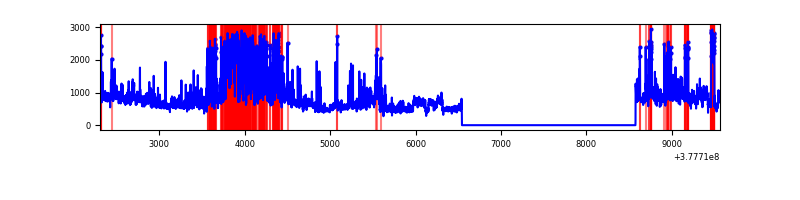 |
Top three noisy pixels from each quadrant. If the there are fewer than three noisy pixels in the level2.evt file, extra rows are filled as -1
| Pixel properties | Quadrant properties | ||||||
|---|---|---|---|---|---|---|---|
| Quadrant | DetID | PixID | Counts | Sigma | Mean | Median | Sigma |
| A | 15 | 237 | 582574 | 4365.52 | 684 | 673 | 133.3 |
| A | 15 | 169 | 369403 | 2766.27 | 684 | 673 | 133.3 |
| A | 13 | 6 | 18824 | 136.17 | 684 | 673 | 133.3 |
| B | 5 | 172 | 585994 | 4648.48 | 690 | 675 | 125.9 |
| B | 15 | 85 | 60436 | 474.61 | 690 | 675 | 125.9 |
| B | 0 | 219 | 22615 | 174.24 | 690 | 675 | 125.9 |
| C | 3 | 233 | 404106 | 2599.18 | 685 | 693 | 155.2 |
| C | 0 | 10 | 238664 | 1533.24 | 685 | 693 | 155.2 |
| C | 15 | 214 | 226355 | 1453.93 | 685 | 693 | 155.2 |
| D | 2 | 250 | 1000415 | 6095.59 | 673 | 654 | 164.0 |
| D | 8 | 195 | 665788 | 4055.36 | 673 | 654 | 164.0 |
| D | 13 | 249 | 200957 | 1221.26 | 673 | 654 | 164.0 |
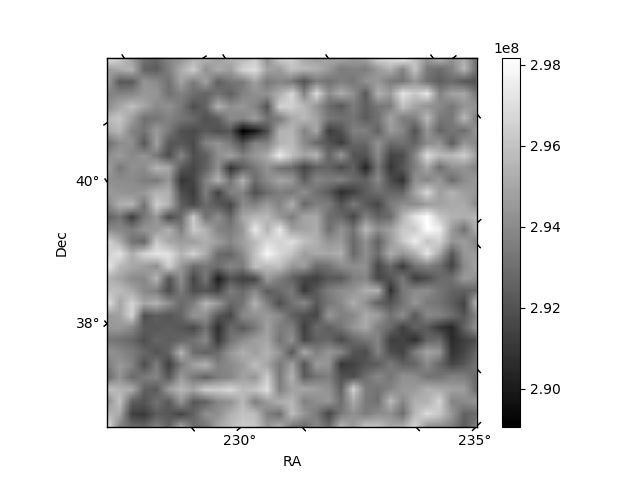
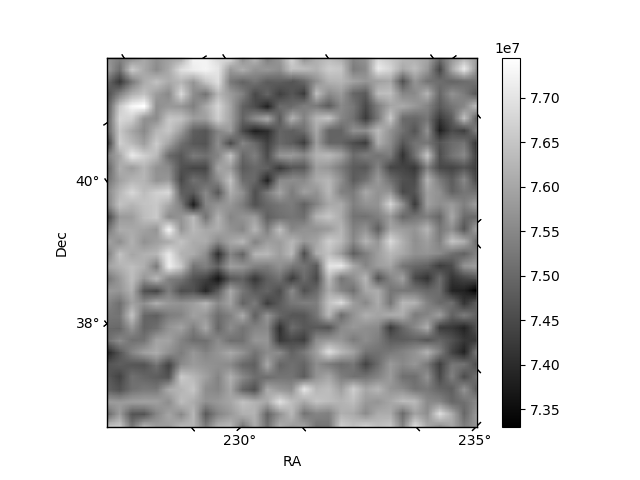
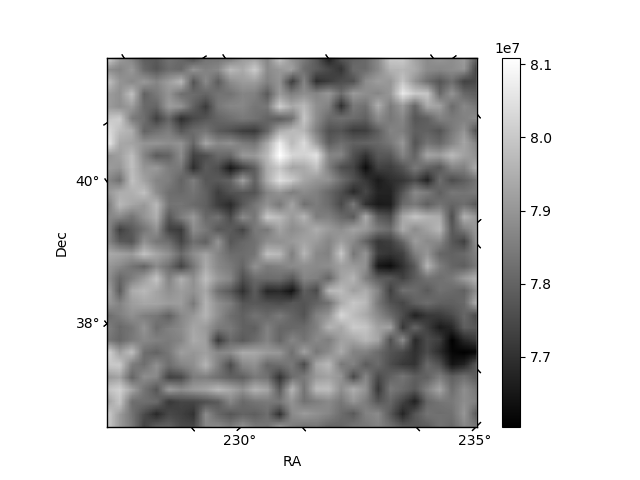
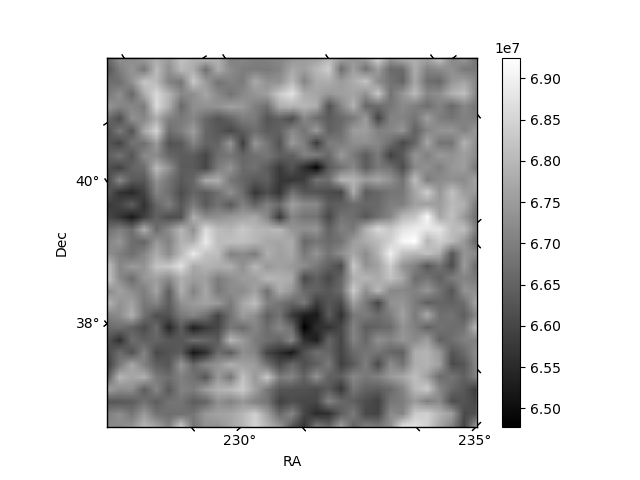
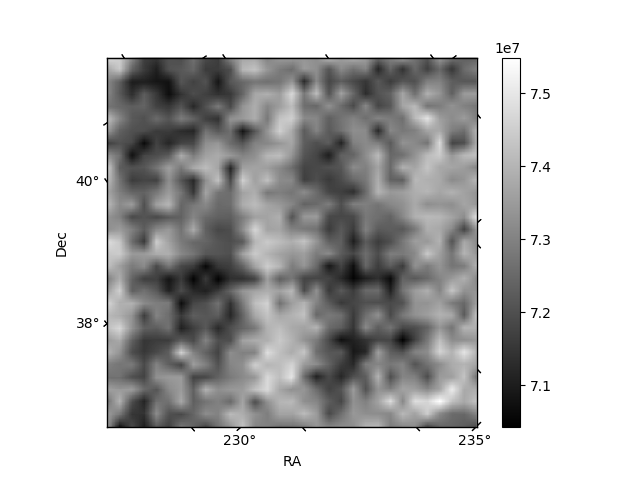
Histogram calculated using DETX and DETY for each event in the final _common_clean file
| Quadrant A | 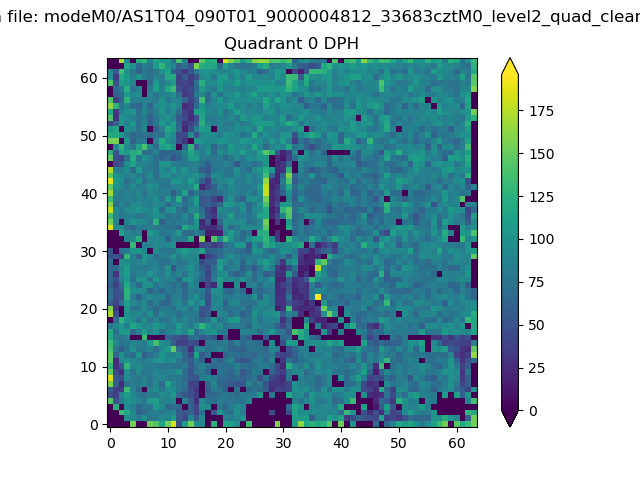 |
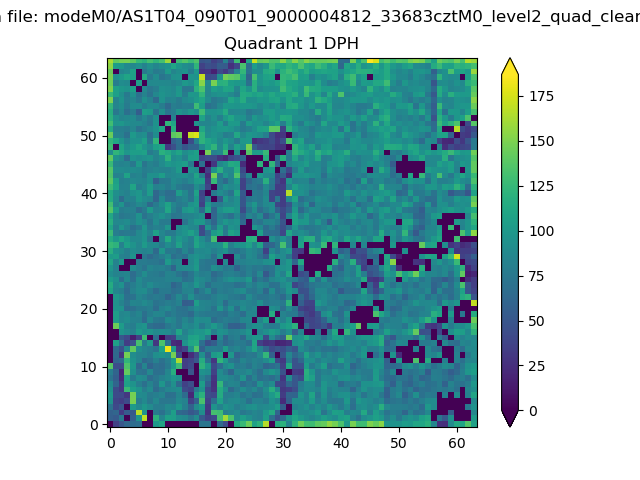 |
Quadrant B |
|---|---|---|---|
| Quadrant D |  |
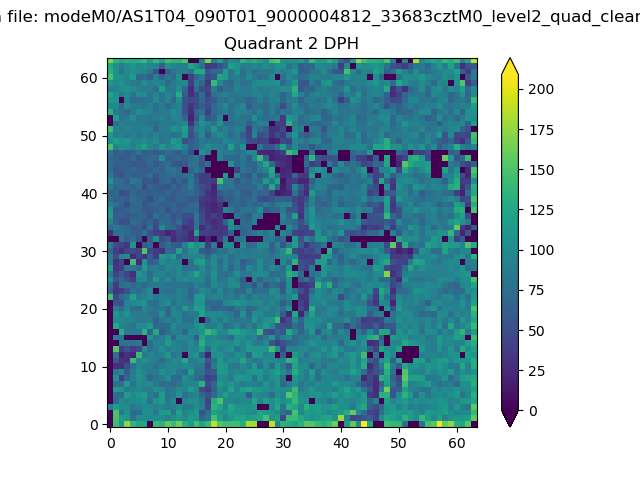 |
Quadrant C |
| Plot type | Count rate plots | Images |
|---|---|---|
| Comparison with Poisson distribution Blue bars denote a histogram of data divided into 1 sec bins. Red curve is a Poisson curve with rate = median count rate of data. |
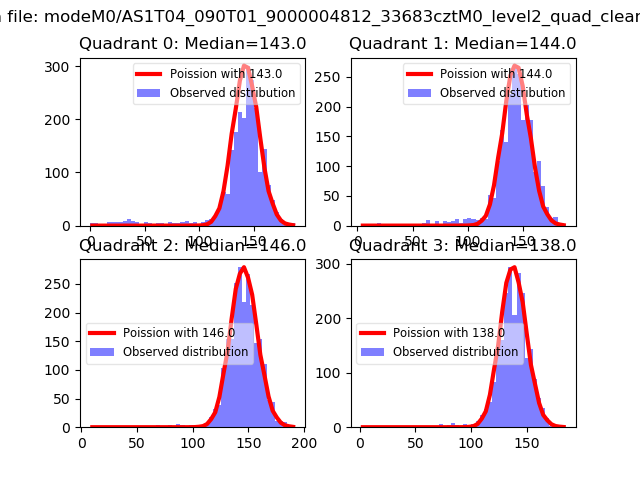 |
 |
| Quadrant-wise count rates Data is divided into 100 sec bins |
 |
|
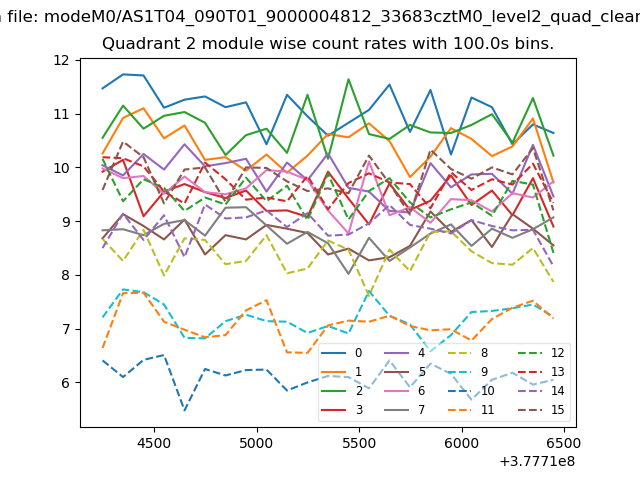
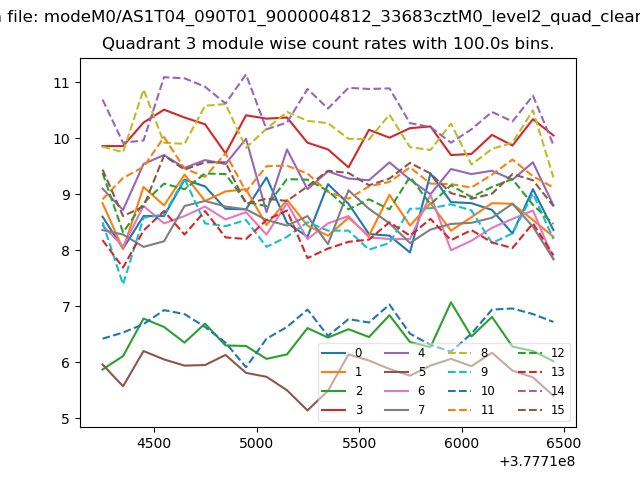
| Module-wise count rates for Quadrant A Data is divided into 100 sec bins |
 |
 |
| Module-wise count rates for Quadrant B Data is divided into 100 sec bins |
 |
 |
| Module-wise count rates for Quadrant C Data is divided into 100 sec bins |
 |
 |
| Module-wise count rates for Quadrant D Data is divided into 100 sec bins |
 |
 |
| Parameter | Plot |
|---|---|
| CZT HV Monitor |  |
| D_VDD | 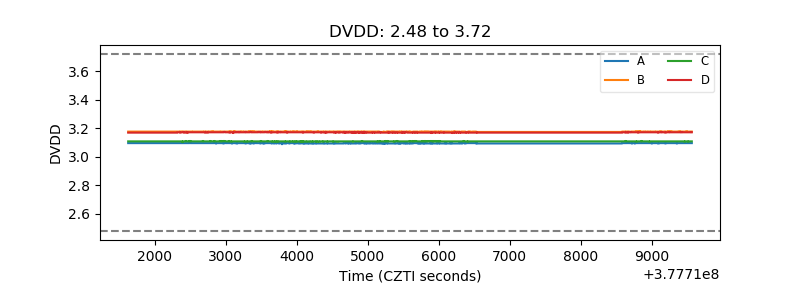 |
| Temperature 1 | 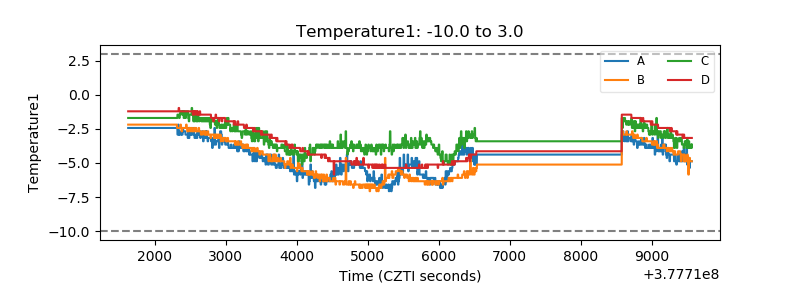 |
| Veto HV Monitor | 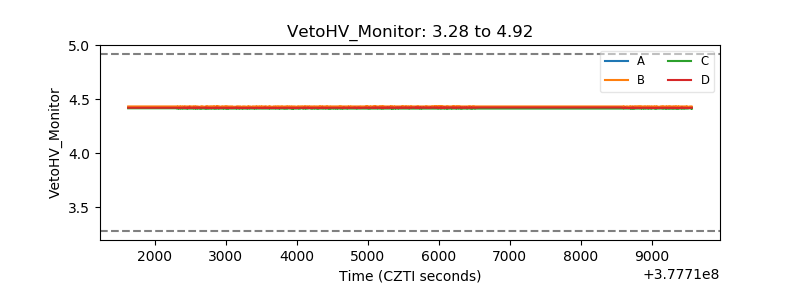 |
| Veto LLD | 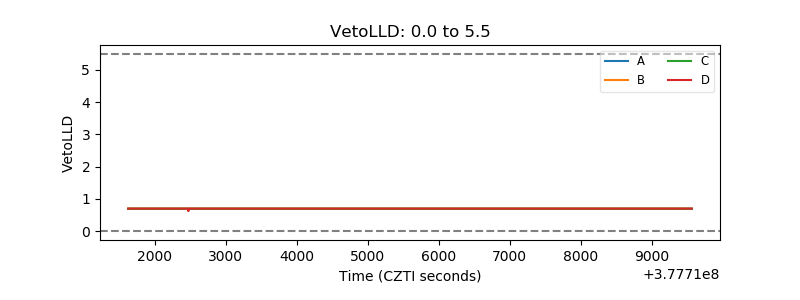 |
| Alpha Counter | 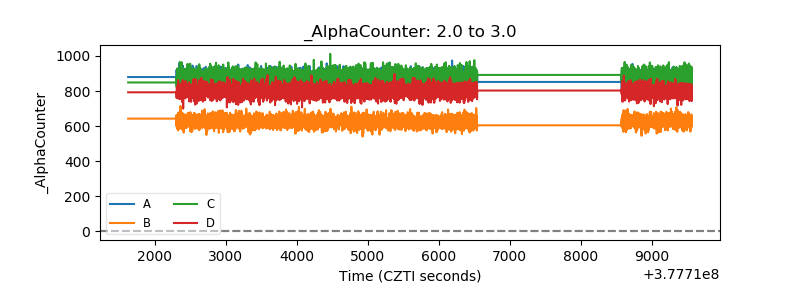 |
| _CPM_Rate | 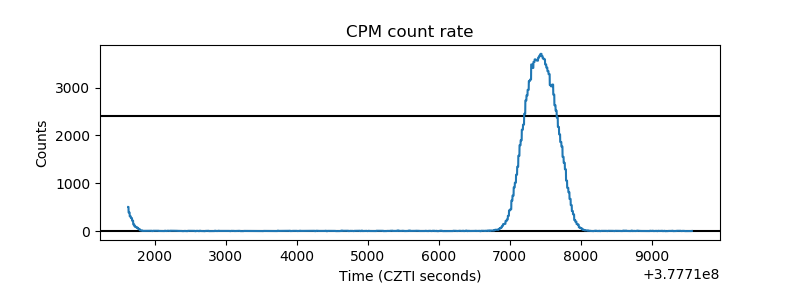 |
| CZT Counter | 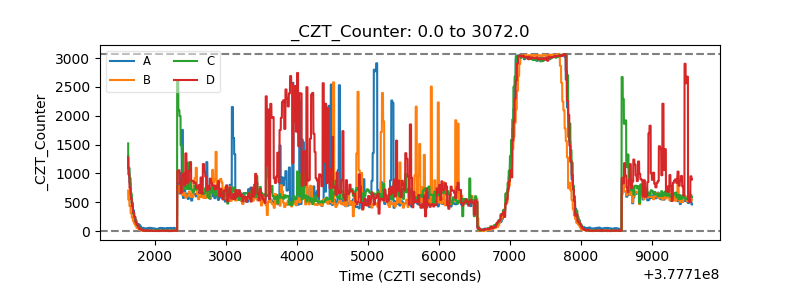 |
| +2.5 Volts monitor |  |
| +5 Volts monitor | 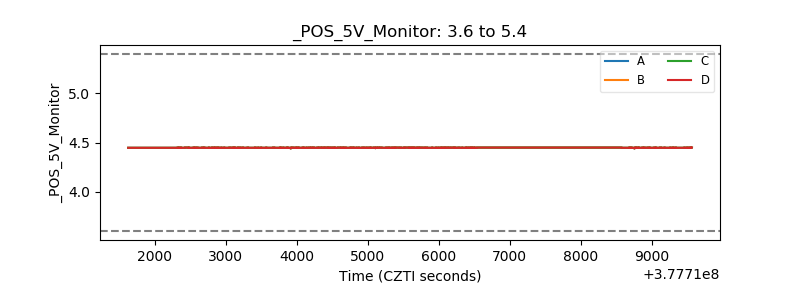 |
| _ROLL_ROT | 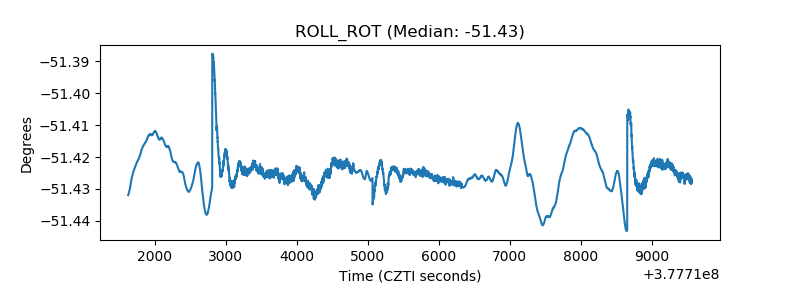 |
| _Roll_DEC | 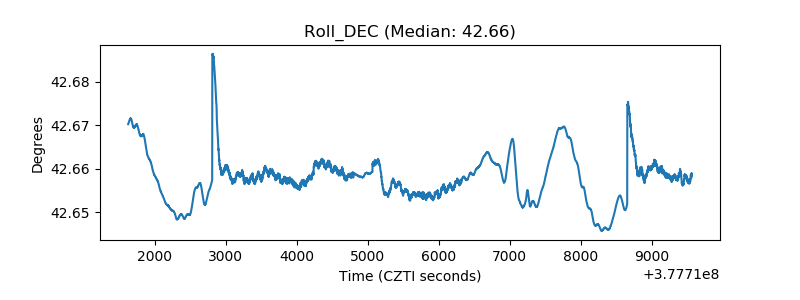 |
| _Roll_RA | 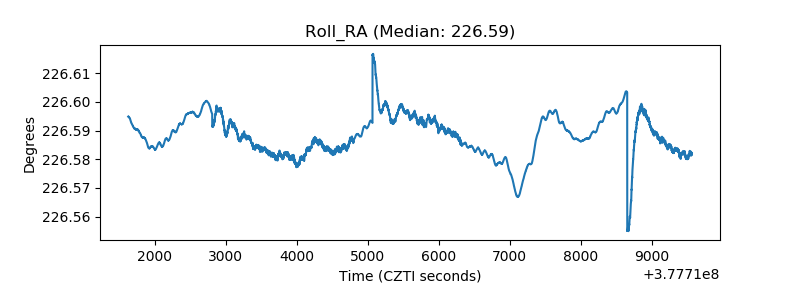 |
| Veto Counter | 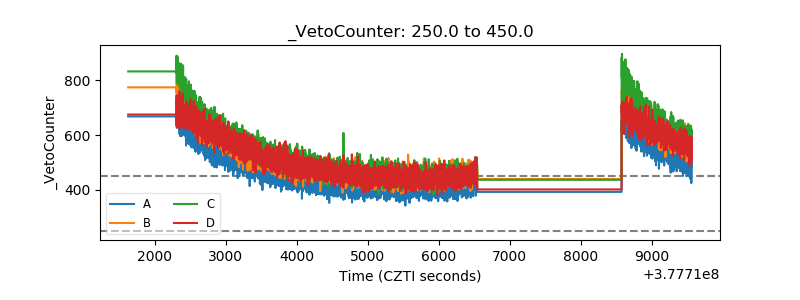 |