| Param | Original file | Final file |
|---|---|---|
| Filename | modeM0/AS1T04_090T01_9000004812_33684cztM0_level2.evt | modeM0/AS1T04_090T01_9000004812_33684cztM0_level2_quad_clean.evt |
| Size (bytes) | 498,409,920 | 61,191,360 |
| Size | 475.3 MB | 58.4 MB |
| Events in quadrant A | 3,496,037 | 365,939 |
| Events in quadrant B | 3,304,975 | 379,154 |
| Events in quadrant C | 3,357,017 | 392,063 |
| Events in quadrant D | 4,600,128 | 366,958 |
| Mode M9 | |||
|---|---|---|---|
| Quadrant | BADHDUFLAG | Total packets | Discarded packets |
| A | 0 | 23 | 0 |
| B | 0 | 23 | 0 |
| C | 0 | 23 | 0 |
| D | 0 | 24 | 0 |
| Mode M0 | |||
|---|---|---|---|
| Quadrant | BADHDUFLAG | Total packets | Discarded packets |
| A | 0 | 13542 | 3 |
| B | 0 | 12957 | 2 |
| C | 0 | 13203 | 2 |
| D | 0 | 17262 | 2 |
| Mode SS | |||
|---|---|---|---|
| Quadrant | BADHDUFLAG | Total packets | Discarded packets |
| A | 0 | 100 | 0 |
| B | 0 | 100 | 0 |
| C | 0 | 100 | 0 |
| D | 0 | 100 | 0 |
| Quadrant | Total seconds | Saturated seconds | Saturation percentage |
|---|---|---|---|
| A | 4971 | 259 | 5.210219% |
| B | 4971 | 188 | 3.781935% |
| C | 4971 | 165 | 3.319252% |
| D | 4971 | 253 | 5.089519% |
Noise dominated data is calculated using 1-second bins in cleaned event files. If a bin has >2000 counts, and if more than 50% of those come from <1% of pixels, then it is considered to be noise-dominated and hence unusable.
| Quadrant | # 1 sec bins | Bins with >0 counts | Bins with >2000 counts | High rate bins dominated by noise | Noise dominated (total time) | Noise dominated (detector-on time) | Marked lightcurve |
|---|---|---|---|---|---|---|---|
| A | 7093 | 4972 | 253 | 253 | 3.57% | 5.09% | 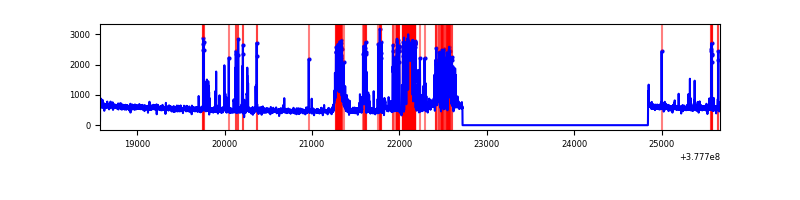 |
| B | 7093 | 4972 | 165 | 165 | 2.33% | 3.32% | 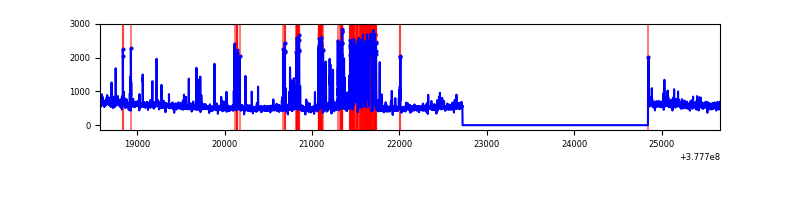 |
| C | 7093 | 4972 | 141 | 141 | 1.99% | 2.84% | 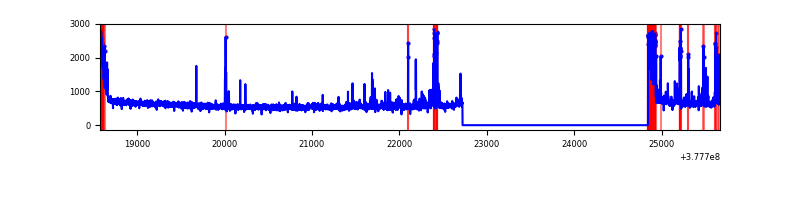 |
| D | 7093 | 4972 | 229 | 229 | 3.23% | 4.61% | 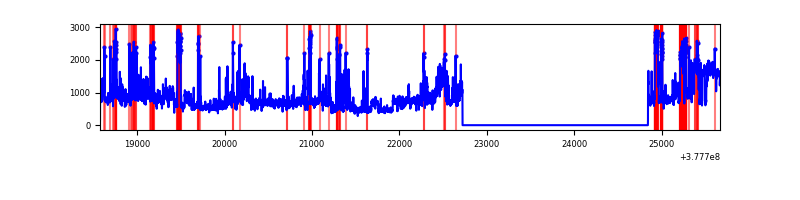 |
Top three noisy pixels from each quadrant. If the there are fewer than three noisy pixels in the level2.evt file, extra rows are filled as -1
| Pixel properties | Quadrant properties | ||||||
|---|---|---|---|---|---|---|---|
| Quadrant | DetID | PixID | Counts | Sigma | Mean | Median | Sigma |
| A | 15 | 237 | 990876 | 7910.5 | 642 | 633 | 125.2 |
| A | 13 | 6 | 10817 | 81.35 | 642 | 633 | 125.2 |
| A | 10 | 83 | 8892 | 65.98 | 642 | 633 | 125.2 |
| B | 5 | 172 | 610887 | 5104.59 | 649 | 636 | 119.5 |
| B | 0 | 213 | 62253 | 515.41 | 649 | 636 | 119.5 |
| B | 0 | 190 | 27392 | 223.81 | 649 | 636 | 119.5 |
| C | 3 | 233 | 387192 | 2652.77 | 640 | 646 | 145.7 |
| C | 0 | 10 | 222197 | 1520.45 | 640 | 646 | 145.7 |
| C | 15 | 214 | 211718 | 1448.54 | 640 | 646 | 145.7 |
| D | 8 | 195 | 745444 | 4831.3 | 634 | 618 | 154.2 |
| D | 15 | 0 | 472711 | 3062.22 | 634 | 618 | 154.2 |
| D | 13 | 249 | 262141 | 1696.36 | 634 | 618 | 154.2 |
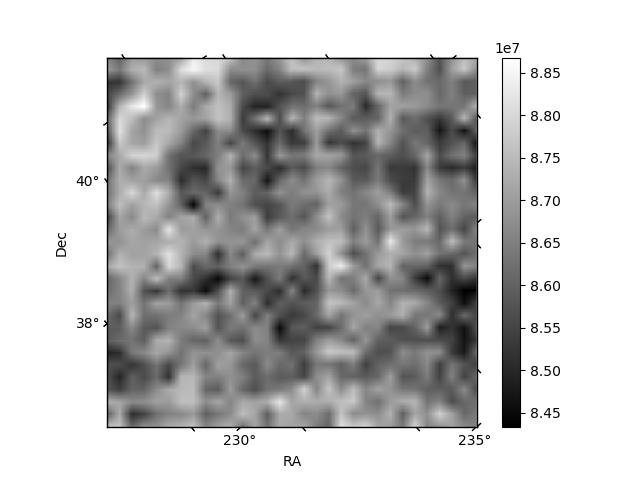
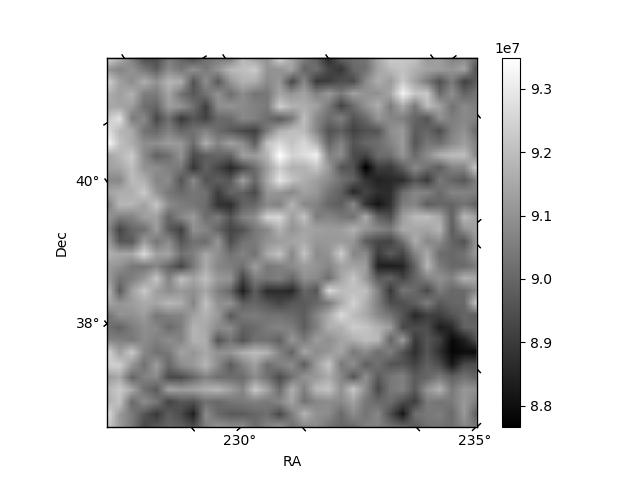
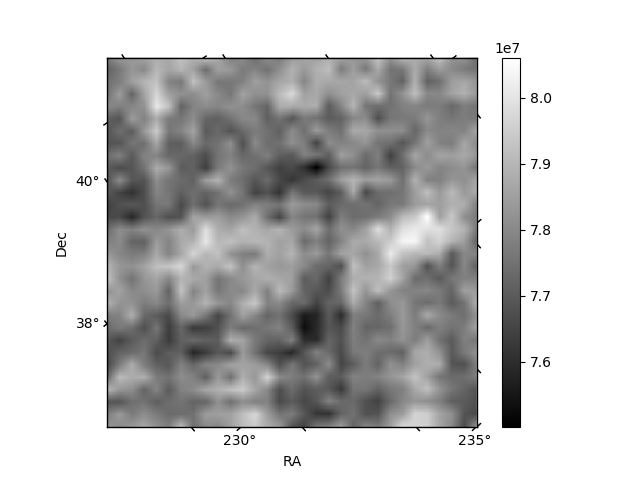
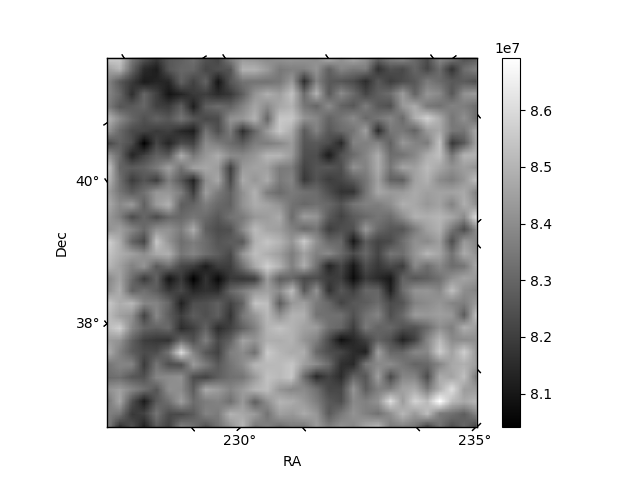
Histogram calculated using DETX and DETY for each event in the final _common_clean file
| Quadrant A | 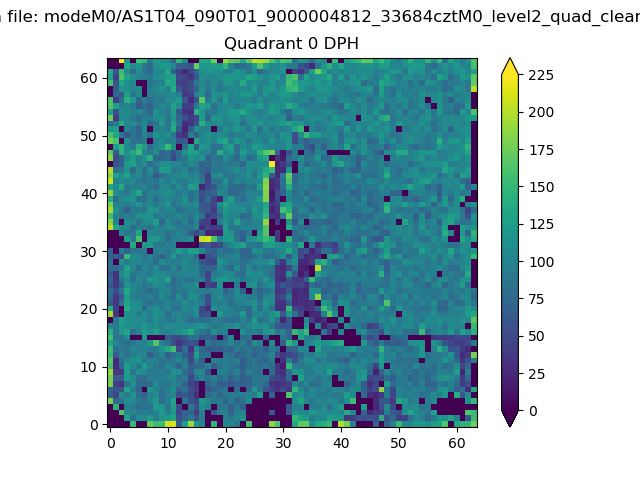 |
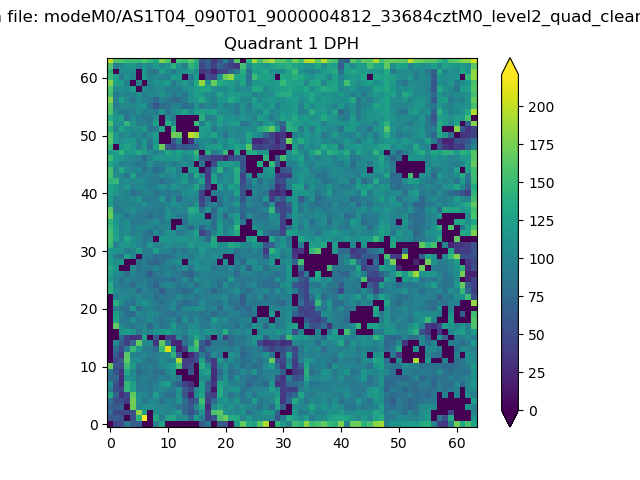 |
Quadrant B |
|---|---|---|---|
| Quadrant D | 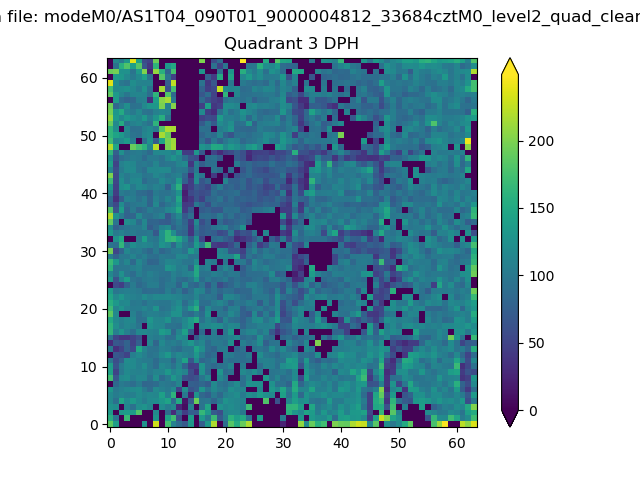 |
 |
Quadrant C |
| Plot type | Count rate plots | Images |
|---|---|---|
| Comparison with Poisson distribution Blue bars denote a histogram of data divided into 1 sec bins. Red curve is a Poisson curve with rate = median count rate of data. |
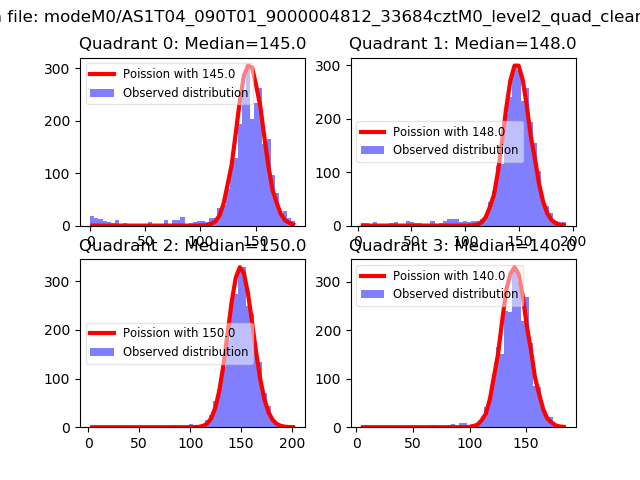 |
 |
| Quadrant-wise count rates Data is divided into 100 sec bins |
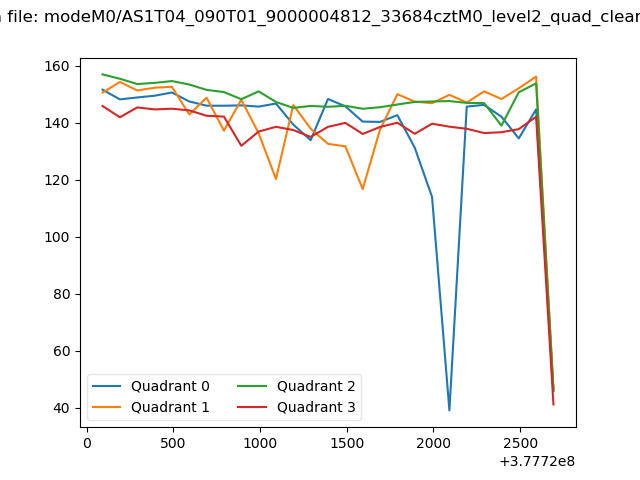 |
|
| Module-wise count rates for Quadrant A Data is divided into 100 sec bins |
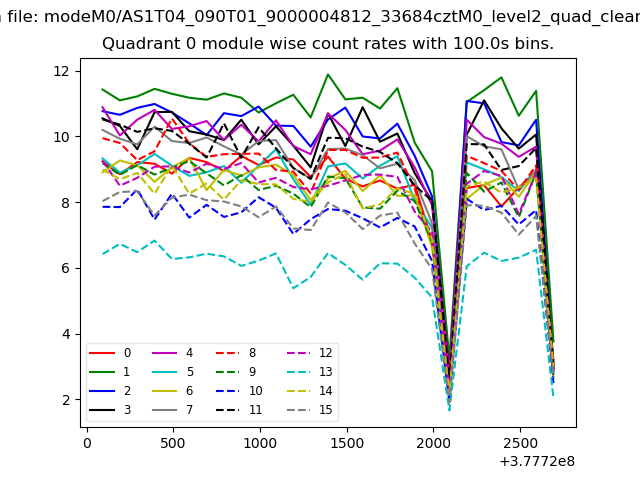 |
 |
| Module-wise count rates for Quadrant B Data is divided into 100 sec bins |
 |
 |
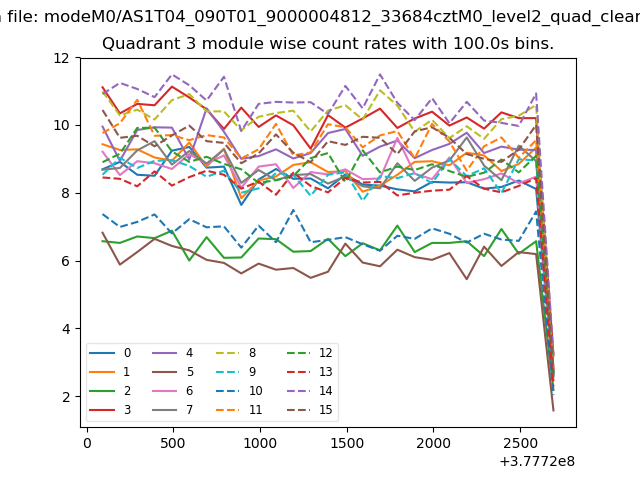
| Module-wise count rates for Quadrant C Data is divided into 100 sec bins |
 |
 |
| Module-wise count rates for Quadrant D Data is divided into 100 sec bins |
 |
 |
| Parameter | Plot |
|---|---|
| CZT HV Monitor | 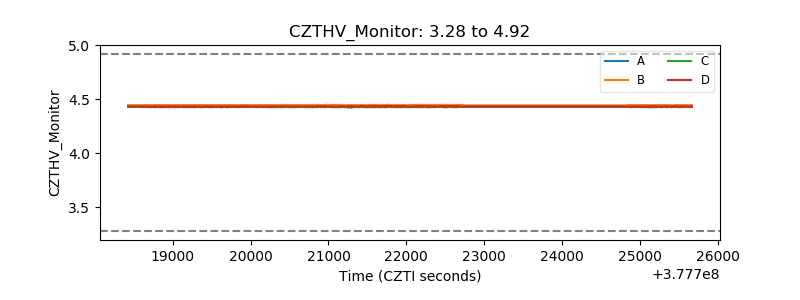 |
| D_VDD | 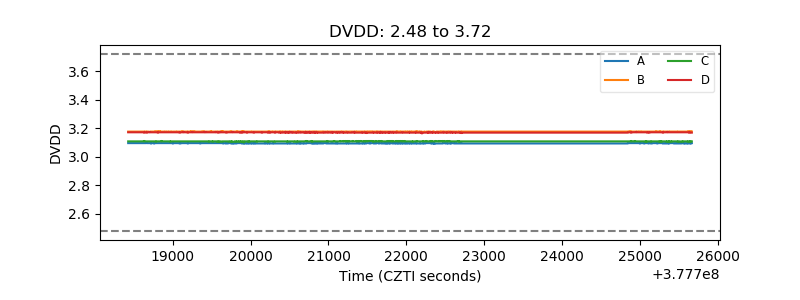 |
| Temperature 1 | 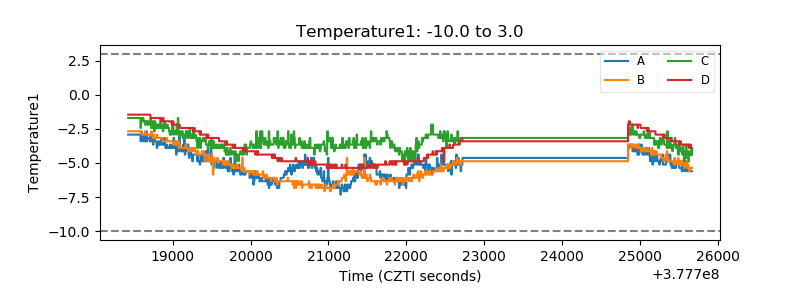 |
| Veto HV Monitor | 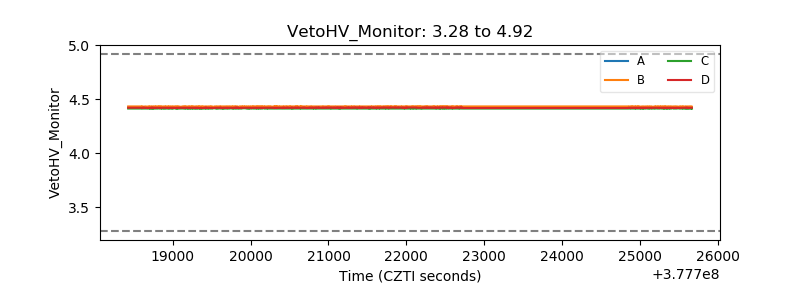 |
| Veto LLD | 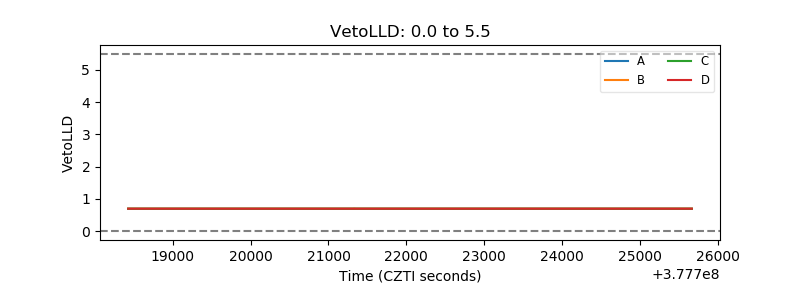 |
| Alpha Counter |  |
| _CPM_Rate | 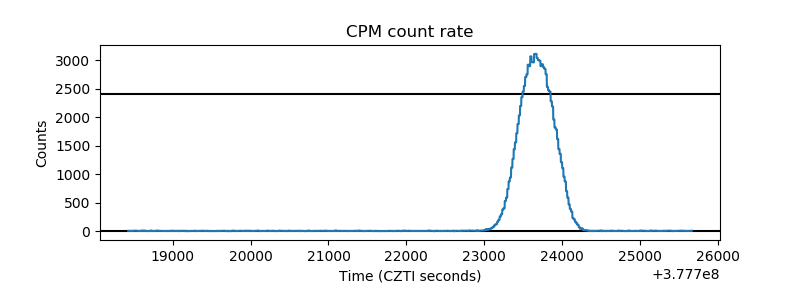 |
| CZT Counter | 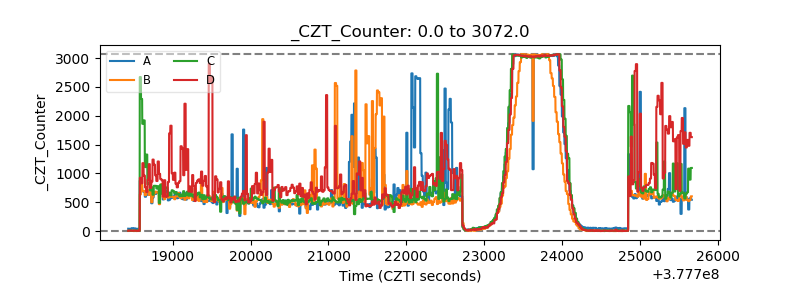 |
| +2.5 Volts monitor |  |
| +5 Volts monitor |  |
| _ROLL_ROT | 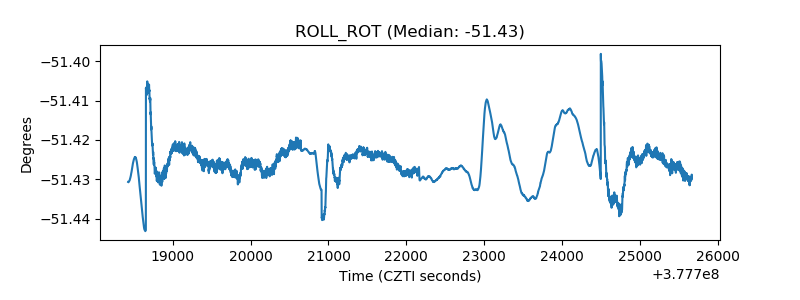 |
| _Roll_DEC | 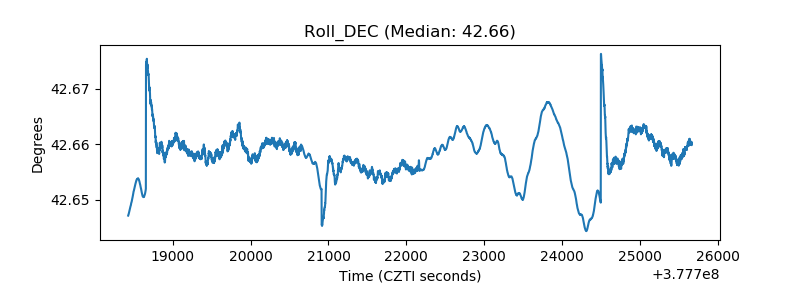 |
| _Roll_RA | 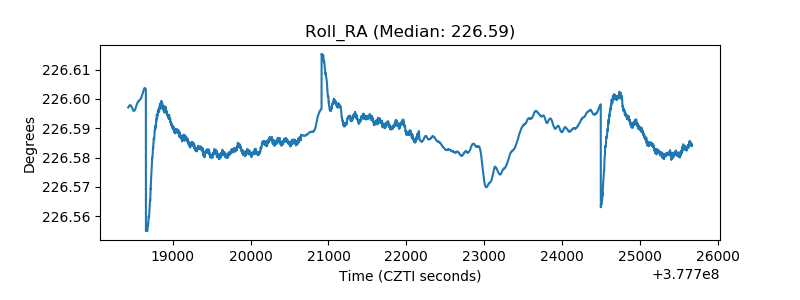 |
| Veto Counter | 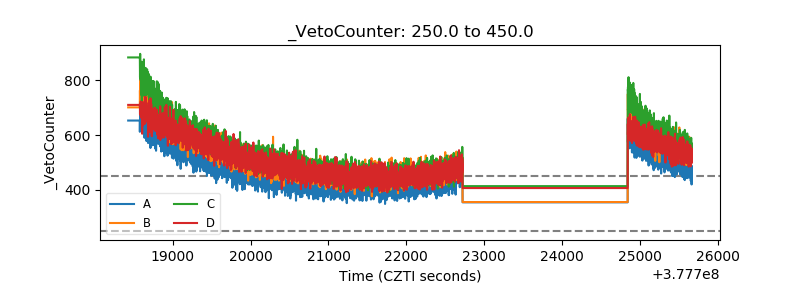 |