| Param | Original file | Final file |
|---|---|---|
| Filename | modeM0/AS1T04_090T01_9000004812_33685cztM0_level2.evt | modeM0/AS1T04_090T01_9000004812_33685cztM0_level2_quad_clean.evt |
| Size (bytes) | 461,911,680 | 70,335,360 |
| Size | 440.5 MB | 67.1 MB |
| Events in quadrant A | 2,641,733 | 458,107 |
| Events in quadrant B | 3,108,992 | 456,054 |
| Events in quadrant C | 3,088,330 | 465,937 |
| Events in quadrant D | 4,820,709 | 408,865 |
| Mode M9 | |||
|---|---|---|---|
| Quadrant | BADHDUFLAG | Total packets | Discarded packets |
| A | 0 | 21 | 0 |
| B | 0 | 21 | 0 |
| C | 0 | 21 | 0 |
| D | 0 | 21 | 0 |
| Mode M0 | |||
|---|---|---|---|
| Quadrant | BADHDUFLAG | Total packets | Discarded packets |
| A | 0 | 10785 | 2 |
| B | 0 | 12274 | 1 |
| C | 0 | 12295 | 1 |
| D | 0 | 17735 | 1 |
| Mode SS | |||
|---|---|---|---|
| Quadrant | BADHDUFLAG | Total packets | Discarded packets |
| A | 0 | 98 | 0 |
| B | 0 | 98 | 0 |
| C | 0 | 98 | 0 |
| D | 0 | 98 | 0 |
| Quadrant | Total seconds | Saturated seconds | Saturation percentage |
|---|---|---|---|
| A | 4857 | 65 | 1.338275% |
| B | 4857 | 176 | 3.623636% |
| C | 4857 | 74 | 1.523574% |
| D | 4857 | 649 | 13.362158% |
Noise dominated data is calculated using 1-second bins in cleaned event files. If a bin has >2000 counts, and if more than 50% of those come from <1% of pixels, then it is considered to be noise-dominated and hence unusable.
| Quadrant | # 1 sec bins | Bins with >0 counts | Bins with >2000 counts | High rate bins dominated by noise | Noise dominated (total time) | Noise dominated (detector-on time) | Marked lightcurve |
|---|---|---|---|---|---|---|---|
| A | 6979 | 4858 | 54 | 54 | 0.77% | 1.11% | 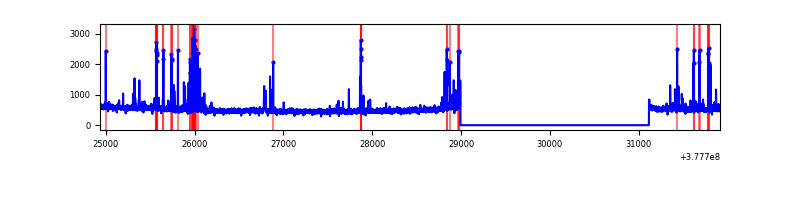 |
| B | 6979 | 4858 | 163 | 163 | 2.34% | 3.36% | 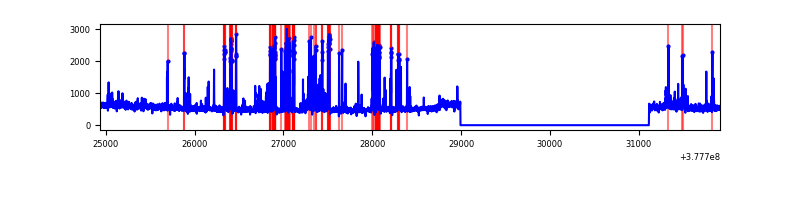 |
| C | 6979 | 4858 | 53 | 53 | 0.76% | 1.09% | 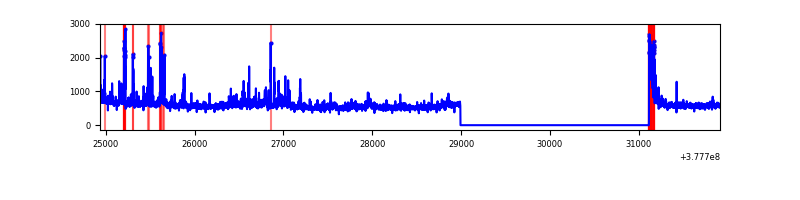 |
| D | 6979 | 4858 | 651 | 651 | 9.33% | 13.40% | 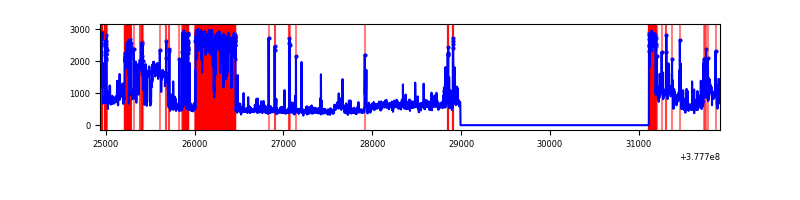 |
Top three noisy pixels from each quadrant. If the there are fewer than three noisy pixels in the level2.evt file, extra rows are filled as -1
| Pixel properties | Quadrant properties | ||||||
|---|---|---|---|---|---|---|---|
| Quadrant | DetID | PixID | Counts | Sigma | Mean | Median | Sigma |
| A | 15 | 237 | 260252 | 2134.57 | 610 | 599 | 121.6 |
| A | 13 | 6 | 13583 | 106.74 | 610 | 599 | 121.6 |
| A | 7 | 16 | 8265 | 63.02 | 610 | 599 | 121.6 |
| B | 5 | 172 | 600041 | 5308.03 | 605 | 590 | 112.9 |
| B | 0 | 219 | 27543 | 238.66 | 605 | 590 | 112.9 |
| B | 15 | 85 | 23785 | 205.39 | 605 | 590 | 112.9 |
| C | 3 | 233 | 373279 | 2720.35 | 601 | 609 | 137.0 |
| C | 15 | 214 | 208103 | 1514.63 | 601 | 609 | 137.0 |
| C | 0 | 10 | 136973 | 995.4 | 601 | 609 | 137.0 |
| D | 8 | 230 | 1369215 | 10045.37 | 560 | 545 | 136.2 |
| D | 15 | 0 | 498059 | 3651.51 | 560 | 545 | 136.2 |
| D | 8 | 195 | 479257 | 3513.51 | 560 | 545 | 136.2 |
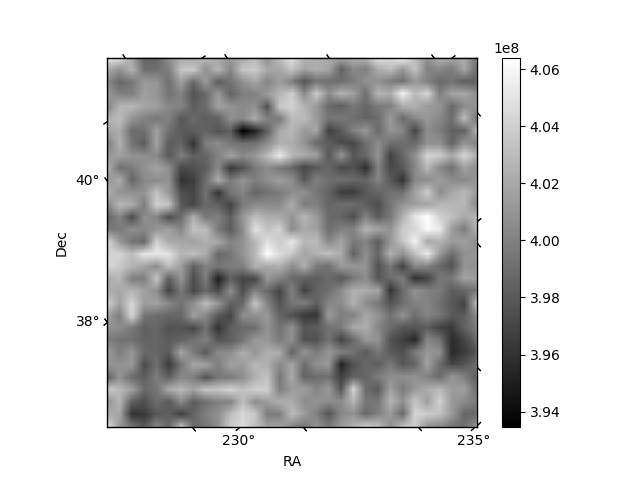
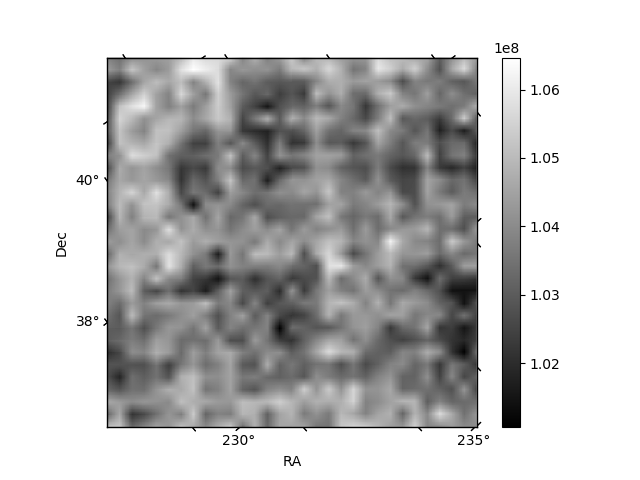
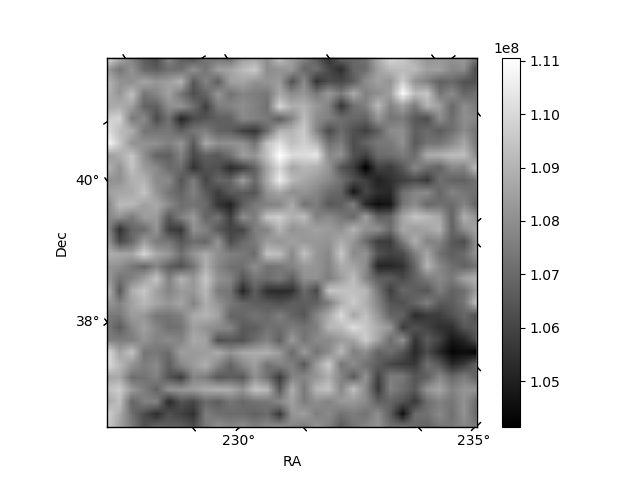
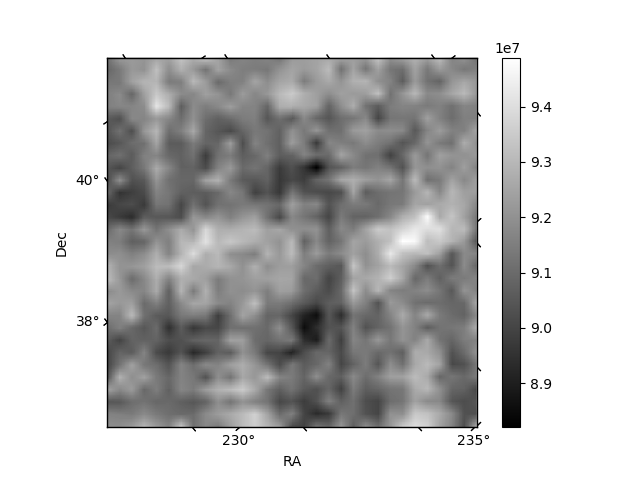
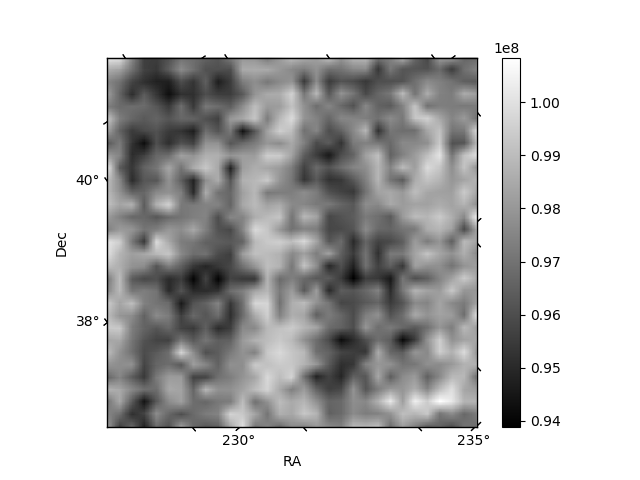
Histogram calculated using DETX and DETY for each event in the final _common_clean file
| Quadrant A | 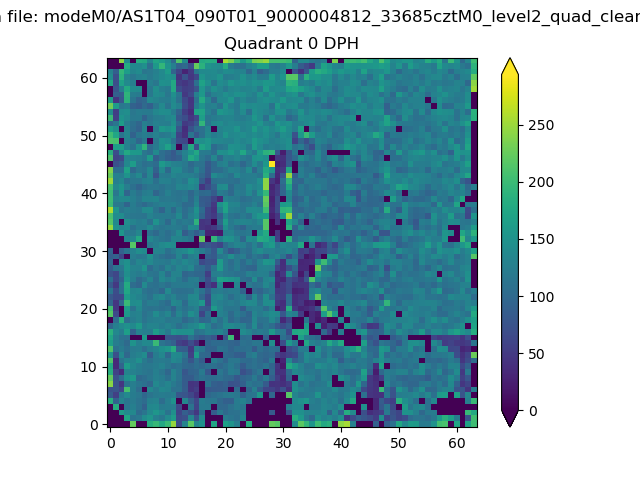 |
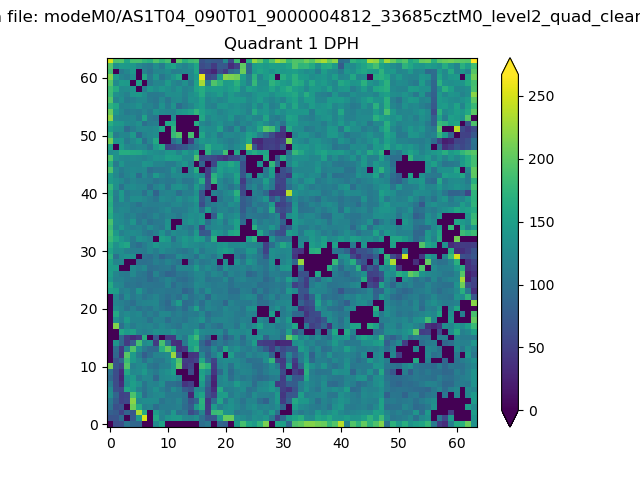 |
Quadrant B |
|---|---|---|---|
| Quadrant D | 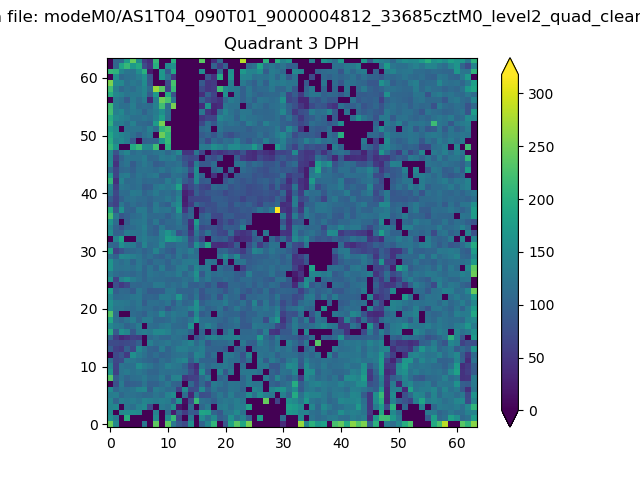 |
 |
Quadrant C |
| Plot type | Count rate plots | Images |
|---|---|---|
| Comparison with Poisson distribution Blue bars denote a histogram of data divided into 1 sec bins. Red curve is a Poisson curve with rate = median count rate of data. |
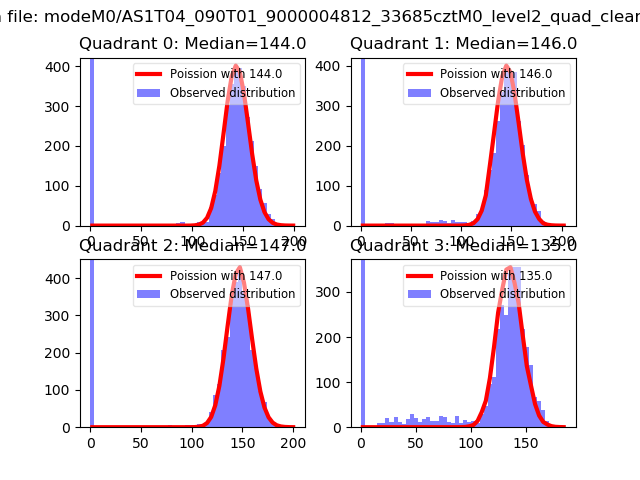 |
 |
| Quadrant-wise count rates Data is divided into 100 sec bins |
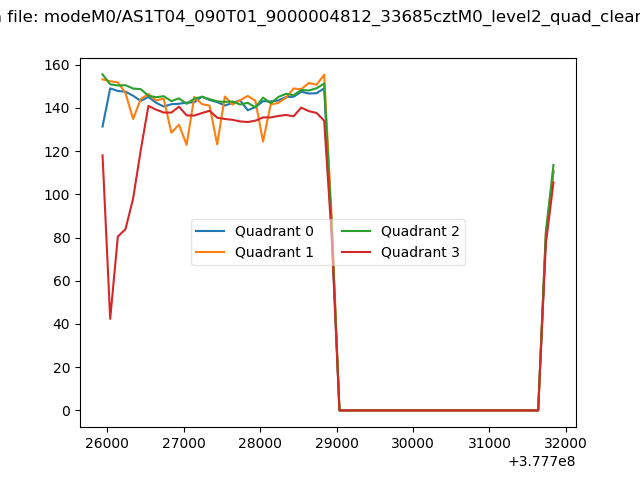 |
|
| Module-wise count rates for Quadrant A Data is divided into 100 sec bins |
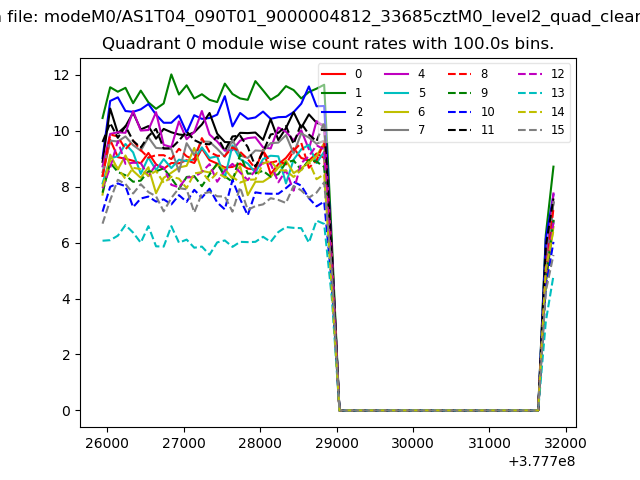 |
 |
| Module-wise count rates for Quadrant B Data is divided into 100 sec bins |
 |
 |
| Module-wise count rates for Quadrant C Data is divided into 100 sec bins |
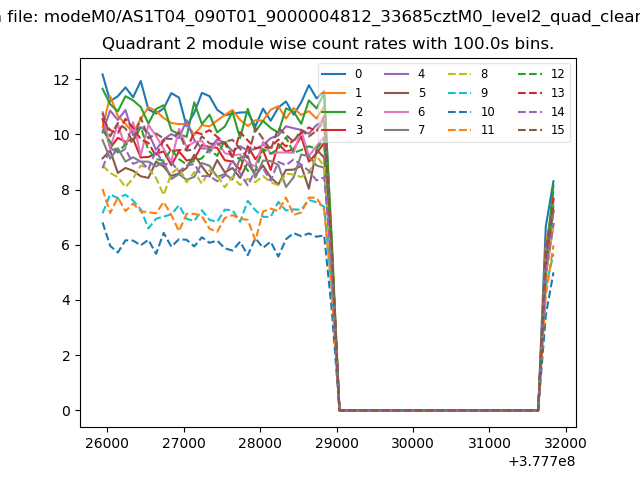 |
 |
| Module-wise count rates for Quadrant D Data is divided into 100 sec bins |
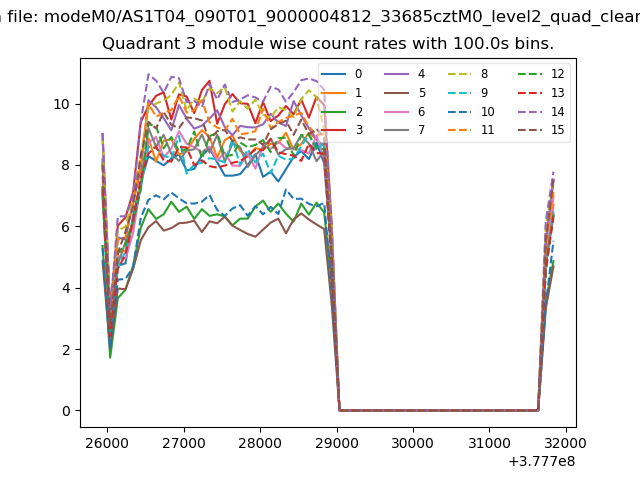 |
 |
| Parameter | Plot |
|---|---|
| CZT HV Monitor | 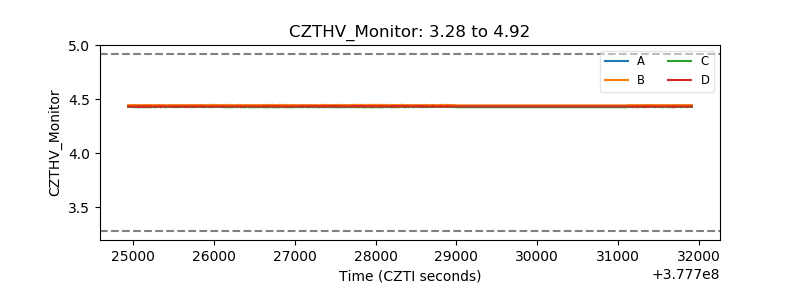 |
| D_VDD | 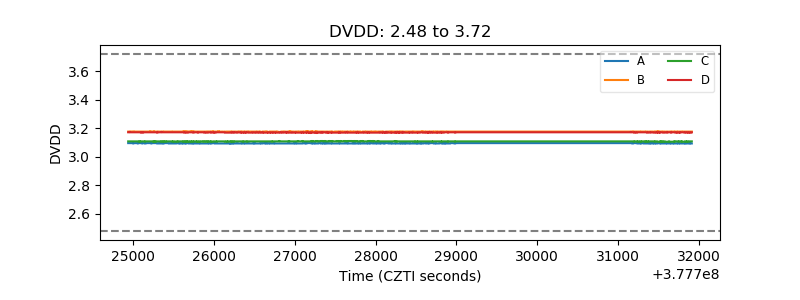 |
| Temperature 1 | 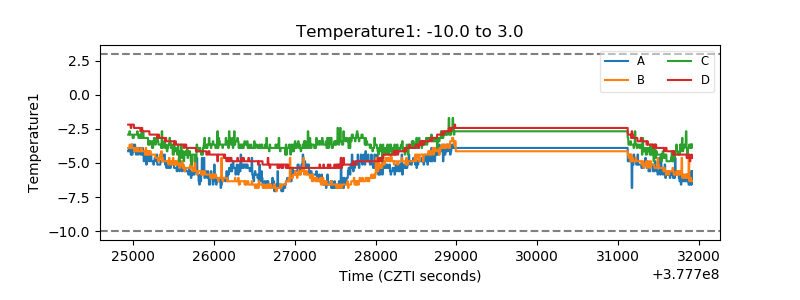 |
| Veto HV Monitor | 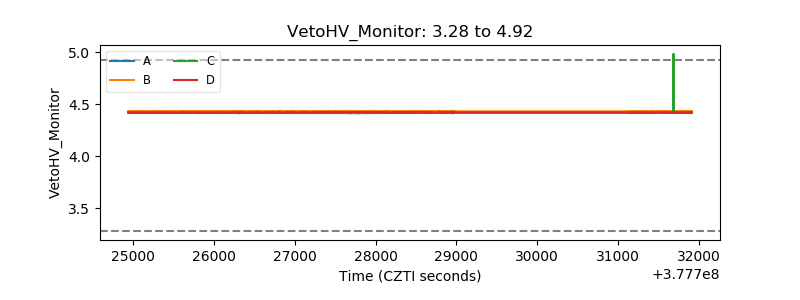 |
| Veto LLD | 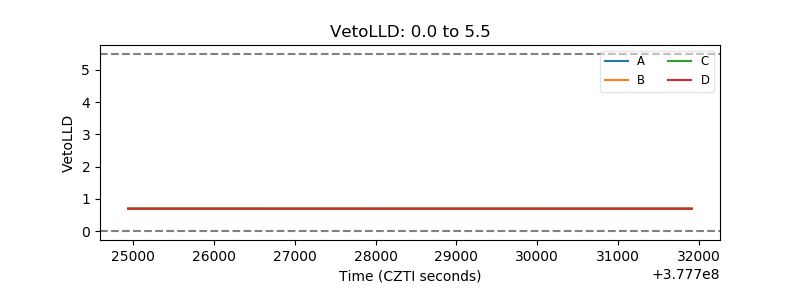 |
| Alpha Counter | 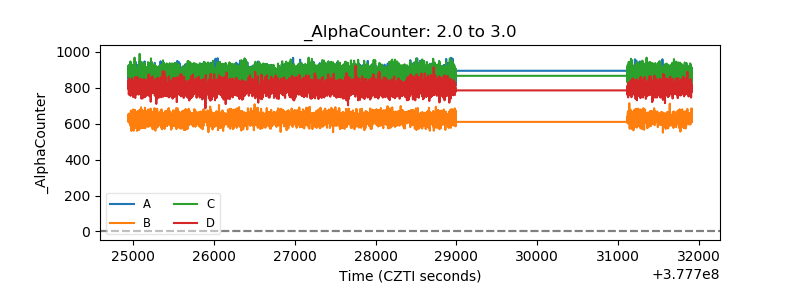 |
| _CPM_Rate | 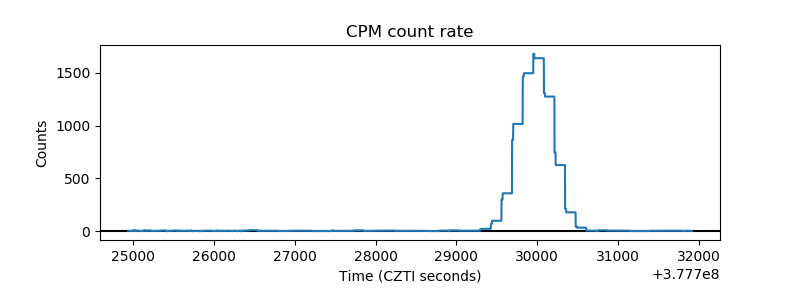 |
| CZT Counter | 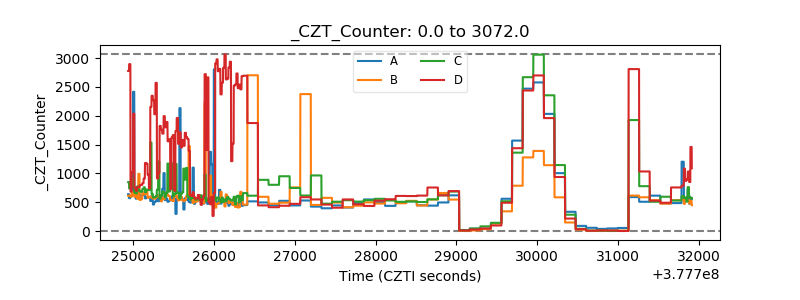 |
| +2.5 Volts monitor |  |
| +5 Volts monitor |  |
| _ROLL_ROT | 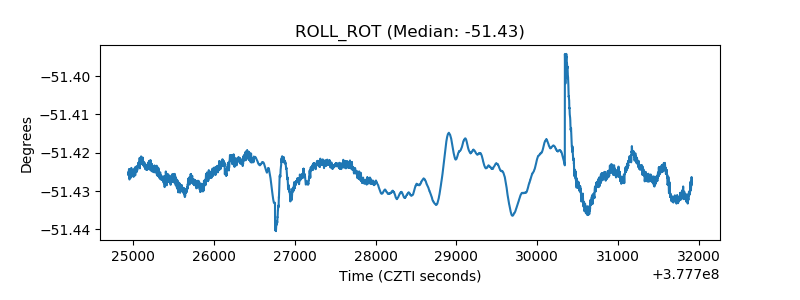 |
| _Roll_DEC | 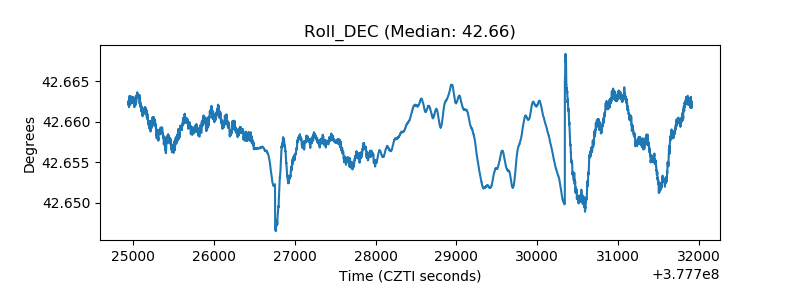 |
| _Roll_RA | 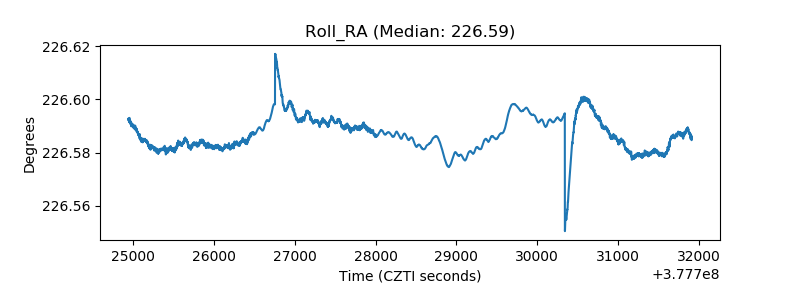 |
| Veto Counter | 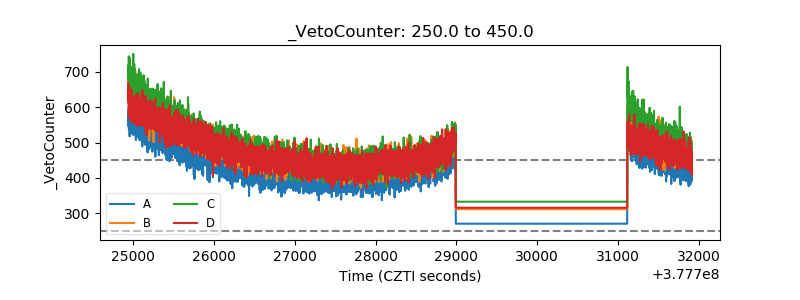 |