| Param | Original file | Final file |
|---|---|---|
| Filename | modeM0/AS1T04_090T01_9000004812_33686cztM0_level2.evt | modeM0/AS1T04_090T01_9000004812_33686cztM0_level2_quad_clean.evt |
| Size (bytes) | 472,328,640 | 85,095,360 |
| Size | 450.4 MB | 81.2 MB |
| Events in quadrant A | 3,091,430 | 557,577 |
| Events in quadrant B | 3,867,952 | 549,231 |
| Events in quadrant C | 2,983,758 | 573,519 |
| Events in quadrant D | 4,017,769 | 541,119 |
| Mode M9 | |||
|---|---|---|---|
| Quadrant | BADHDUFLAG | Total packets | Discarded packets |
| A | 0 | 26 | 0 |
| B | 0 | 26 | 0 |
| C | 0 | 26 | 0 |
| D | 0 | 27 | 0 |
| Mode M0 | |||
|---|---|---|---|
| Quadrant | BADHDUFLAG | Total packets | Discarded packets |
| A | 0 | 12402 | 3 |
| B | 0 | 14647 | 2 |
| C | 0 | 11824 | 2 |
| D | 0 | 15331 | 2 |
| Mode SS | |||
|---|---|---|---|
| Quadrant | BADHDUFLAG | Total packets | Discarded packets |
| A | 0 | 104 | 0 |
| B | 0 | 104 | 0 |
| C | 0 | 104 | 0 |
| D | 0 | 104 | 0 |
| Quadrant | Total seconds | Saturated seconds | Saturation percentage |
|---|---|---|---|
| A | 5067 | 182 | 3.591869% |
| B | 5067 | 410 | 8.091573% |
| C | 5067 | 100 | 1.973554% |
| D | 5067 | 124 | 2.447207% |
Noise dominated data is calculated using 1-second bins in cleaned event files. If a bin has >2000 counts, and if more than 50% of those come from <1% of pixels, then it is considered to be noise-dominated and hence unusable.
| Quadrant | # 1 sec bins | Bins with >0 counts | Bins with >2000 counts | High rate bins dominated by noise | Noise dominated (total time) | Noise dominated (detector-on time) | Marked lightcurve |
|---|---|---|---|---|---|---|---|
| A | 7099 | 5068 | 162 | 162 | 2.28% | 3.20% | 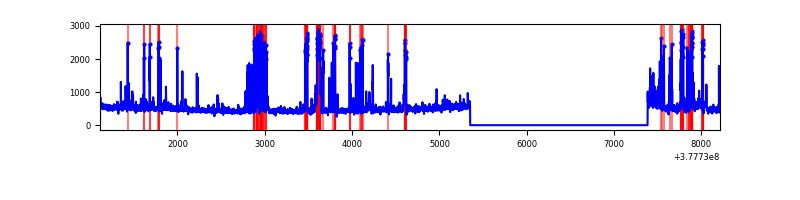 |
| B | 7098 | 5067 | 358 | 358 | 5.04% | 7.07% | 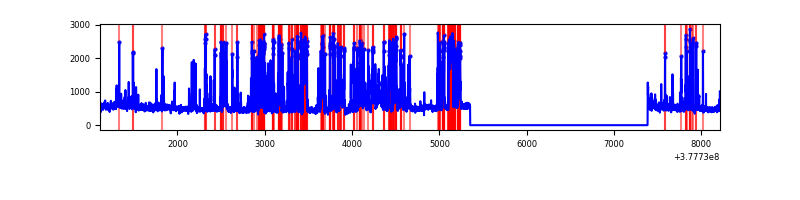 |
| C | 7099 | 5068 | 79 | 79 | 1.11% | 1.56% | 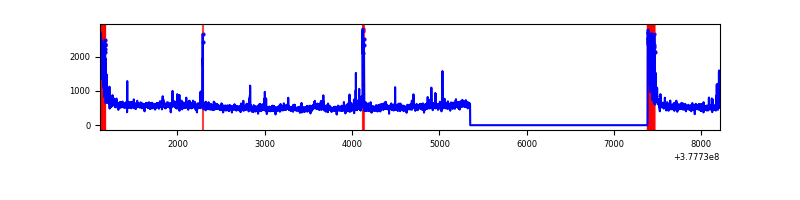 |
| D | 7099 | 5068 | 120 | 120 | 1.69% | 2.37% | 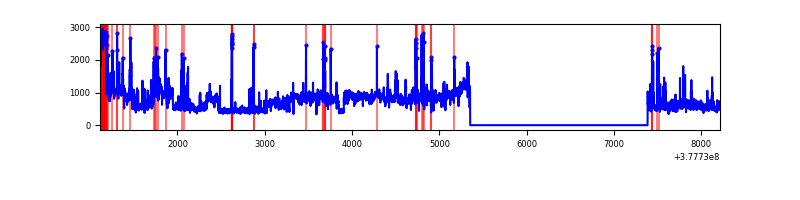 |
Top three noisy pixels from each quadrant. If the there are fewer than three noisy pixels in the level2.evt file, extra rows are filled as -1
| Pixel properties | Quadrant properties | ||||||
|---|---|---|---|---|---|---|---|
| Quadrant | DetID | PixID | Counts | Sigma | Mean | Median | Sigma |
| A | 15 | 237 | 643072 | 5428.28 | 598 | 587 | 118.4 |
| A | 15 | 169 | 105905 | 889.82 | 598 | 587 | 118.4 |
| A | 13 | 6 | 15898 | 129.36 | 598 | 587 | 118.4 |
| B | 5 | 172 | 1471303 | 13101.99 | 589 | 575 | 112.3 |
| B | 0 | 190 | 15086 | 129.27 | 589 | 575 | 112.3 |
| B | 4 | 81 | 14868 | 127.33 | 589 | 575 | 112.3 |
| C | 0 | 10 | 240765 | 1780.97 | 592 | 598 | 134.9 |
| C | 15 | 214 | 218919 | 1618.97 | 592 | 598 | 134.9 |
| C | 3 | 233 | 123416 | 910.76 | 592 | 598 | 134.9 |
| D | 8 | 195 | 1238637 | 7954.3 | 578 | 567 | 155.6 |
| D | 8 | 230 | 189589 | 1214.42 | 578 | 567 | 155.6 |
| D | 13 | 249 | 82711 | 527.76 | 578 | 567 | 155.6 |
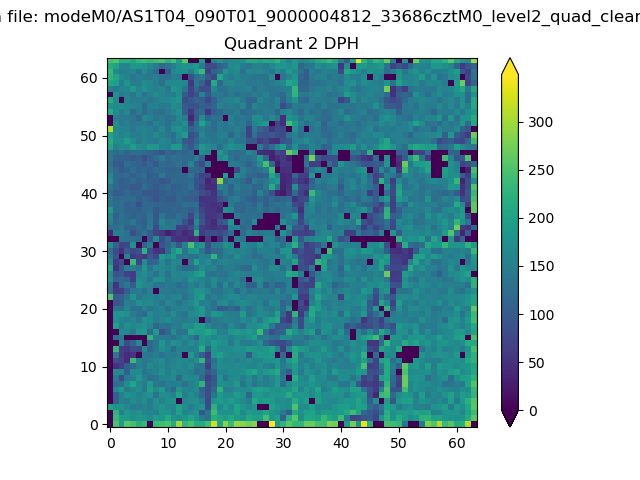
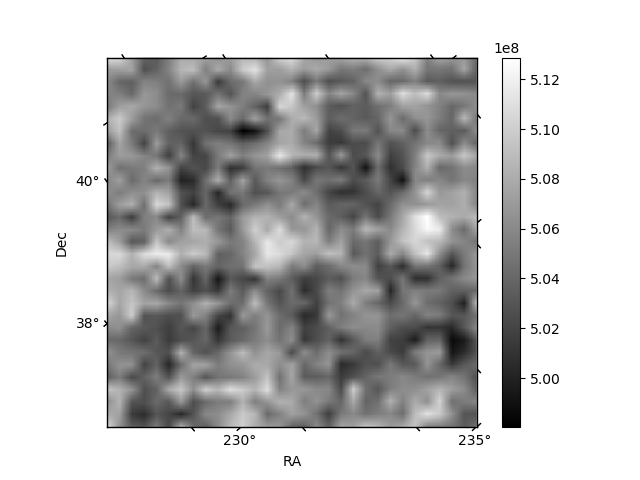
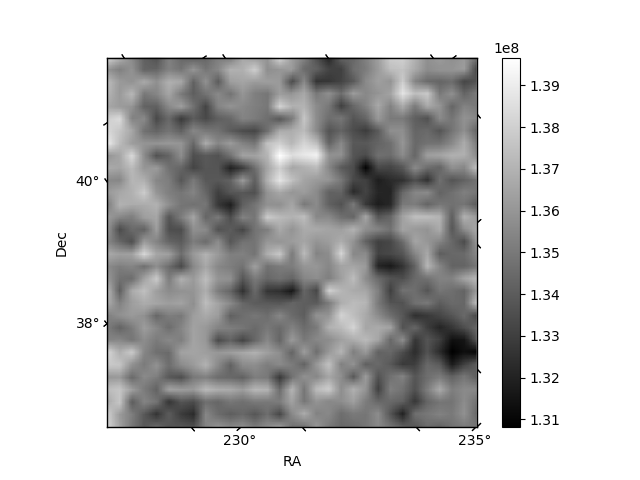
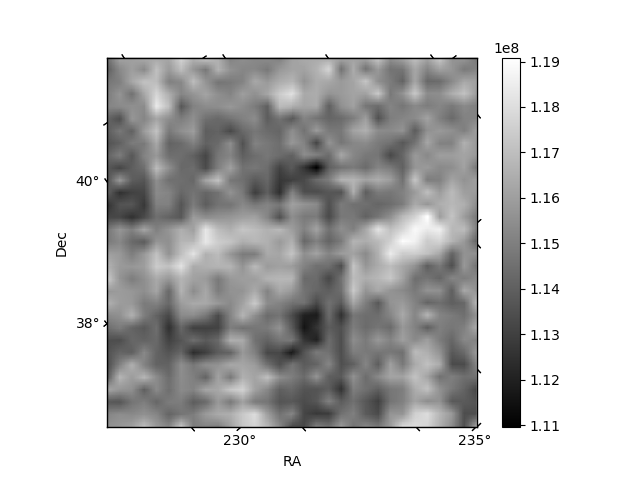
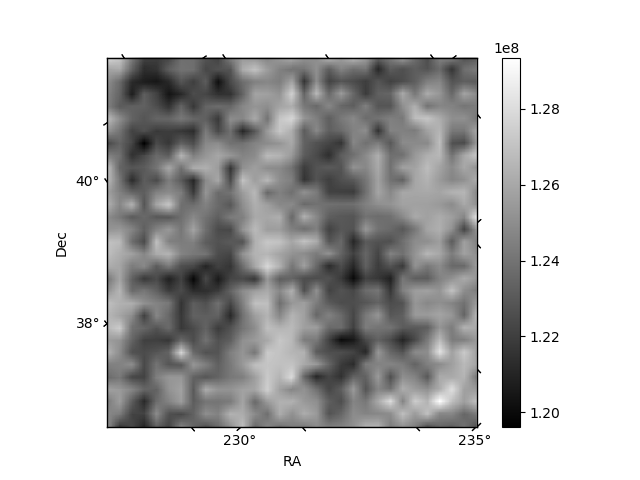
Histogram calculated using DETX and DETY for each event in the final _common_clean file
| Quadrant A | 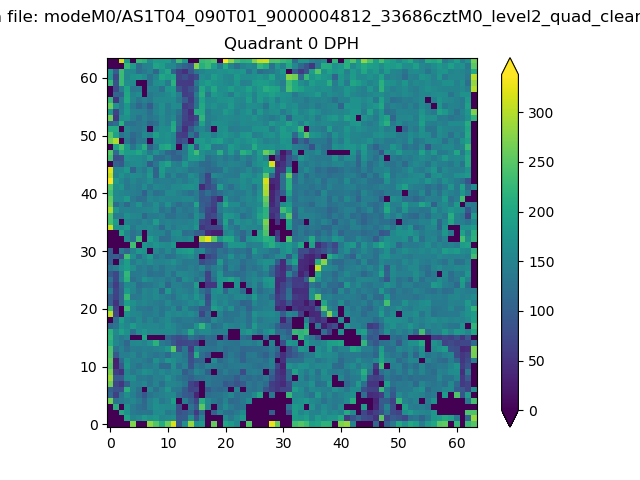 |
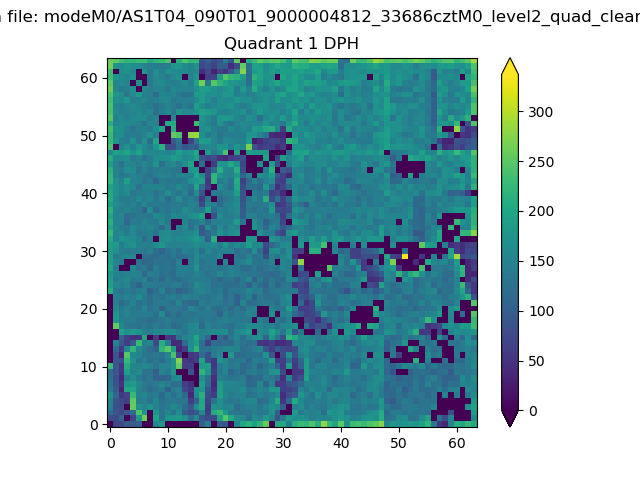 |
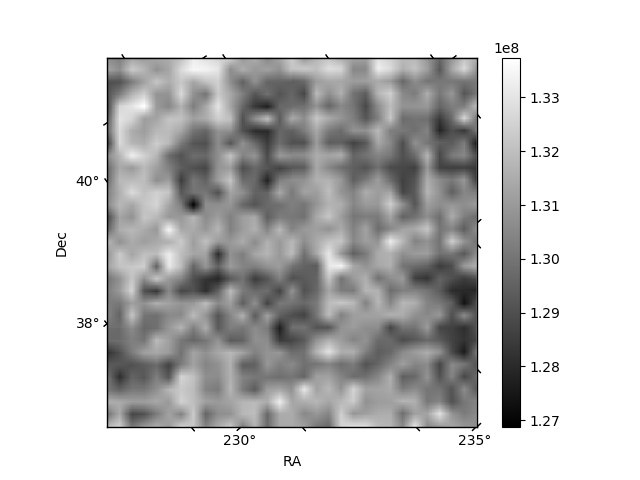
Quadrant B |
|---|---|---|---|
| Quadrant D | 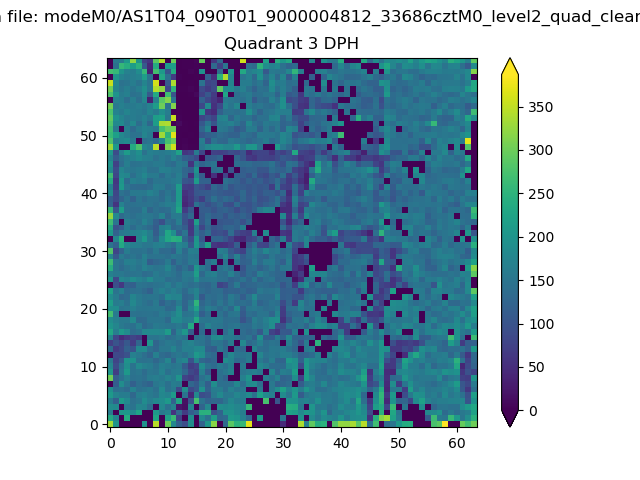 |
 |
Quadrant C |
| Plot type | Count rate plots | Images |
|---|---|---|
| Comparison with Poisson distribution Blue bars denote a histogram of data divided into 1 sec bins. Red curve is a Poisson curve with rate = median count rate of data. |
 |
 |
| Quadrant-wise count rates Data is divided into 100 sec bins |
 |
|
| Module-wise count rates for Quadrant A Data is divided into 100 sec bins |
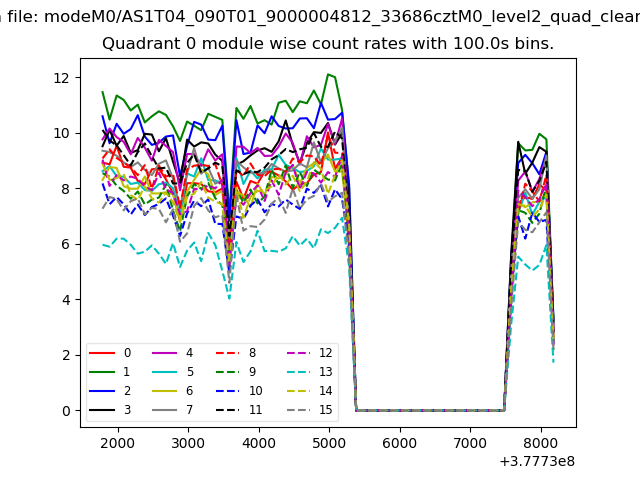 |
 |
| Module-wise count rates for Quadrant B Data is divided into 100 sec bins |
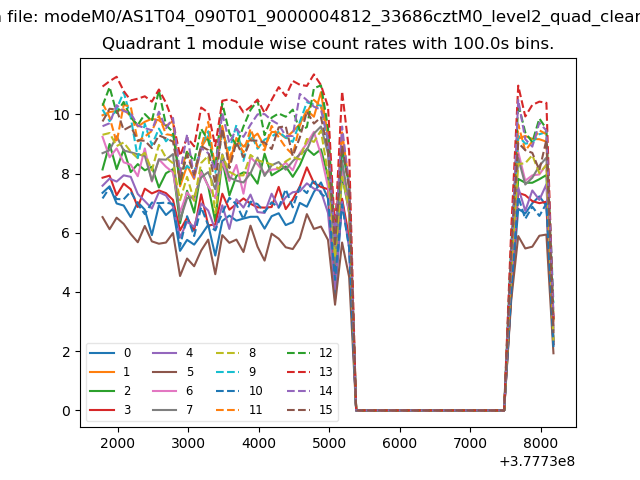 |
 |
| Module-wise count rates for Quadrant C Data is divided into 100 sec bins |
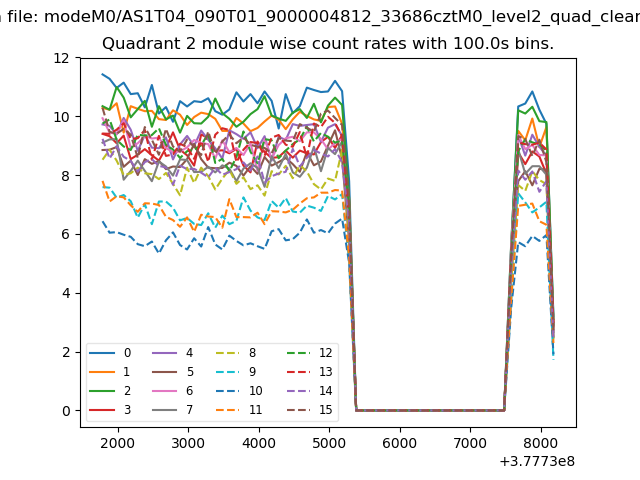 |
 |
| Module-wise count rates for Quadrant D Data is divided into 100 sec bins |
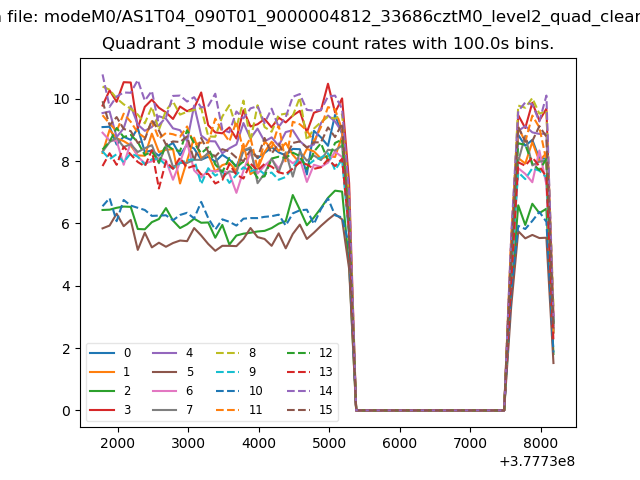 |
 |
| Parameter | Plot |
|---|---|
| CZT HV Monitor | 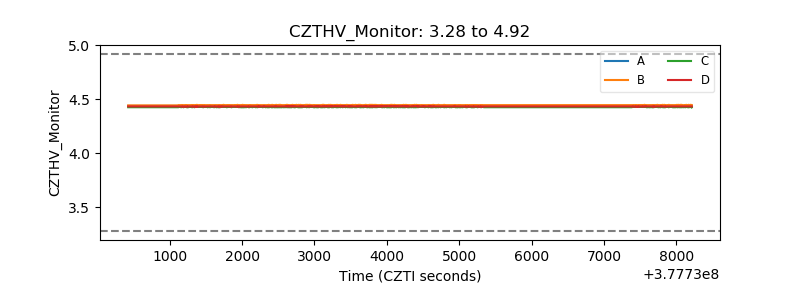 |
| D_VDD | 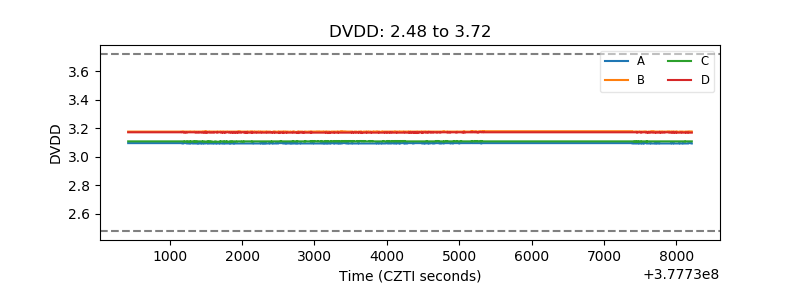 |
| Temperature 1 | 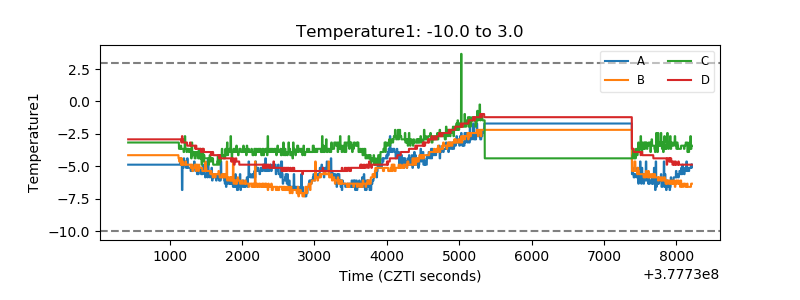 |
| Veto HV Monitor | 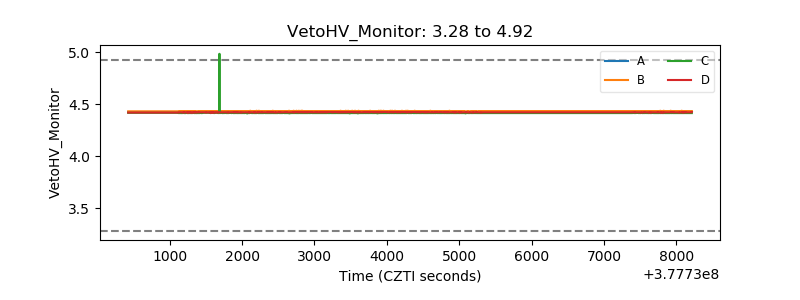 |
| Veto LLD | 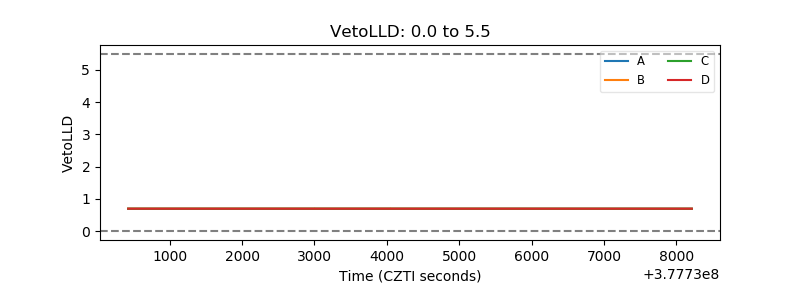 |
| Alpha Counter | 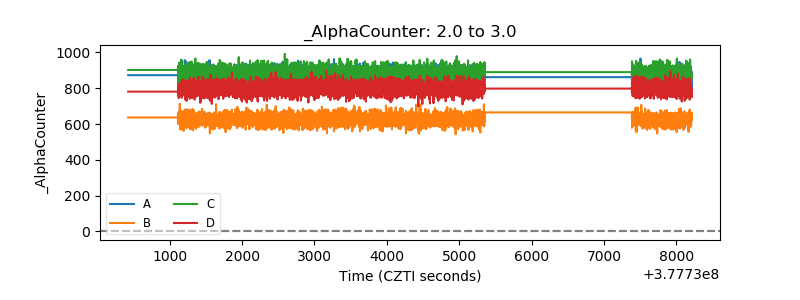 |
| _CPM_Rate |  |
| CZT Counter | 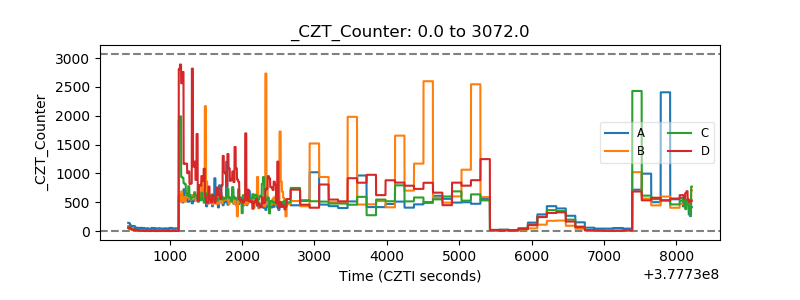 |
| +2.5 Volts monitor |  |
| +5 Volts monitor | 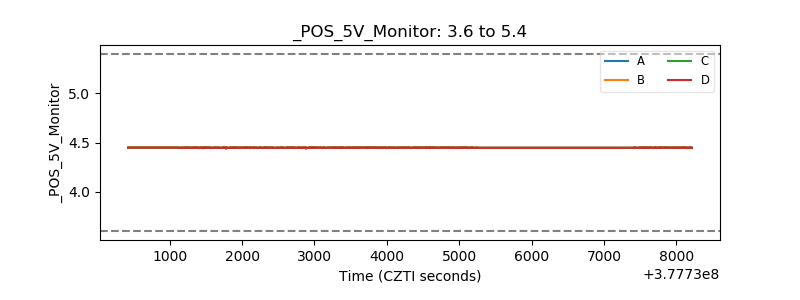 |
| _ROLL_ROT | 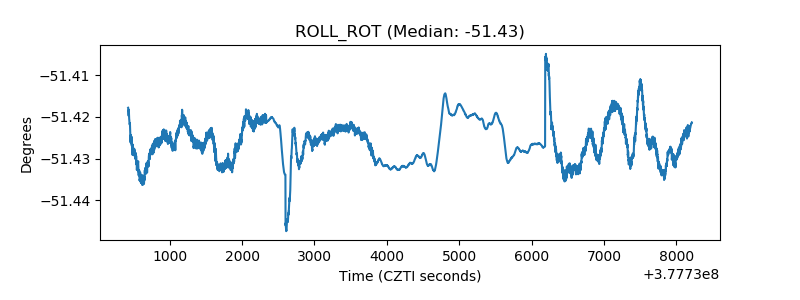 |
| _Roll_DEC | 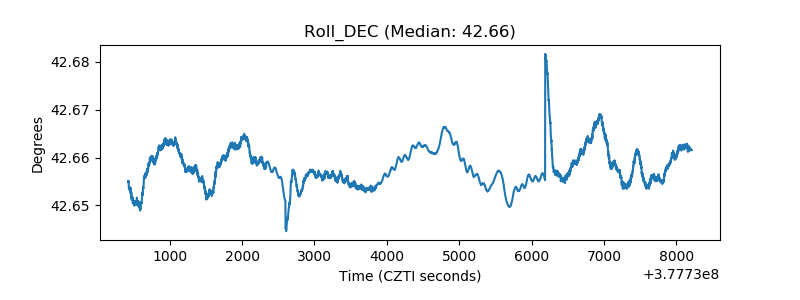 |
| _Roll_RA | 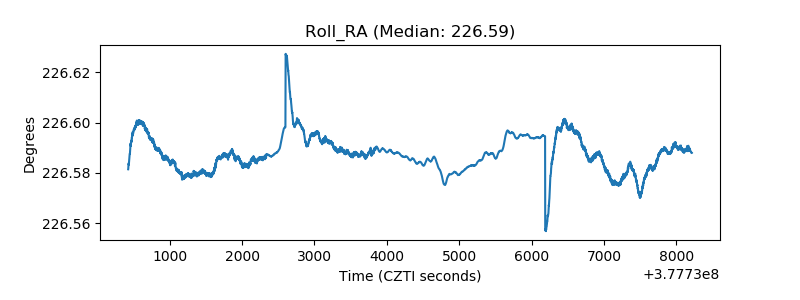 |
| Veto Counter | 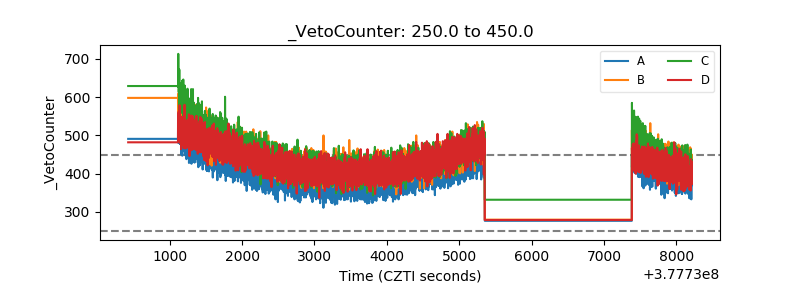 |