| Param | Original file | Final file |
|---|---|---|
| Filename | modeM0/AS1T04_090T01_9000004812_33687cztM0_level2.evt | modeM0/AS1T04_090T01_9000004812_33687cztM0_level2_quad_clean.evt |
| Size (bytes) | 489,170,880 | 89,732,160 |
| Size | 466.5 MB | 85.6 MB |
| Events in quadrant A | 4,513,307 | 560,814 |
| Events in quadrant B | 3,540,757 | 597,040 |
| Events in quadrant C | 3,072,787 | 608,315 |
| Events in quadrant D | 3,326,922 | 578,632 |
| Mode M9 | |||
|---|---|---|---|
| Quadrant | BADHDUFLAG | Total packets | Discarded packets |
| A | 0 | 23 | 0 |
| B | 0 | 23 | 0 |
| C | 0 | 23 | 0 |
| D | 0 | 24 | 0 |
| Mode M0 | |||
|---|---|---|---|
| Quadrant | BADHDUFLAG | Total packets | Discarded packets |
| A | 0 | 16974 | 3 |
| B | 0 | 13971 | 2 |
| C | 0 | 12353 | 2 |
| D | 0 | 13520 | 2 |
| Mode SS | |||
|---|---|---|---|
| Quadrant | BADHDUFLAG | Total packets | Discarded packets |
| A | 0 | 108 | 0 |
| B | 0 | 108 | 0 |
| C | 0 | 108 | 0 |
| D | 0 | 108 | 0 |
| Quadrant | Total seconds | Saturated seconds | Saturation percentage |
|---|---|---|---|
| A | 5319 | 674 | 12.671555% |
| B | 5319 | 314 | 5.903365% |
| C | 5319 | 98 | 1.842452% |
| D | 5319 | 111 | 2.086858% |
Noise dominated data is calculated using 1-second bins in cleaned event files. If a bin has >2000 counts, and if more than 50% of those come from <1% of pixels, then it is considered to be noise-dominated and hence unusable.
| Quadrant | # 1 sec bins | Bins with >0 counts | Bins with >2000 counts | High rate bins dominated by noise | Noise dominated (total time) | Noise dominated (detector-on time) | Marked lightcurve |
|---|---|---|---|---|---|---|---|
| A | 7081 | 5320 | 599 | 599 | 8.46% | 11.26% | 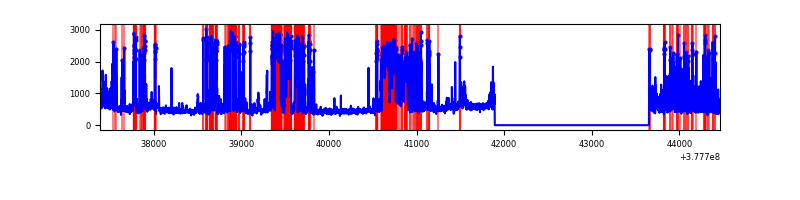 |
| B | 7081 | 5320 | 262 | 262 | 3.70% | 4.92% | 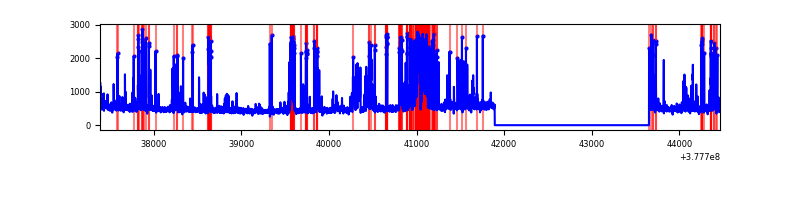 |
| C | 7081 | 5320 | 91 | 91 | 1.29% | 1.71% | 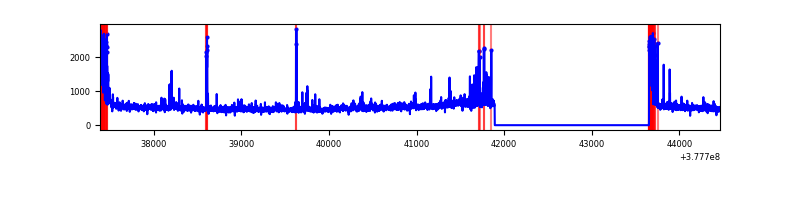 |
| D | 7081 | 5320 | 103 | 103 | 1.45% | 1.94% | 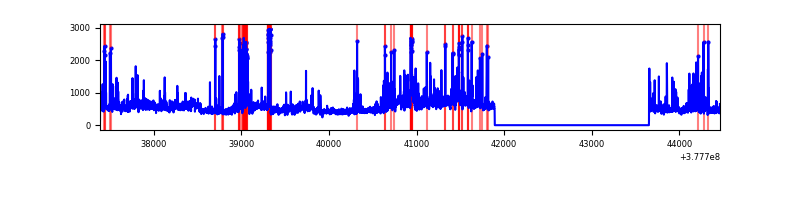 |
Top three noisy pixels from each quadrant. If the there are fewer than three noisy pixels in the level2.evt file, extra rows are filled as -1
| Pixel properties | Quadrant properties | ||||||
|---|---|---|---|---|---|---|---|
| Quadrant | DetID | PixID | Counts | Sigma | Mean | Median | Sigma |
| A | 15 | 237 | 1326806 | 11282.89 | 585 | 574 | 117.5 |
| A | 15 | 169 | 897382 | 7629.58 | 585 | 574 | 117.5 |
| A | 13 | 6 | 13503 | 109.99 | 585 | 574 | 117.5 |
| B | 5 | 172 | 1025989 | 8869.62 | 604 | 589 | 115.6 |
| B | 15 | 85 | 30687 | 260.35 | 604 | 589 | 115.6 |
| B | 0 | 213 | 27537 | 233.1 | 604 | 589 | 115.6 |
| C | 0 | 10 | 261177 | 1883.1 | 600 | 606 | 138.4 |
| C | 15 | 214 | 228488 | 1646.87 | 600 | 606 | 138.4 |
| C | 14 | 254 | 128389 | 923.47 | 600 | 606 | 138.4 |
| D | 8 | 195 | 368059 | 2294.13 | 591 | 577 | 160.2 |
| D | 13 | 249 | 188523 | 1173.31 | 591 | 577 | 160.2 |
| D | 2 | 249 | 131842 | 819.46 | 591 | 577 | 160.2 |
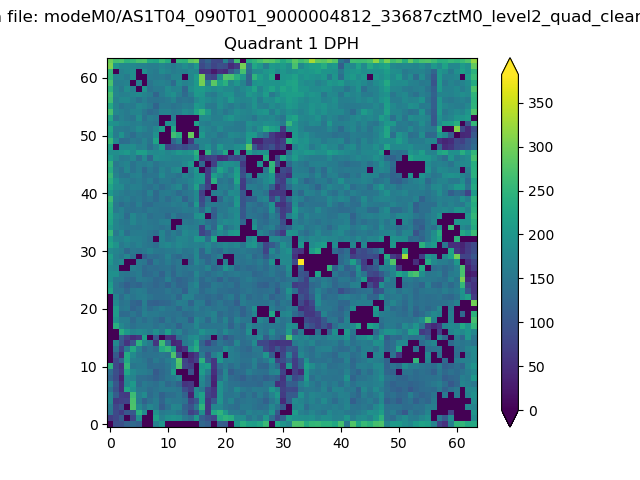
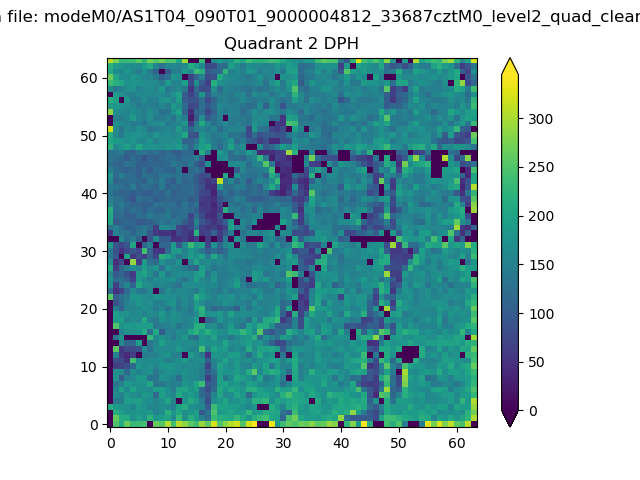
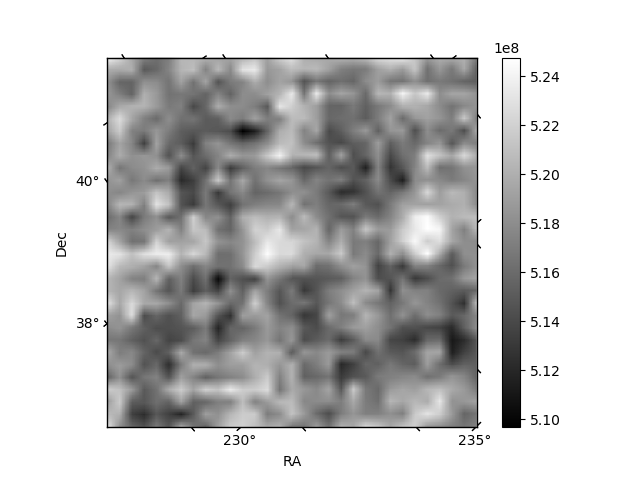
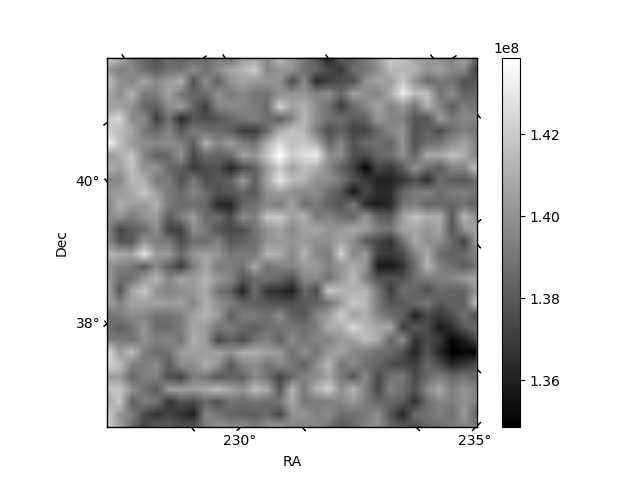
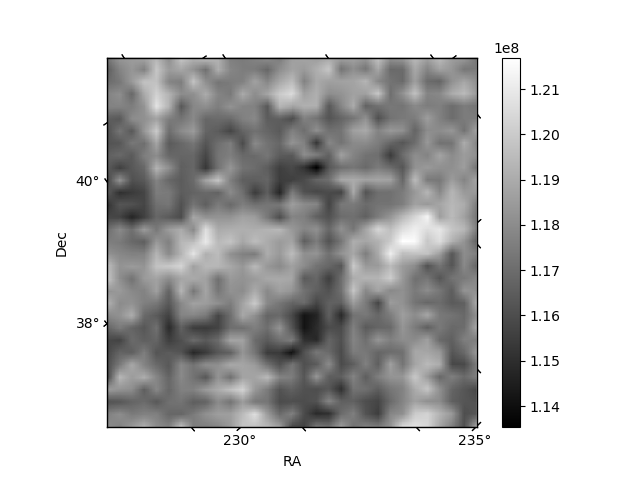
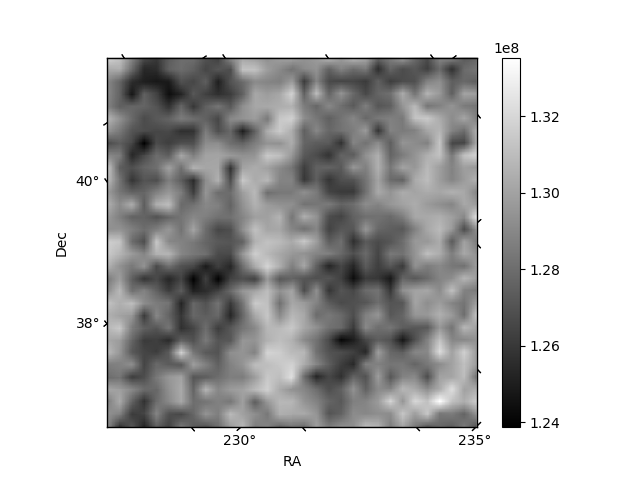
Histogram calculated using DETX and DETY for each event in the final _common_clean file
| Quadrant A | 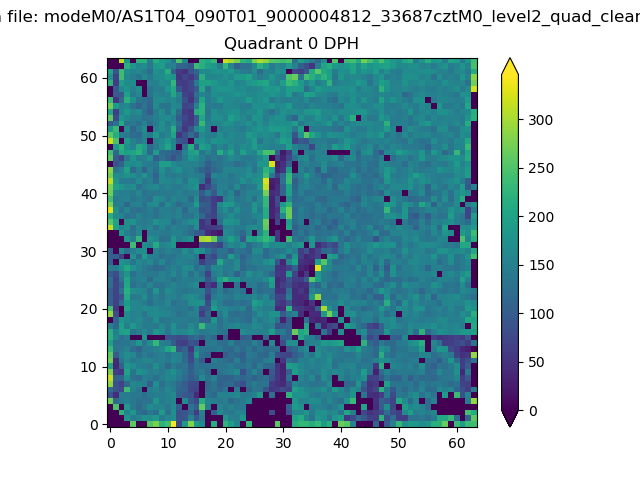 |
 |
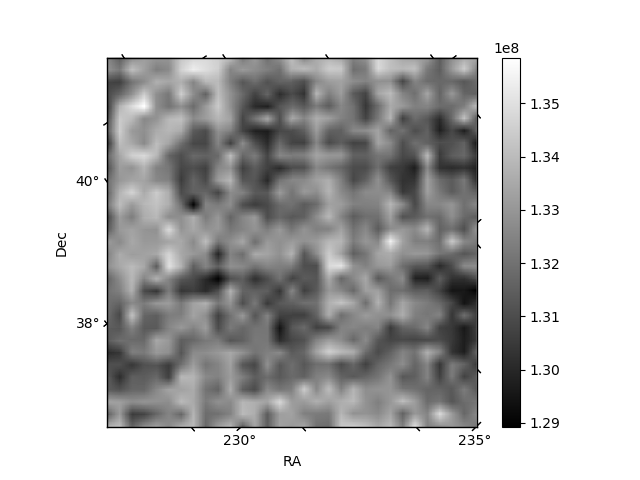
Quadrant B |
|---|---|---|---|
| Quadrant D |  |
 |
Quadrant C |
| Plot type | Count rate plots | Images |
|---|---|---|
| Comparison with Poisson distribution Blue bars denote a histogram of data divided into 1 sec bins. Red curve is a Poisson curve with rate = median count rate of data. |
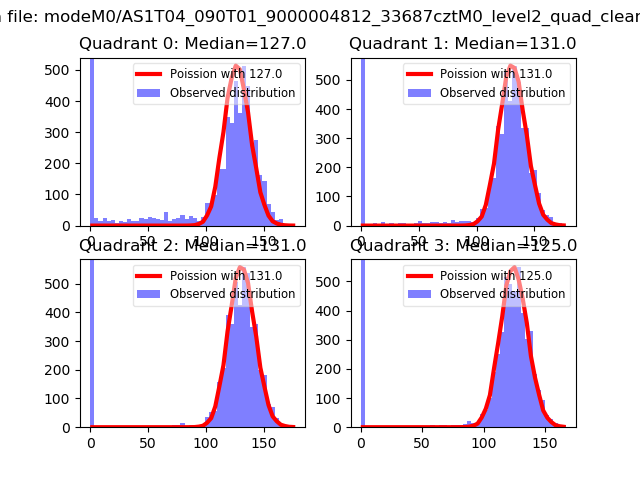 |
 |
| Quadrant-wise count rates Data is divided into 100 sec bins |
 |
|
| Module-wise count rates for Quadrant A Data is divided into 100 sec bins |
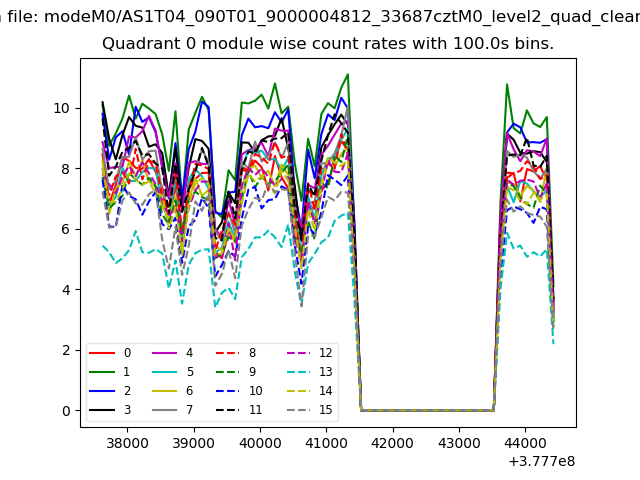 |
 |
| Module-wise count rates for Quadrant B Data is divided into 100 sec bins |
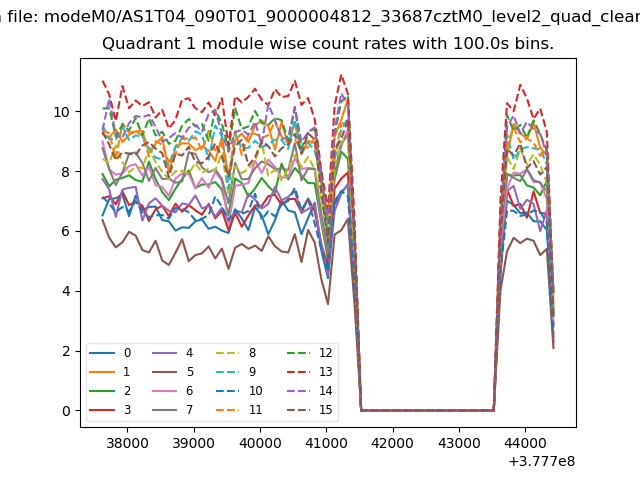 |
 |
| Module-wise count rates for Quadrant C Data is divided into 100 sec bins |
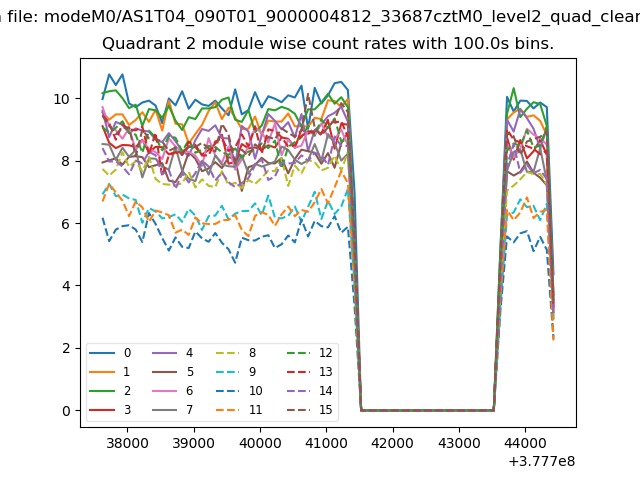 |
 |
| Module-wise count rates for Quadrant D Data is divided into 100 sec bins |
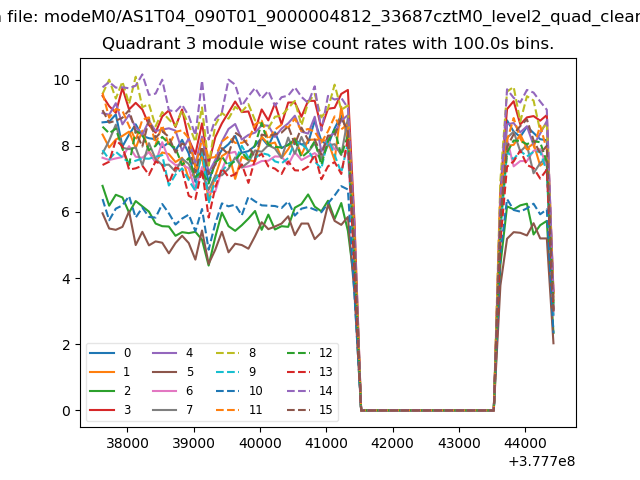 |
 |
| Parameter | Plot |
|---|---|
| CZT HV Monitor | 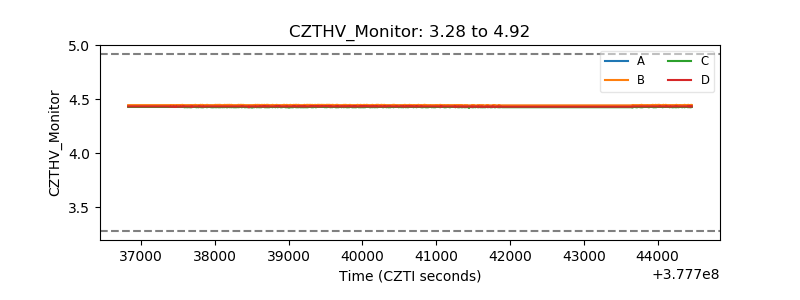 |
| D_VDD | 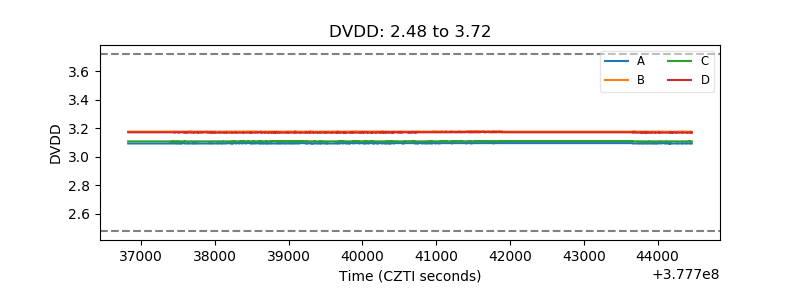 |
| Temperature 1 | 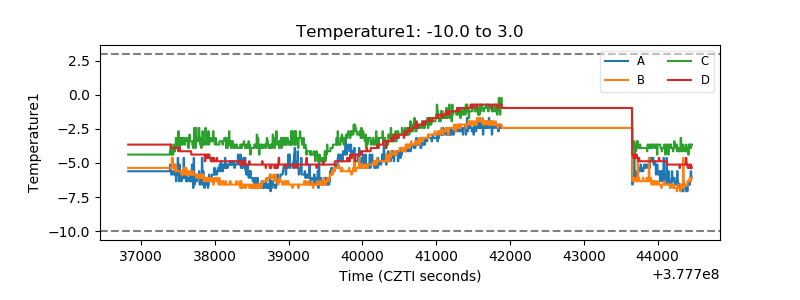 |
| Veto HV Monitor | 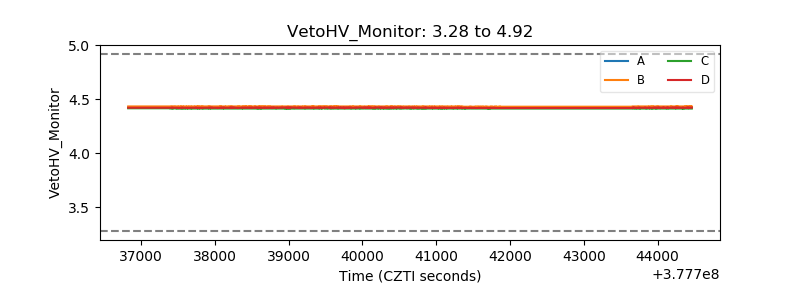 |
| Veto LLD | 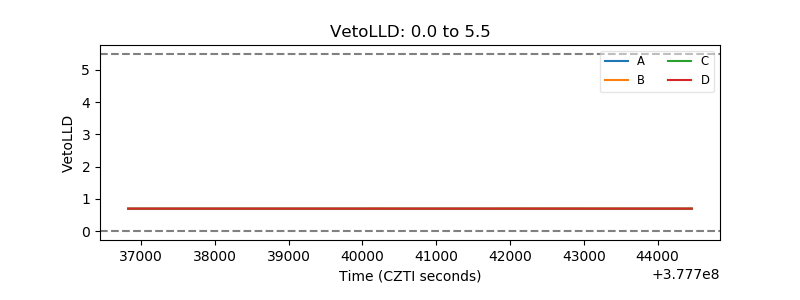 |
| Alpha Counter |  |
| _CPM_Rate |  |
| CZT Counter | 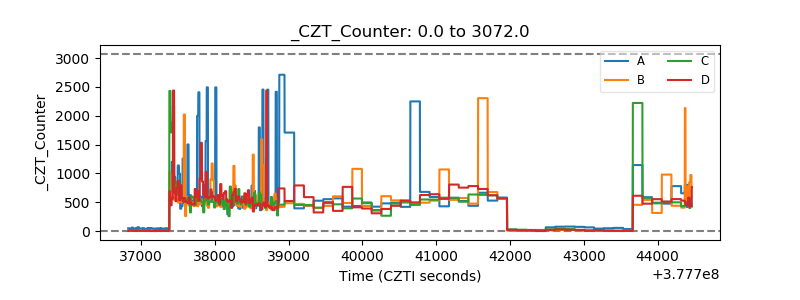 |
| +2.5 Volts monitor |  |
| +5 Volts monitor |  |
| _ROLL_ROT | 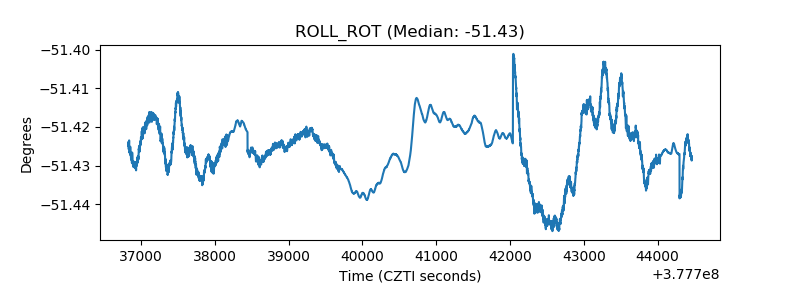 |
| _Roll_DEC | 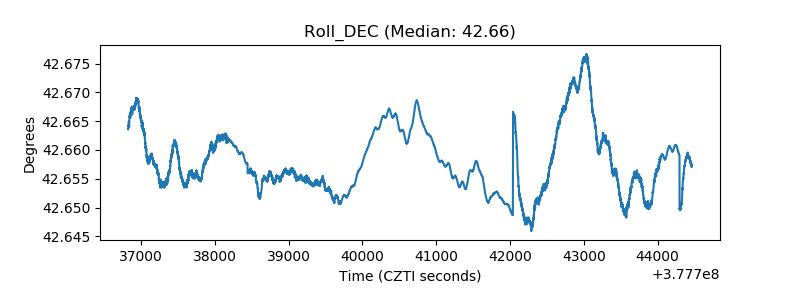 |
| _Roll_RA |  |
| Veto Counter | 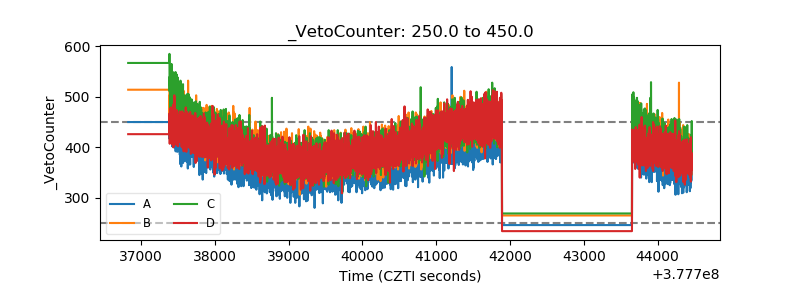 |