| Param | Original file | Final file |
|---|---|---|
| Filename | modeM0/AS1T04_090T01_9000004812_33689cztM0_level2.evt | modeM0/AS1T04_090T01_9000004812_33689cztM0_level2_quad_clean.evt |
| Size (bytes) | 810,907,200 | 70,326,720 |
| Size | 773.3 MB | 67.1 MB |
| Events in quadrant A | 13,433,104 | 268,177 |
| Events in quadrant B | 3,956,340 | 488,332 |
| Events in quadrant C | 3,147,109 | 497,671 |
| Events in quadrant D | 3,632,211 | 470,329 |
| Mode M9 | |||
|---|---|---|---|
| Quadrant | BADHDUFLAG | Total packets | Discarded packets |
| A | 0 | 13 | 0 |
| B | 0 | 13 | 0 |
| C | 0 | 13 | 0 |
| D | 0 | 13 | 0 |
| Mode M0 | |||
|---|---|---|---|
| Quadrant | BADHDUFLAG | Total packets | Discarded packets |
| A | 0 | 43875 | 2 |
| B | 0 | 15514 | 1 |
| C | 0 | 12809 | 1 |
| D | 0 | 14716 | 1 |
| Mode SS | |||
|---|---|---|---|
| Quadrant | BADHDUFLAG | Total packets | Discarded packets |
| A | 0 | 118 | 0 |
| B | 0 | 118 | 0 |
| C | 0 | 118 | 0 |
| D | 0 | 118 | 0 |
| Quadrant | Total seconds | Saturated seconds | Saturation percentage |
|---|---|---|---|
| A | 5765 | 4778 | 82.879445% |
| B | 5765 | 333 | 5.776236% |
| C | 5765 | 44 | 0.763226% |
| D | 5765 | 118 | 2.046834% |
Noise dominated data is calculated using 1-second bins in cleaned event files. If a bin has >2000 counts, and if more than 50% of those come from <1% of pixels, then it is considered to be noise-dominated and hence unusable.
| Quadrant | # 1 sec bins | Bins with >0 counts | Bins with >2000 counts | High rate bins dominated by noise | Noise dominated (total time) | Noise dominated (detector-on time) | Marked lightcurve |
|---|---|---|---|---|---|---|---|
| A | 7076 | 5764 | 4700 | 4700 | 66.42% | 81.54% | 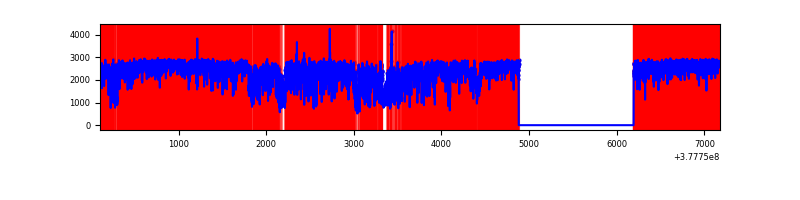 |
| B | 7077 | 5766 | 268 | 268 | 3.79% | 4.65% | 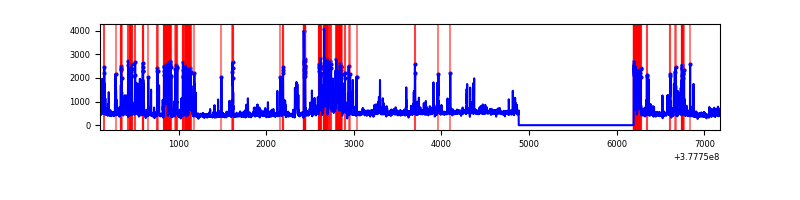 |
| C | 7077 | 5766 | 44 | 44 | 0.62% | 0.76% | 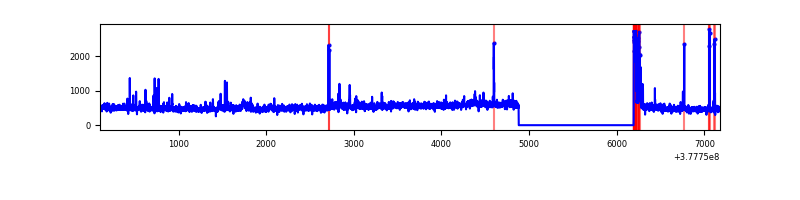 |
| D | 7077 | 5766 | 99 | 99 | 1.40% | 1.72% | 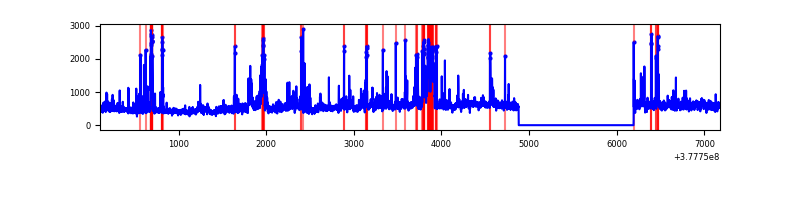 |
Top three noisy pixels from each quadrant. If the there are fewer than three noisy pixels in the level2.evt file, extra rows are filled as -1
| Pixel properties | Quadrant properties | ||||||
|---|---|---|---|---|---|---|---|
| Quadrant | DetID | PixID | Counts | Sigma | Mean | Median | Sigma |
| A | 15 | 169 | 11597427 | 142304.62 | 402 | 395 | 81.5 |
| A | 15 | 237 | 236615 | 2898.6 | 402 | 395 | 81.5 |
| A | 14 | 4 | 33714 | 408.85 | 402 | 395 | 81.5 |
| B | 5 | 172 | 1177979 | 9427.14 | 646 | 629 | 124.9 |
| B | 0 | 213 | 86445 | 687.14 | 646 | 629 | 124.9 |
| B | 15 | 85 | 33577 | 263.82 | 646 | 629 | 124.9 |
| C | 15 | 214 | 246867 | 1658.45 | 639 | 644 | 148.5 |
| C | 3 | 233 | 173178 | 1162.11 | 639 | 644 | 148.5 |
| C | 0 | 10 | 140275 | 940.49 | 639 | 644 | 148.5 |
| D | 8 | 195 | 486224 | 3026.98 | 635 | 618 | 160.4 |
| D | 8 | 230 | 206177 | 1281.34 | 635 | 618 | 160.4 |
| D | 13 | 249 | 175386 | 1089.4 | 635 | 618 | 160.4 |
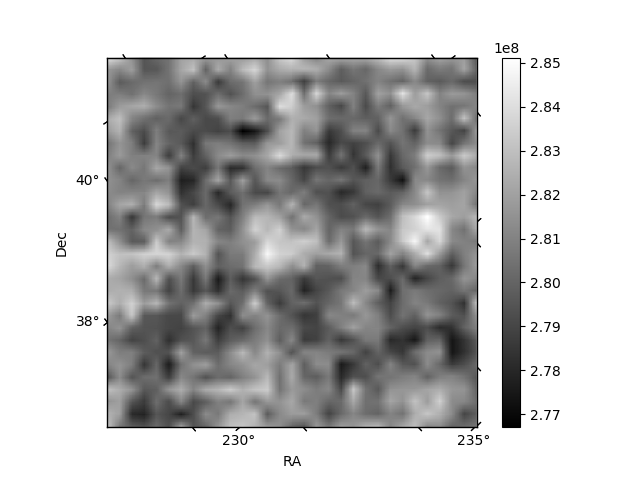
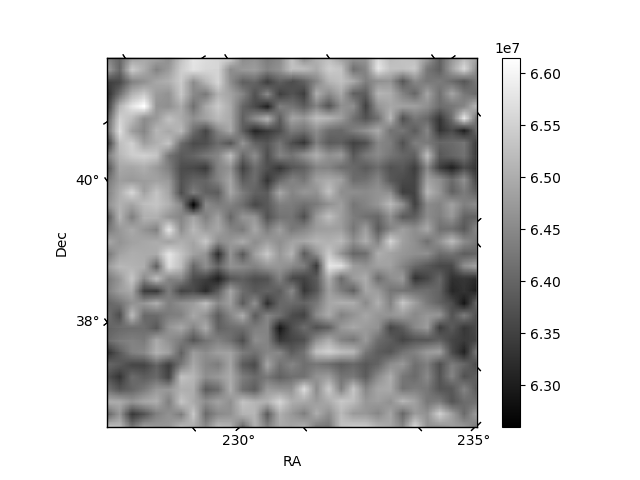
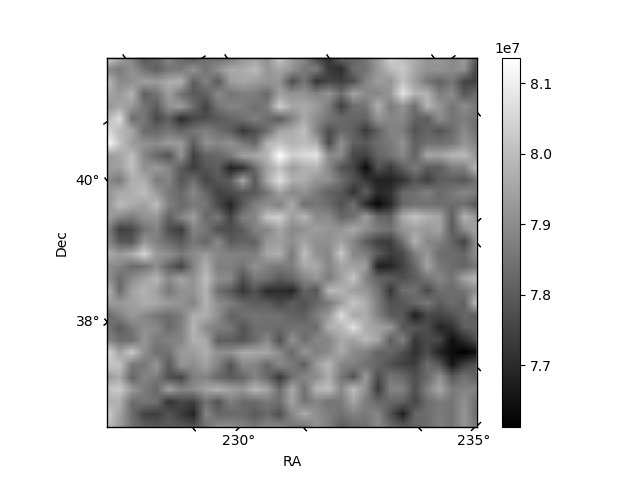
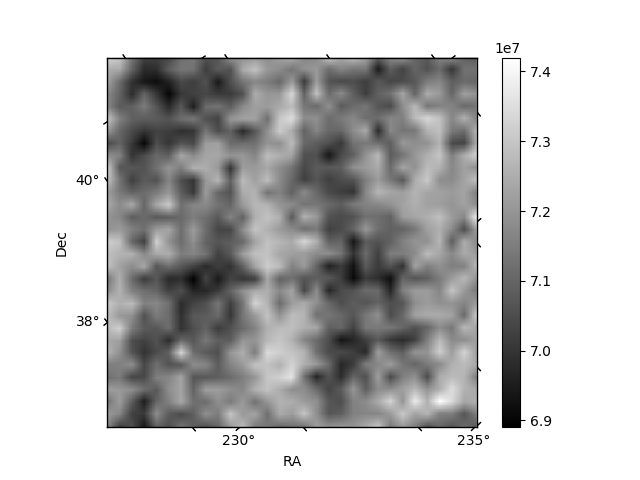
Histogram calculated using DETX and DETY for each event in the final _common_clean file
| Quadrant A | 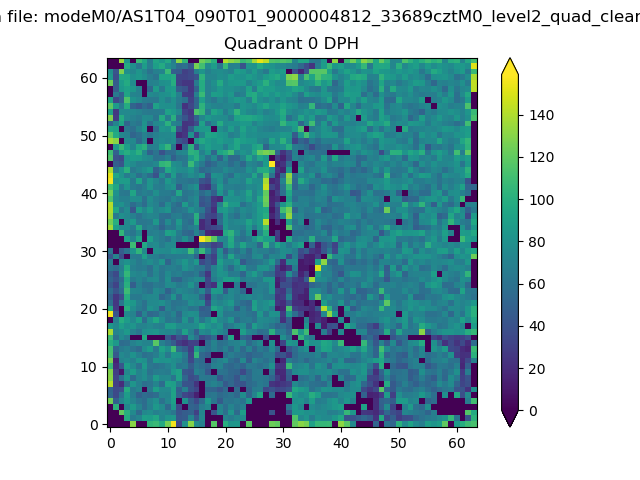 |
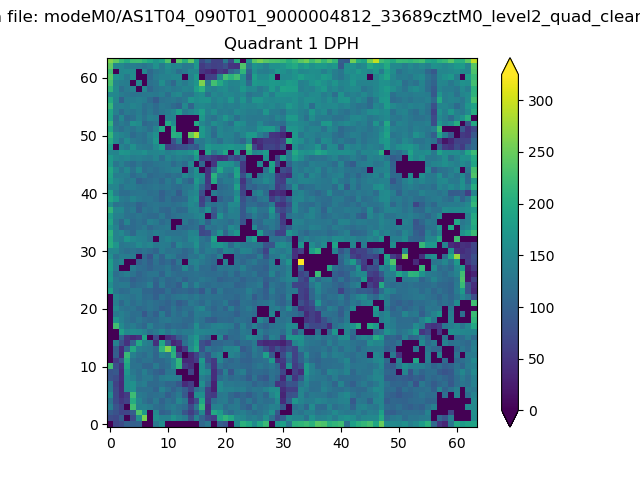 |
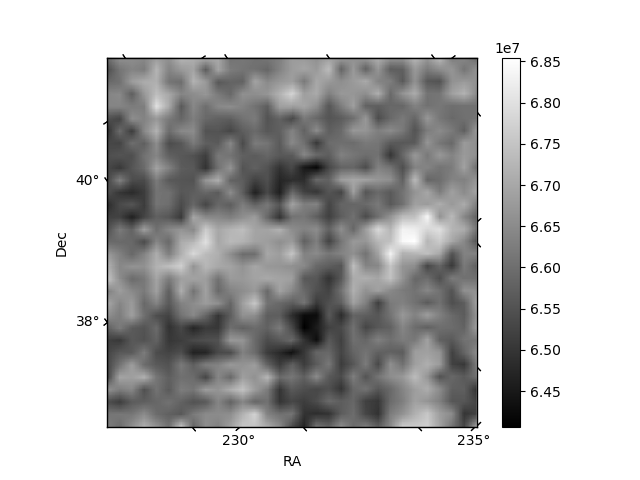
Quadrant B |
|---|---|---|---|
| Quadrant D | 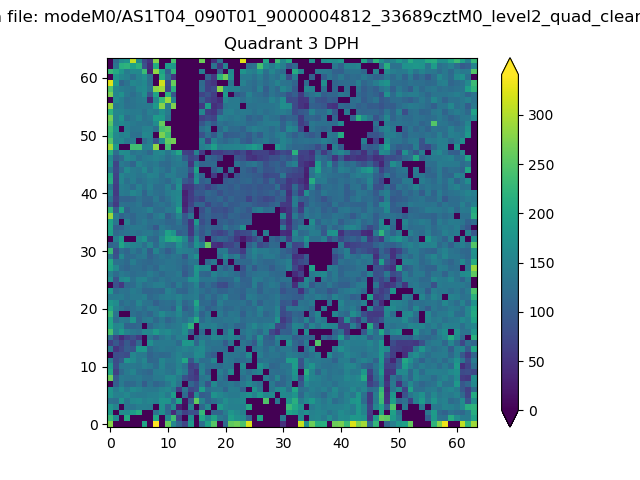 |
 |
Quadrant C |
| Plot type | Count rate plots | Images |
|---|---|---|
| Comparison with Poisson distribution Blue bars denote a histogram of data divided into 1 sec bins. Red curve is a Poisson curve with rate = median count rate of data. |
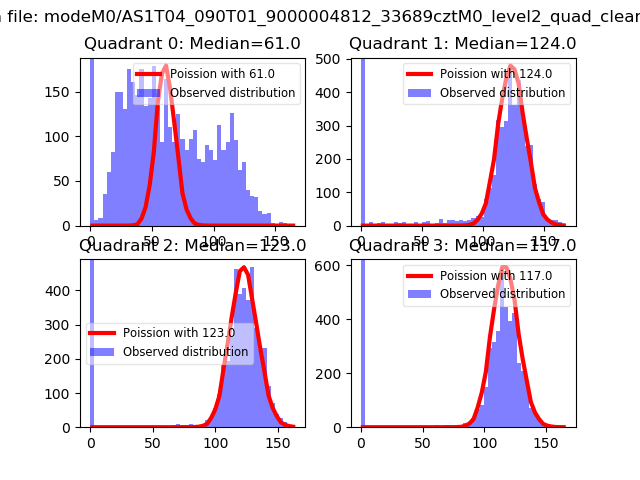 |
 |
| Quadrant-wise count rates Data is divided into 100 sec bins |
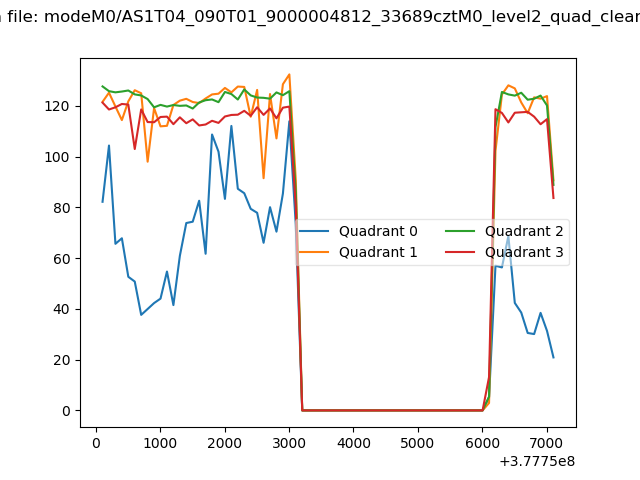 |
|
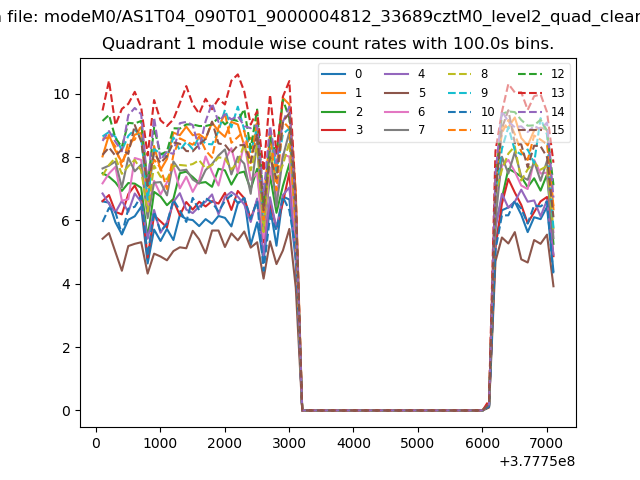
| Module-wise count rates for Quadrant A Data is divided into 100 sec bins |
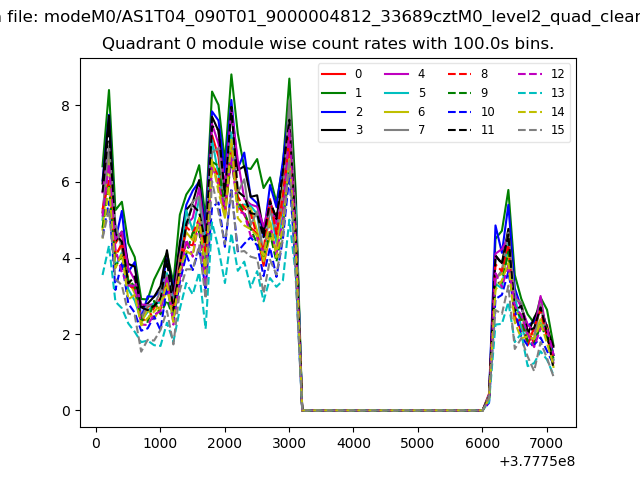 |
 |
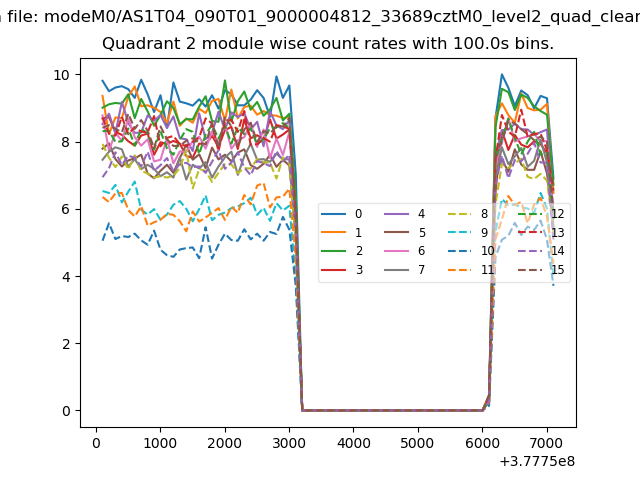
| Module-wise count rates for Quadrant B Data is divided into 100 sec bins |
 |
 |
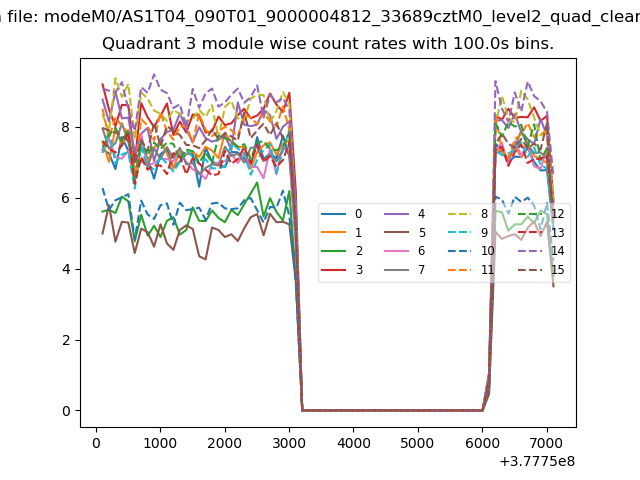
| Module-wise count rates for Quadrant C Data is divided into 100 sec bins |
 |
 |
| Module-wise count rates for Quadrant D Data is divided into 100 sec bins |
 |
 |
| Parameter | Plot |
|---|---|
| CZT HV Monitor | 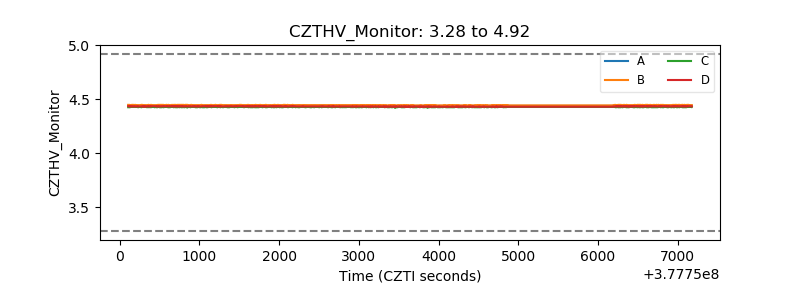 |
| D_VDD | 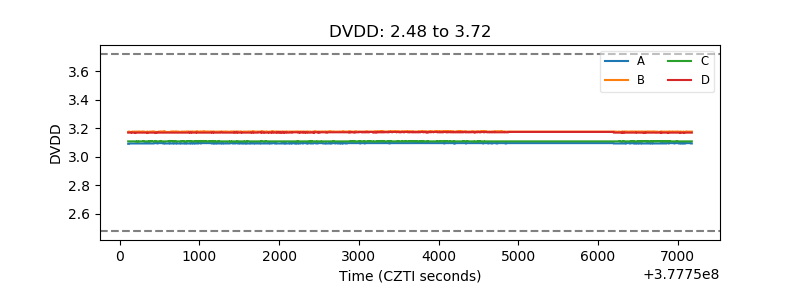 |
| Temperature 1 | 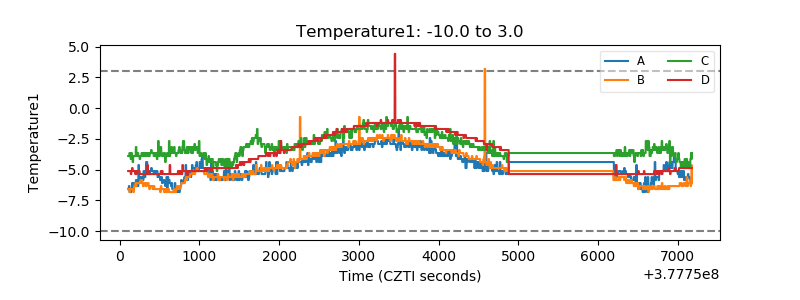 |
| Veto HV Monitor |  |
| Veto LLD | 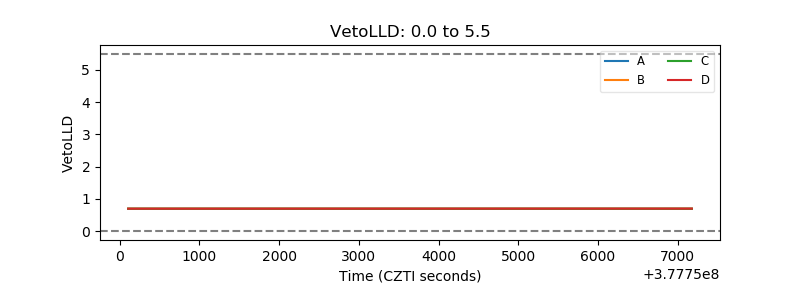 |
| Alpha Counter | 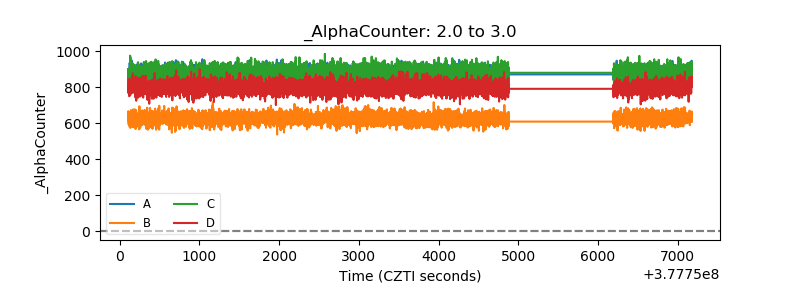 |
| _CPM_Rate | 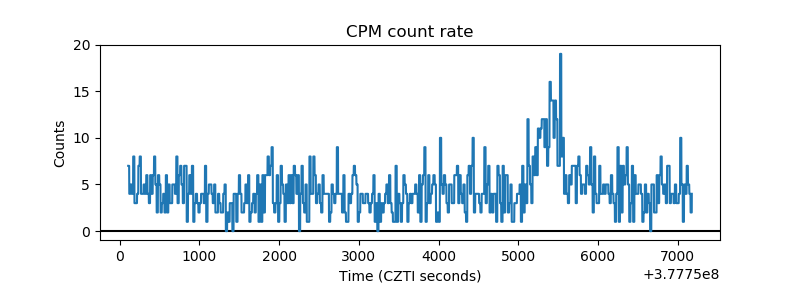 |
| CZT Counter | 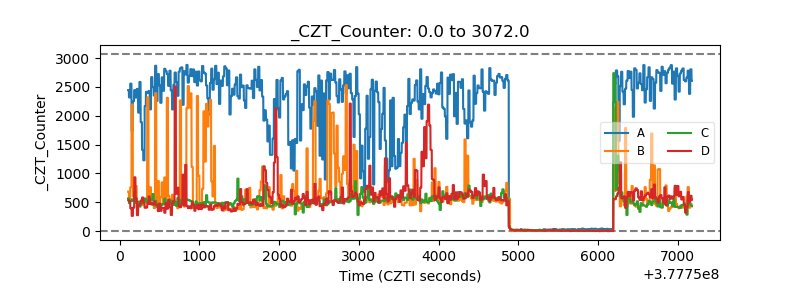 |
| +2.5 Volts monitor |  |
| +5 Volts monitor | 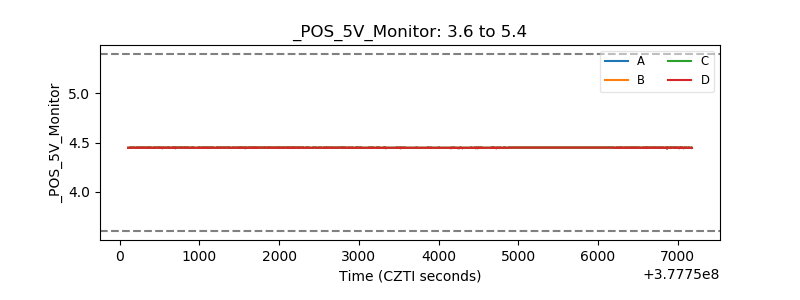 |
| _ROLL_ROT | 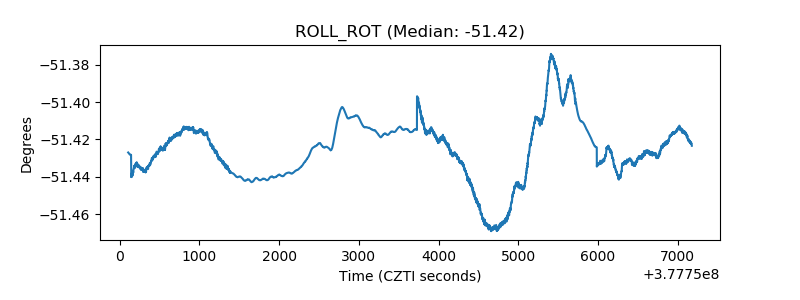 |
| _Roll_DEC | 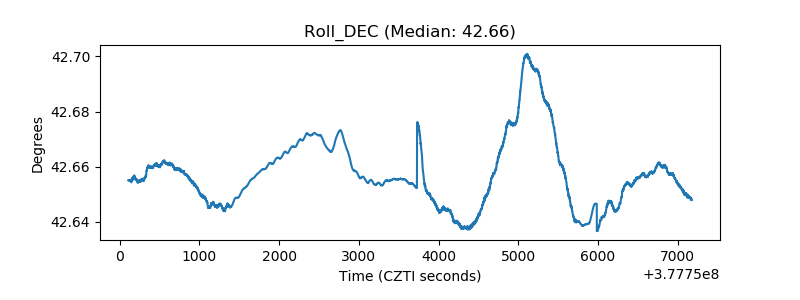 |
| _Roll_RA |  |
| Veto Counter | 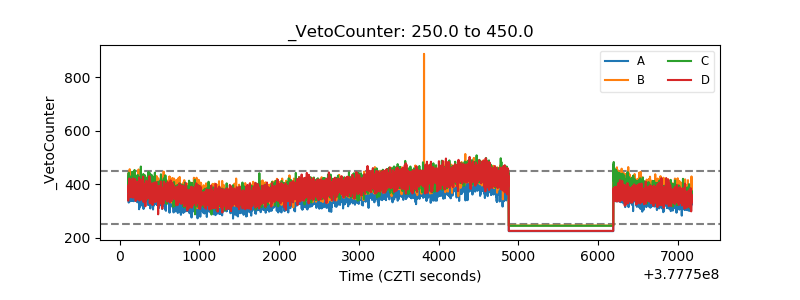 |