| Param | Original file | Final file |
|---|---|---|
| Filename | modeM0/AS1T04_090T01_9000004812_33692cztM0_level2.evt | modeM0/AS1T04_090T01_9000004812_33692cztM0_level2_quad_clean.evt |
| Size (bytes) | 1,936,445,760 | 175,852,800 |
| Size | 1.8 GB | 167.7 MB |
| Events in quadrant A | 26,987,368 | 787,916 |
| Events in quadrant B | 10,623,778 | 1,161,310 |
| Events in quadrant C | 8,652,255 | 1,184,996 |
| Events in quadrant D | 11,332,975 | 1,110,647 |
| Mode M9 | |||
|---|---|---|---|
| Quadrant | BADHDUFLAG | Total packets | Discarded packets |
| A | 0 | 42 | 0 |
| B | 0 | 42 | 0 |
| C | 0 | 42 | 0 |
| D | 0 | 43 | 0 |
| Mode M0 | |||
|---|---|---|---|
| Quadrant | BADHDUFLAG | Total packets | Discarded packets |
| A | 0 | 90984 | 5 |
| B | 0 | 41416 | 4 |
| C | 0 | 34889 | 4 |
| D | 0 | 44738 | 4 |
| Mode SS | |||
|---|---|---|---|
| Quadrant | BADHDUFLAG | Total packets | Discarded packets |
| A | 0 | 318 | 0 |
| B | 0 | 318 | 0 |
| C | 0 | 318 | 0 |
| D | 0 | 318 | 0 |
| Quadrant | Total seconds | Saturated seconds | Saturation percentage |
|---|---|---|---|
| A | 15626 | 7353 | 47.056188% |
| B | 15626 | 994 | 6.361193% |
| C | 15626 | 159 | 1.017535% |
| D | 15626 | 491 | 3.142199% |
Noise dominated data is calculated using 1-second bins in cleaned event files. If a bin has >2000 counts, and if more than 50% of those come from <1% of pixels, then it is considered to be noise-dominated and hence unusable.
| Quadrant | # 1 sec bins | Bins with >0 counts | Bins with >2000 counts | High rate bins dominated by noise | Noise dominated (total time) | Noise dominated (detector-on time) | Marked lightcurve |
|---|---|---|---|---|---|---|---|
| A | 19803 | 15626 | 6982 | 6982 | 35.26% | 44.68% | 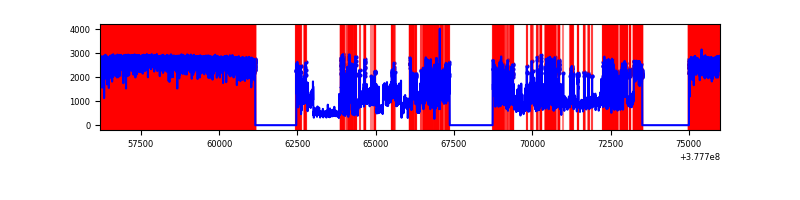 |
| B | 19804 | 15629 | 837 | 837 | 4.23% | 5.36% | 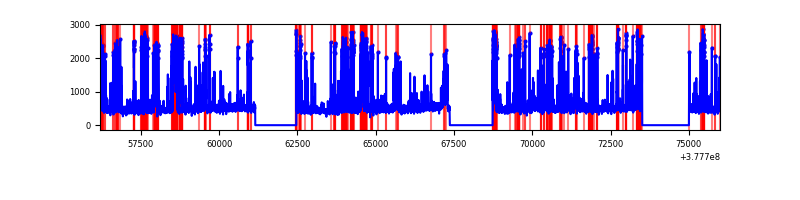 |
| C | 19804 | 15629 | 138 | 138 | 0.70% | 0.88% | 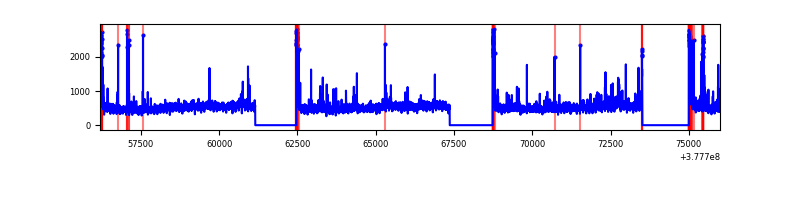 |
| D | 19804 | 15629 | 451 | 451 | 2.28% | 2.89% | 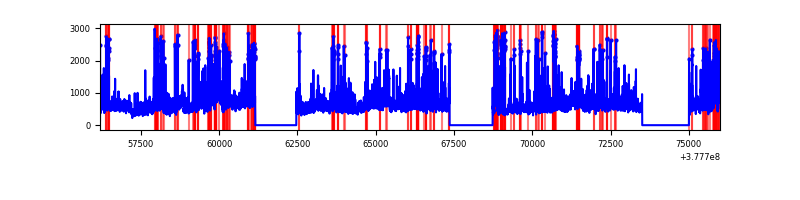 |
Top three noisy pixels from each quadrant. If the there are fewer than three noisy pixels in the level2.evt file, extra rows are filled as -1
| Pixel properties | Quadrant properties | ||||||
|---|---|---|---|---|---|---|---|
| Quadrant | DetID | PixID | Counts | Sigma | Mean | Median | Sigma |
| A | 15 | 169 | 19936476 | 77439.21 | 1303 | 1278 | 257.4 |
| A | 15 | 237 | 1544244 | 5993.72 | 1303 | 1278 | 257.4 |
| A | 14 | 4 | 430892 | 1668.86 | 1303 | 1278 | 257.4 |
| B | 5 | 172 | 2813464 | 8432.4 | 1758 | 1709 | 333.4 |
| B | 0 | 213 | 248646 | 740.56 | 1758 | 1709 | 333.4 |
| B | 15 | 222 | 150309 | 445.65 | 1758 | 1709 | 333.4 |
| C | 15 | 214 | 667424 | 1659.6 | 1755 | 1768 | 401.1 |
| C | 3 | 233 | 532622 | 1323.51 | 1755 | 1768 | 401.1 |
| C | 0 | 10 | 418888 | 1039.95 | 1755 | 1768 | 401.1 |
| D | 8 | 195 | 2183222 | 5072.92 | 1750 | 1699 | 430.0 |
| D | 15 | 0 | 643910 | 1493.4 | 1750 | 1699 | 430.0 |
| D | 13 | 249 | 475065 | 1100.77 | 1750 | 1699 | 430.0 |
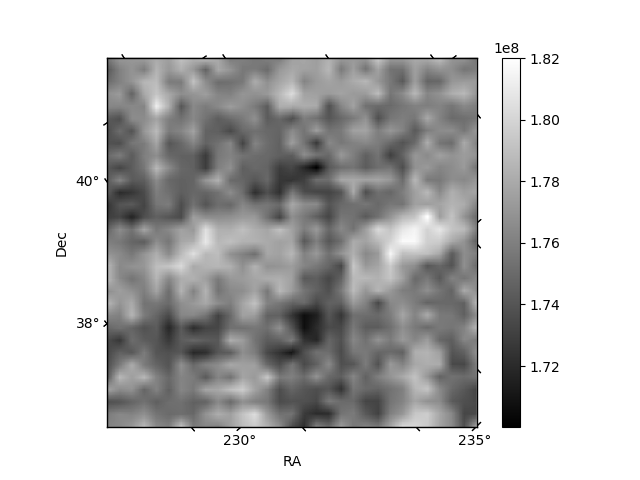
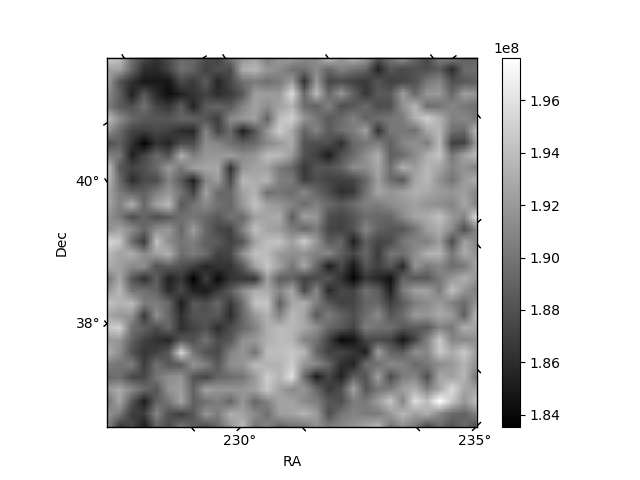
Histogram calculated using DETX and DETY for each event in the final _common_clean file
| Quadrant A |  |
 |
Quadrant B |
|---|---|---|---|
| Quadrant D |  |
 |
Quadrant C |
| Plot type | Count rate plots | Images |
|---|---|---|
| Comparison with Poisson distribution Blue bars denote a histogram of data divided into 1 sec bins. Red curve is a Poisson curve with rate = median count rate of data. |
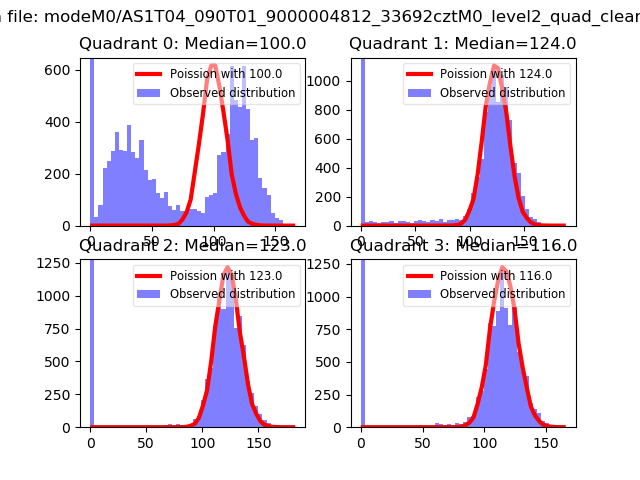 |
 |
| Quadrant-wise count rates Data is divided into 100 sec bins |
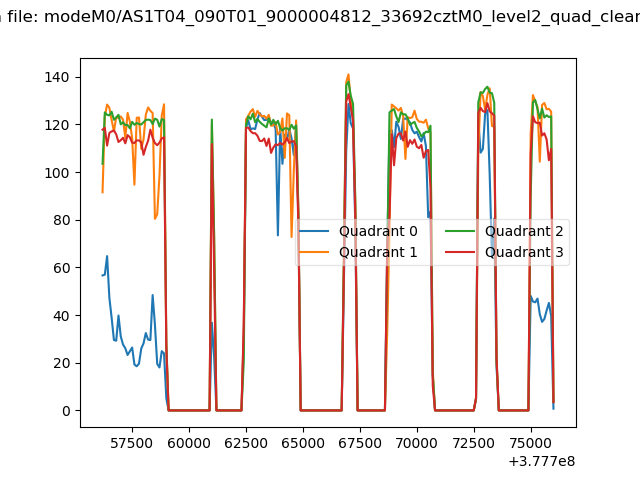 |
|
| Module-wise count rates for Quadrant A Data is divided into 100 sec bins |
 |
 |
| Module-wise count rates for Quadrant B Data is divided into 100 sec bins |
 |
 |
| Module-wise count rates for Quadrant C Data is divided into 100 sec bins |
 |
 |
| Module-wise count rates for Quadrant D Data is divided into 100 sec bins |
 |
 |
| Parameter | Plot |
|---|---|
| CZT HV Monitor |  |
| D_VDD | 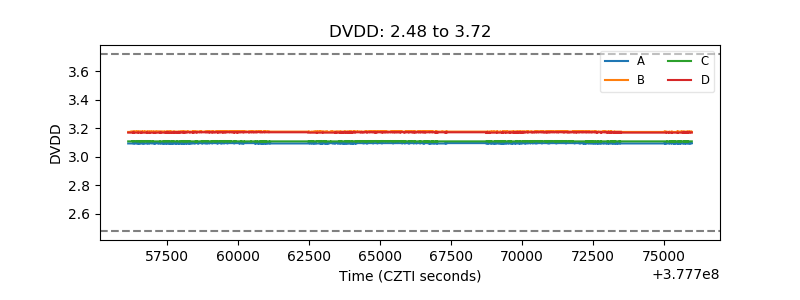 |
| Temperature 1 |  |
| Veto HV Monitor |  |
| Veto LLD |  |
| Alpha Counter |  |
| _CPM_Rate | 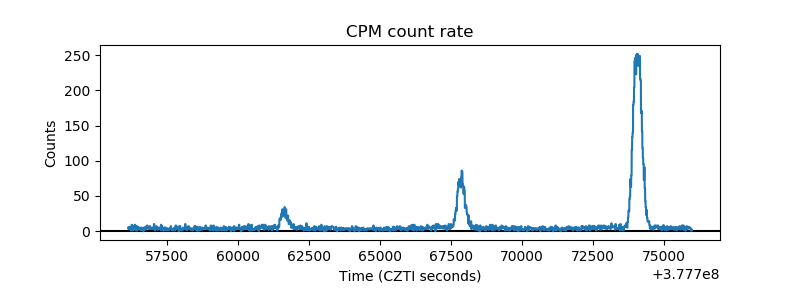 |
| CZT Counter |  |
| +2.5 Volts monitor |  |
| +5 Volts monitor |  |
| _ROLL_ROT |  |
| _Roll_DEC |  |
| _Roll_RA |  |
| Veto Counter |  |