| Param | Original file | Final file |
|---|---|---|
| Filename | modeM0/AS1T04_090T01_9000004812_33693cztM0_level2.evt | modeM0/AS1T04_090T01_9000004812_33693cztM0_level2_quad_clean.evt |
| Size (bytes) | 861,742,080 | 60,405,120 |
| Size | 821.8 MB | 57.6 MB |
| Events in quadrant A | 14,187,286 | 127,398 |
| Events in quadrant B | 4,062,130 | 434,486 |
| Events in quadrant C | 3,247,374 | 453,614 |
| Events in quadrant D | 4,227,498 | 424,315 |
| Mode M9 | |||
|---|---|---|---|
| Quadrant | BADHDUFLAG | Total packets | Discarded packets |
| A | 0 | 16 | 0 |
| B | 0 | 16 | 0 |
| C | 0 | 16 | 0 |
| D | 0 | 16 | 0 |
| Mode M0 | |||
|---|---|---|---|
| Quadrant | BADHDUFLAG | Total packets | Discarded packets |
| A | 0 | 46036 | 2 |
| B | 0 | 15573 | 1 |
| C | 0 | 12901 | 1 |
| D | 0 | 16598 | 1 |
| Mode SS | |||
|---|---|---|---|
| Quadrant | BADHDUFLAG | Total packets | Discarded packets |
| A | 0 | 114 | 0 |
| B | 0 | 114 | 0 |
| C | 0 | 114 | 0 |
| D | 0 | 114 | 0 |
| Quadrant | Total seconds | Saturated seconds | Saturation percentage |
|---|---|---|---|
| A | 5529 | 5524 | 99.909568% |
| B | 5529 | 507 | 9.169832% |
| C | 5529 | 60 | 1.085187% |
| D | 5529 | 181 | 3.273648% |
Noise dominated data is calculated using 1-second bins in cleaned event files. If a bin has >2000 counts, and if more than 50% of those come from <1% of pixels, then it is considered to be noise-dominated and hence unusable.
| Quadrant | # 1 sec bins | Bins with >0 counts | Bins with >2000 counts | High rate bins dominated by noise | Noise dominated (total time) | Noise dominated (detector-on time) | Marked lightcurve |
|---|---|---|---|---|---|---|---|
| A | 7141 | 5528 | 5444 | 5444 | 76.24% | 98.48% | 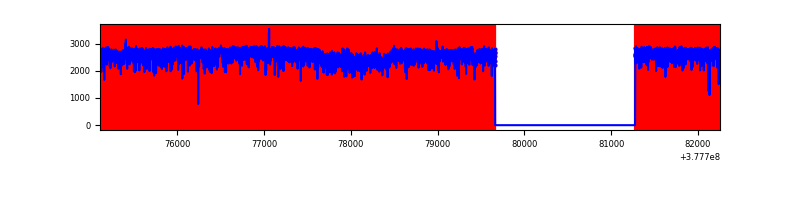 |
| B | 7142 | 5530 | 409 | 409 | 5.73% | 7.40% | 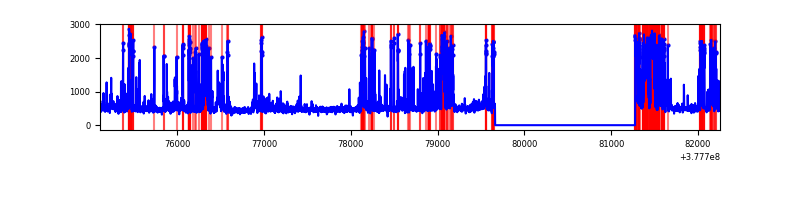 |
| C | 7142 | 5530 | 55 | 55 | 0.77% | 0.99% | 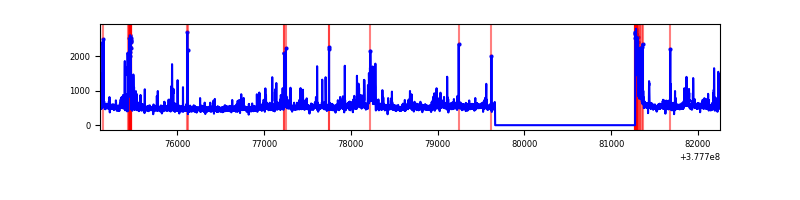 |
| D | 7142 | 5530 | 183 | 183 | 2.56% | 3.31% | 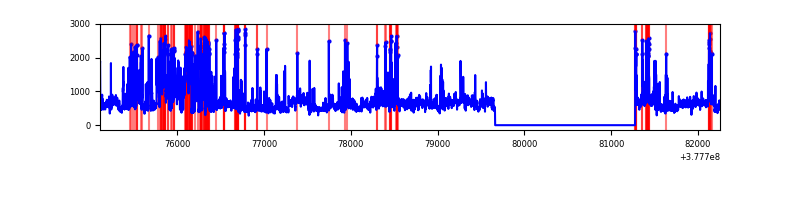 |
Top three noisy pixels from each quadrant. If the there are fewer than three noisy pixels in the level2.evt file, extra rows are filled as -1
| Pixel properties | Quadrant properties | ||||||
|---|---|---|---|---|---|---|---|
| Quadrant | DetID | PixID | Counts | Sigma | Mean | Median | Sigma |
| A | 15 | 169 | 12940839 | 263058.97 | 240 | 235 | 49.2 |
| A | 15 | 237 | 169764 | 3446.22 | 240 | 235 | 49.2 |
| A | 14 | 4 | 139722 | 2835.52 | 240 | 235 | 49.2 |
| B | 5 | 172 | 1418488 | 11892.35 | 621 | 605 | 119.2 |
| B | 0 | 213 | 64636 | 537.05 | 621 | 605 | 119.2 |
| B | 4 | 251 | 54014 | 447.96 | 621 | 605 | 119.2 |
| C | 3 | 233 | 375019 | 2560.0 | 630 | 636 | 146.2 |
| C | 15 | 214 | 237091 | 1616.86 | 630 | 636 | 146.2 |
| C | 0 | 10 | 130166 | 885.71 | 630 | 636 | 146.2 |
| D | 8 | 195 | 1146588 | 7320.49 | 630 | 610 | 156.5 |
| D | 13 | 249 | 223250 | 1422.22 | 630 | 610 | 156.5 |
| D | 15 | 0 | 120237 | 764.17 | 630 | 610 | 156.5 |
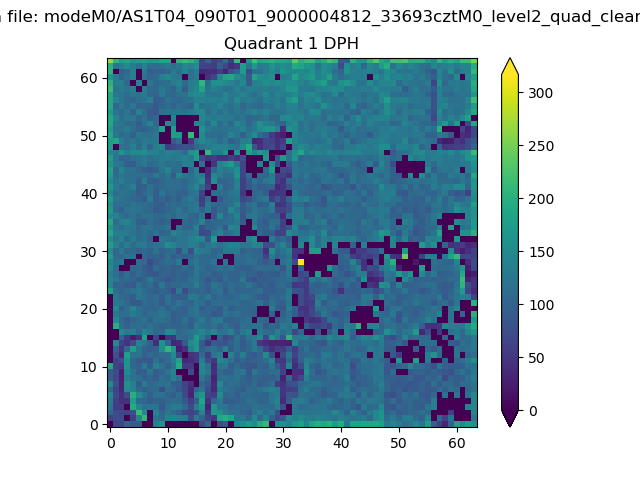
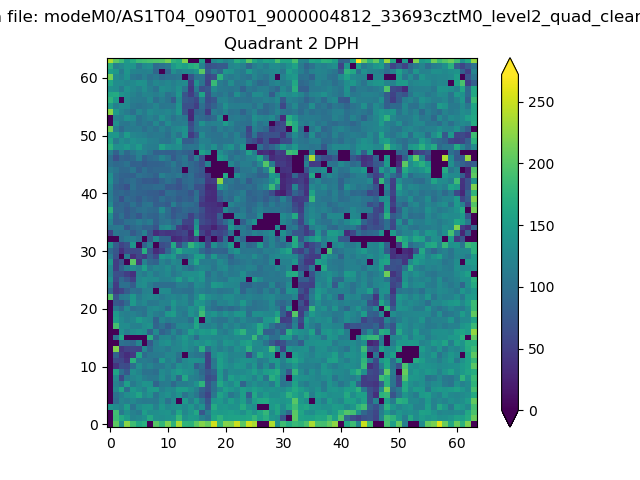
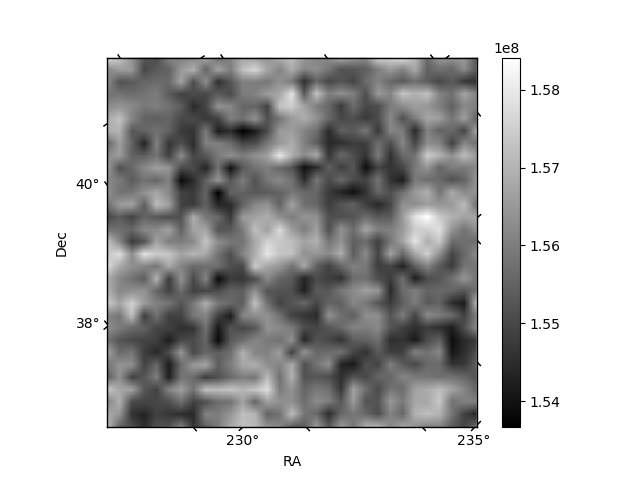
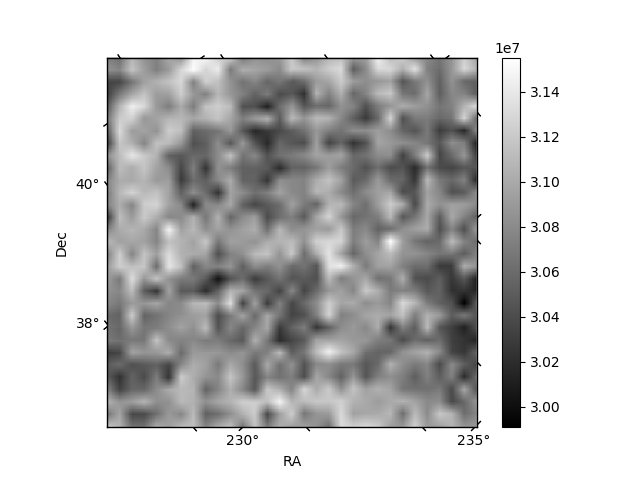
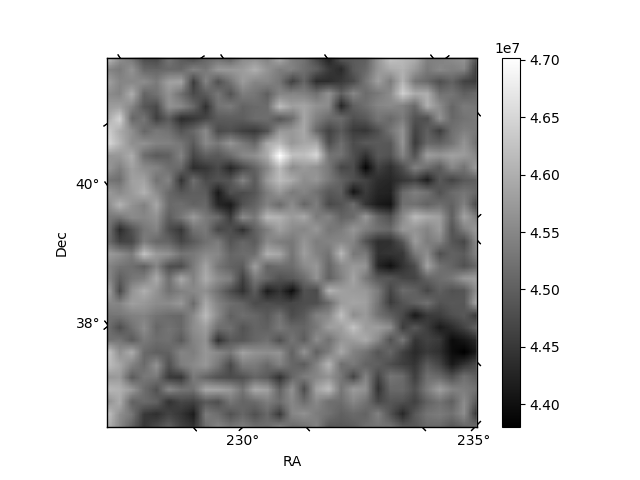
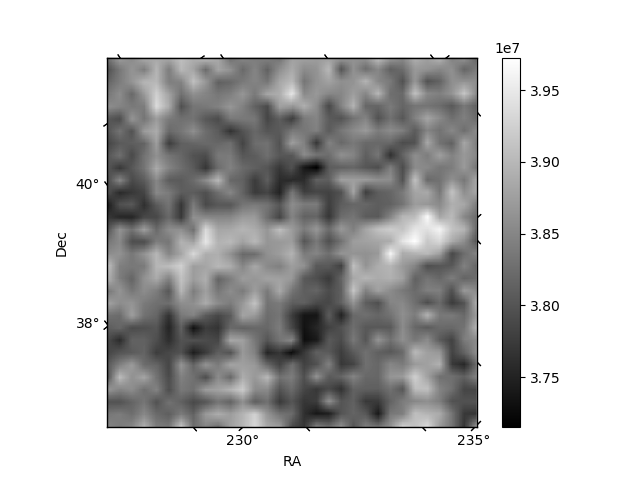
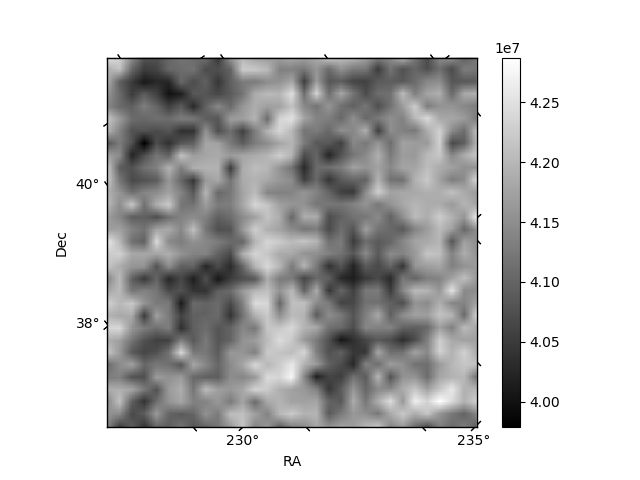
Histogram calculated using DETX and DETY for each event in the final _common_clean file
| Quadrant A |  |
 |
Quadrant B |
|---|---|---|---|
| Quadrant D | 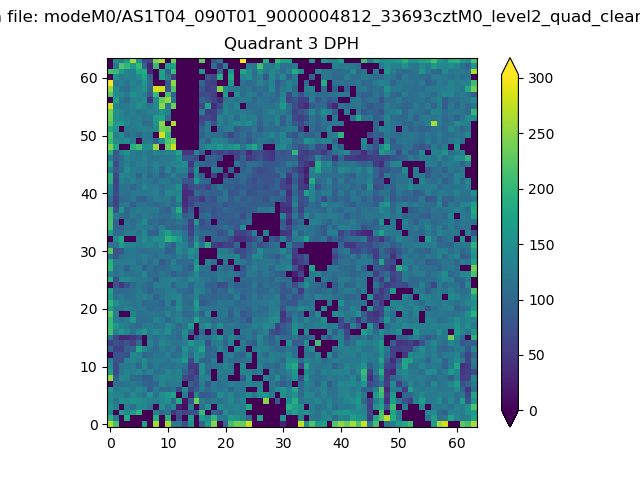 |
 |
Quadrant C |
| Plot type | Count rate plots | Images |
|---|---|---|
| Comparison with Poisson distribution Blue bars denote a histogram of data divided into 1 sec bins. Red curve is a Poisson curve with rate = median count rate of data. |
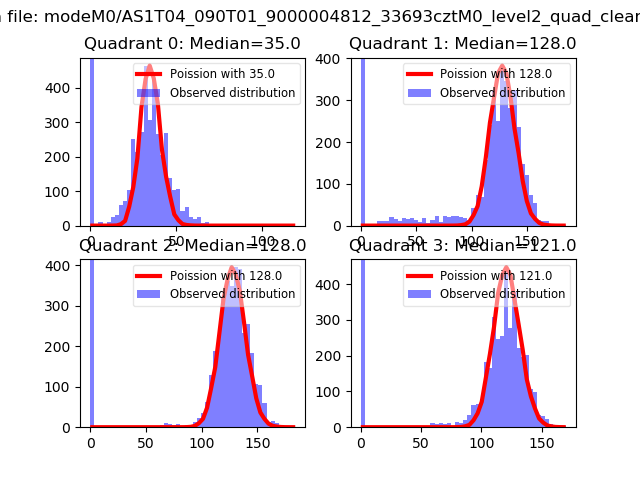 |
 |
| Quadrant-wise count rates Data is divided into 100 sec bins |
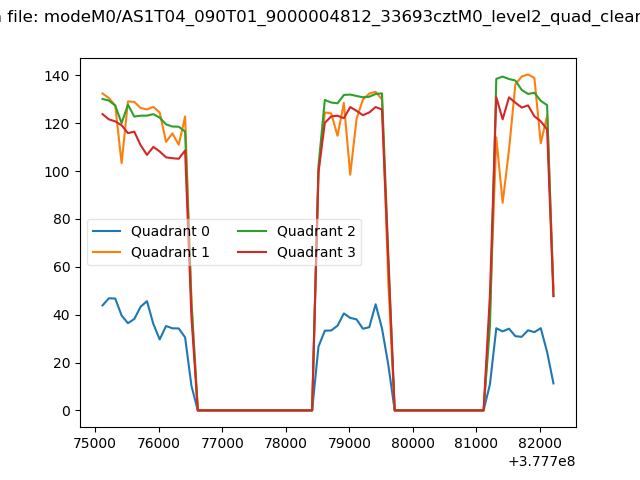 |
|
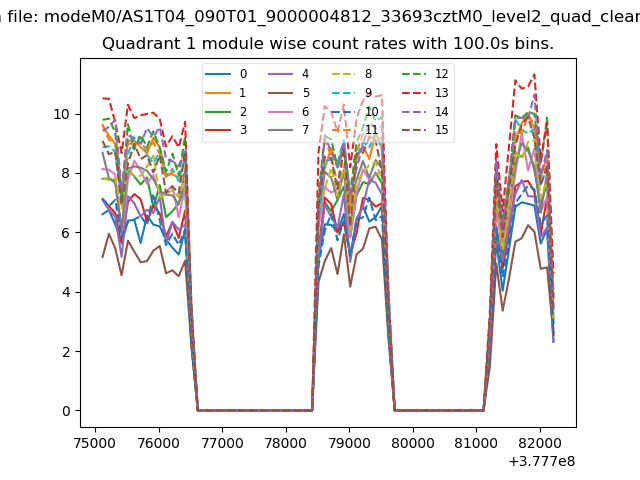
| Module-wise count rates for Quadrant A Data is divided into 100 sec bins |
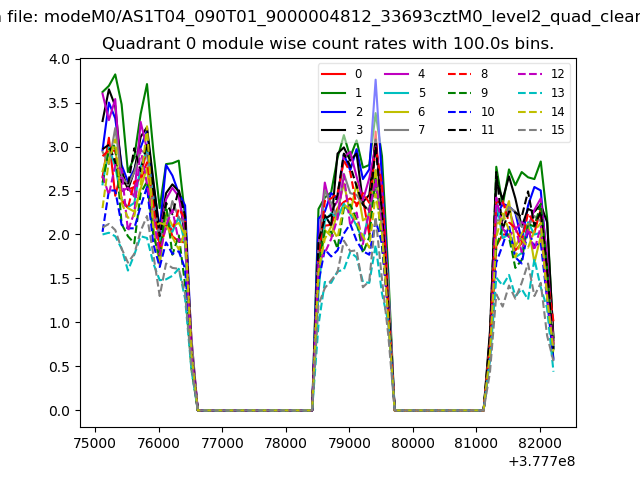 |
 |
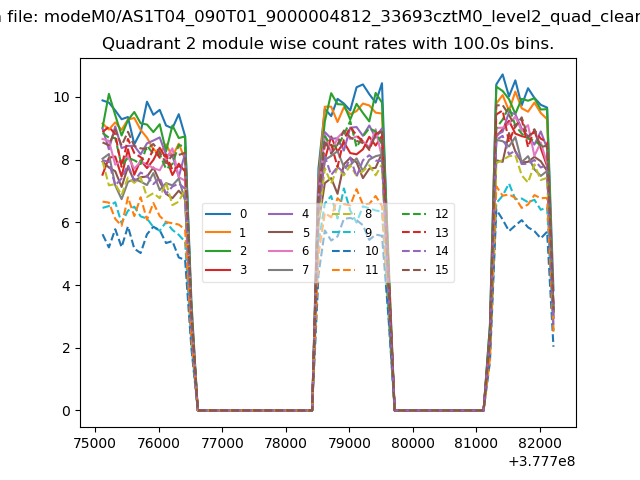
| Module-wise count rates for Quadrant B Data is divided into 100 sec bins |
 |
 |
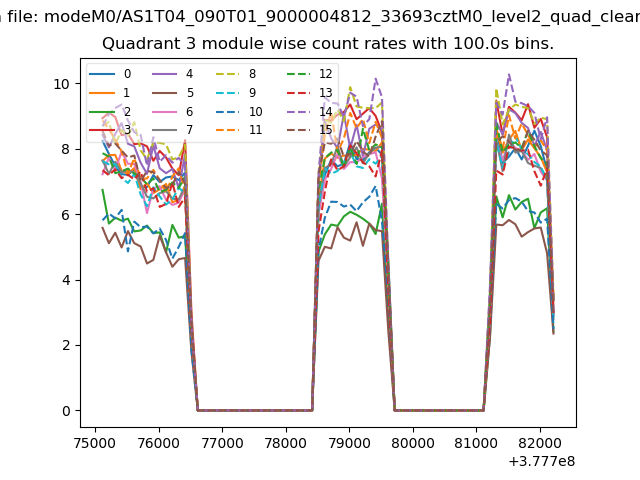
| Module-wise count rates for Quadrant C Data is divided into 100 sec bins |
 |
 |
| Module-wise count rates for Quadrant D Data is divided into 100 sec bins |
 |
 |
| Parameter | Plot |
|---|---|
| CZT HV Monitor | 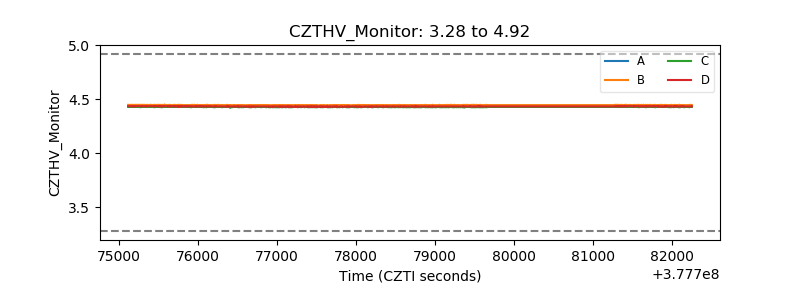 |
| D_VDD | 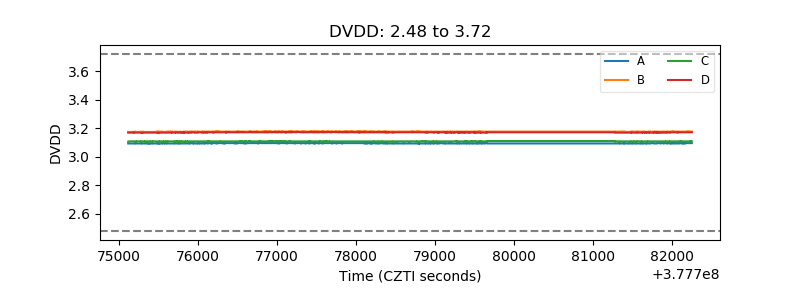 |
| Temperature 1 | 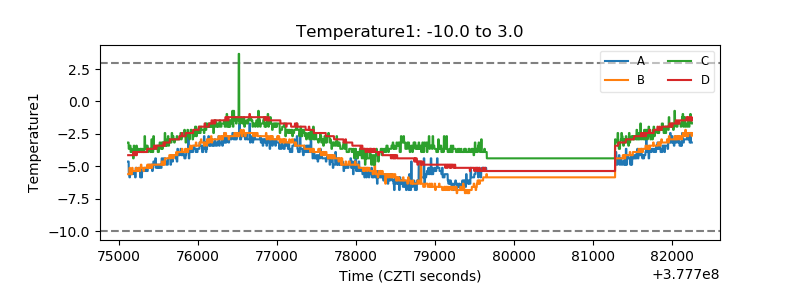 |
| Veto HV Monitor |  |
| Veto LLD | 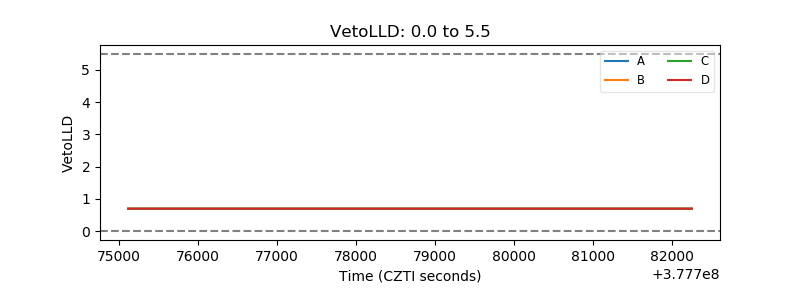 |
| Alpha Counter | 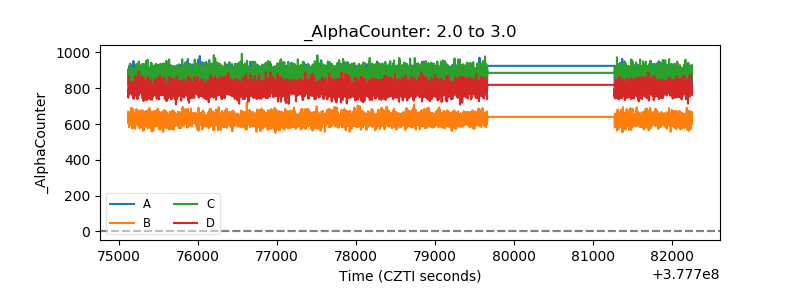 |
| _CPM_Rate | 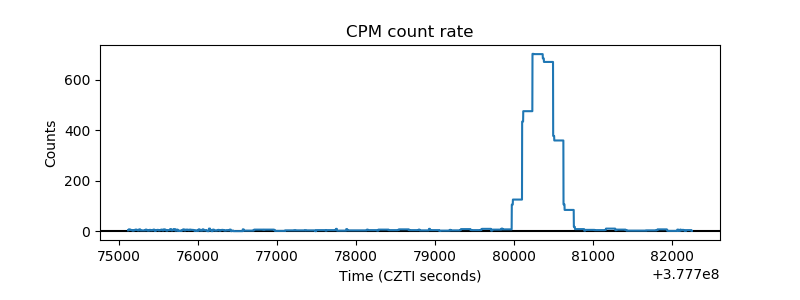 |
| CZT Counter | 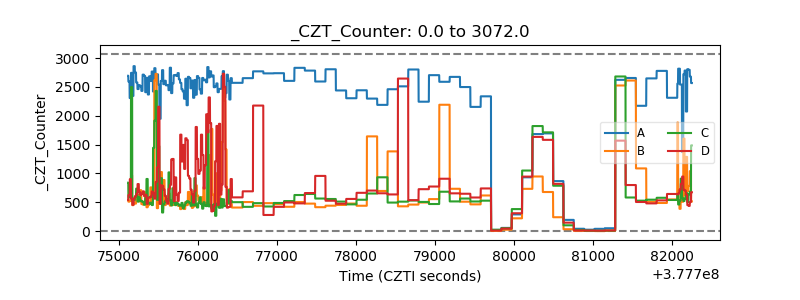 |
| +2.5 Volts monitor |  |
| +5 Volts monitor | 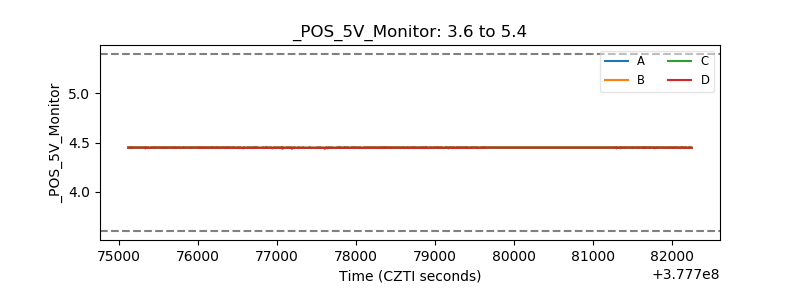 |
| _ROLL_ROT | 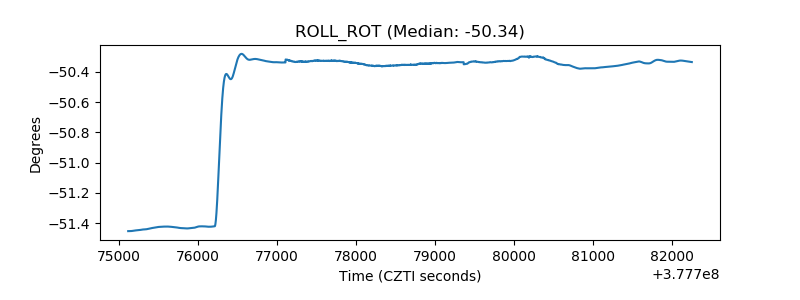 |
| _Roll_DEC | 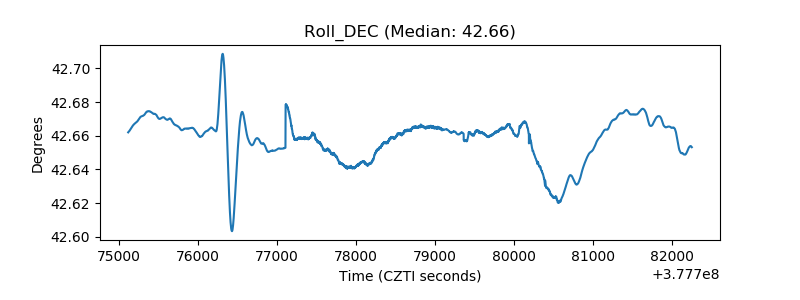 |
| _Roll_RA | 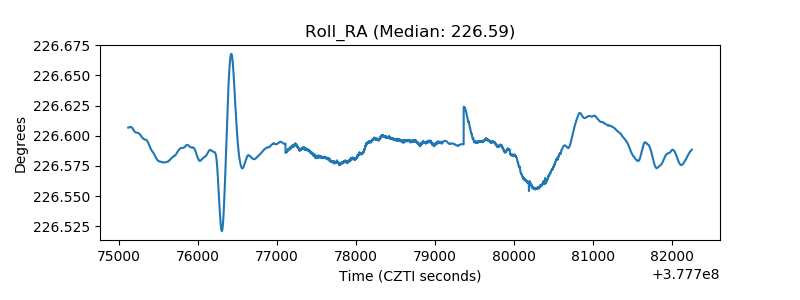 |
| Veto Counter | 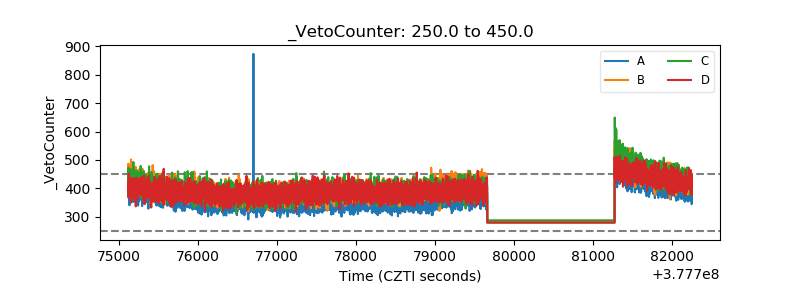 |