| Param | Original file | Final file |
|---|---|---|
| Filename | modeM0/AS1T04_090T01_9000004812_33695cztM0_level2.evt | modeM0/AS1T04_090T01_9000004812_33695cztM0_level2_quad_clean.evt |
| Size (bytes) | 850,222,080 | 57,718,080 |
| Size | 810.8 MB | 55.0 MB |
| Events in quadrant A | 13,951,568 | 113,750 |
| Events in quadrant B | 4,163,385 | 420,213 |
| Events in quadrant C | 3,183,798 | 436,146 |
| Events in quadrant D | 4,090,730 | 402,282 |
| Mode M9 | |||
|---|---|---|---|
| Quadrant | BADHDUFLAG | Total packets | Discarded packets |
| A | 0 | 20 | 0 |
| B | 0 | 20 | 0 |
| C | 0 | 20 | 0 |
| D | 0 | 21 | 0 |
| Mode M0 | |||
|---|---|---|---|
| Quadrant | BADHDUFLAG | Total packets | Discarded packets |
| A | 0 | 45244 | 3 |
| B | 0 | 15732 | 2 |
| C | 0 | 12538 | 2 |
| D | 0 | 16062 | 2 |
| Mode SS | |||
|---|---|---|---|
| Quadrant | BADHDUFLAG | Total packets | Discarded packets |
| A | 0 | 108 | 0 |
| B | 0 | 108 | 0 |
| C | 0 | 108 | 0 |
| D | 0 | 108 | 0 |
| Quadrant | Total seconds | Saturated seconds | Saturation percentage |
|---|---|---|---|
| A | 5332 | 5332 | 100.000000% |
| B | 5332 | 557 | 10.446362% |
| C | 5332 | 66 | 1.237809% |
| D | 5332 | 298 | 5.588897% |
Noise dominated data is calculated using 1-second bins in cleaned event files. If a bin has >2000 counts, and if more than 50% of those come from <1% of pixels, then it is considered to be noise-dominated and hence unusable.
| Quadrant | # 1 sec bins | Bins with >0 counts | Bins with >2000 counts | High rate bins dominated by noise | Noise dominated (total time) | Noise dominated (detector-on time) | Marked lightcurve |
|---|---|---|---|---|---|---|---|
| A | 7065 | 5331 | 5262 | 5262 | 74.48% | 98.71% | 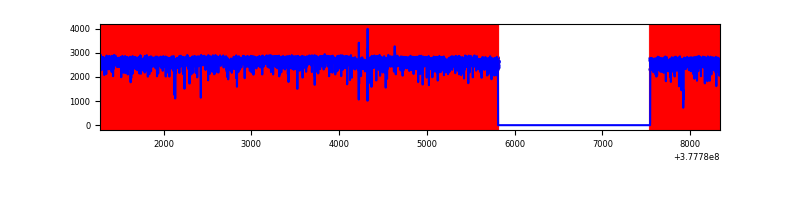 |
| B | 7066 | 5333 | 462 | 462 | 6.54% | 8.66% | 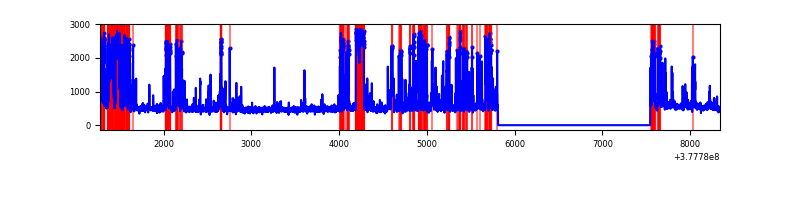 |
| C | 7066 | 5333 | 60 | 60 | 0.85% | 1.13% | 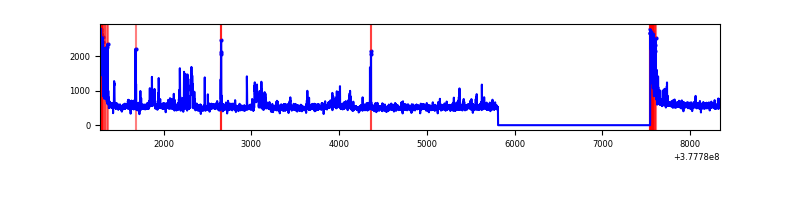 |
| D | 7066 | 5333 | 274 | 274 | 3.88% | 5.14% | 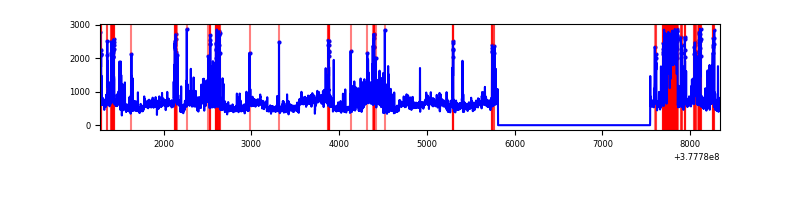 |
Top three noisy pixels from each quadrant. If the there are fewer than three noisy pixels in the level2.evt file, extra rows are filled as -1
| Pixel properties | Quadrant properties | ||||||
|---|---|---|---|---|---|---|---|
| Quadrant | DetID | PixID | Counts | Sigma | Mean | Median | Sigma |
| A | 15 | 169 | 12803594 | 296202.96 | 210 | 207 | 43.2 |
| A | 15 | 237 | 173133 | 4000.6 | 210 | 207 | 43.2 |
| A | 14 | 4 | 152605 | 3525.69 | 210 | 207 | 43.2 |
| B | 5 | 172 | 1340192 | 11467.35 | 608 | 595 | 116.8 |
| B | 4 | 170 | 299815 | 2561.41 | 608 | 595 | 116.8 |
| B | 15 | 85 | 57681 | 488.67 | 608 | 595 | 116.8 |
| C | 3 | 233 | 308976 | 2142.69 | 622 | 628 | 143.9 |
| C | 15 | 214 | 229172 | 1588.14 | 622 | 628 | 143.9 |
| C | 0 | 10 | 193577 | 1340.79 | 622 | 628 | 143.9 |
| D | 8 | 195 | 655990 | 4330.5 | 614 | 596 | 151.3 |
| D | 8 | 230 | 365193 | 2409.07 | 614 | 596 | 151.3 |
| D | 13 | 249 | 243439 | 1604.58 | 614 | 596 | 151.3 |
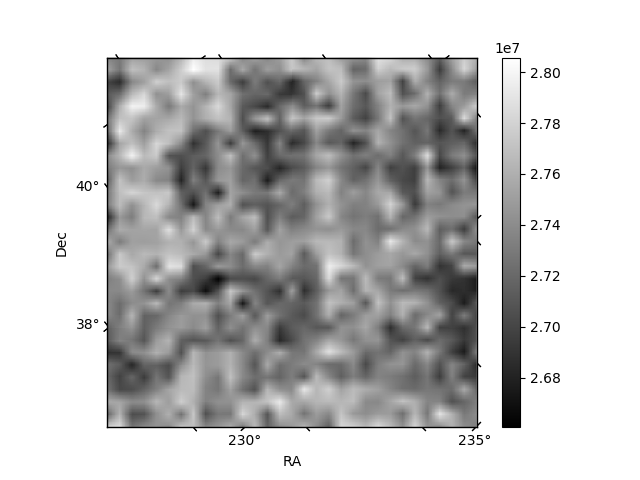
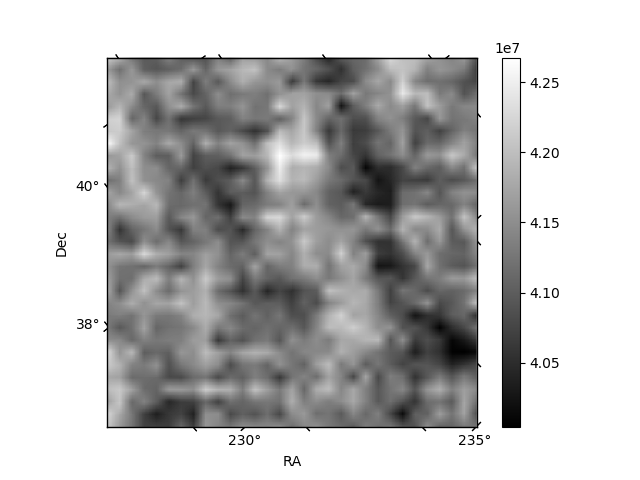
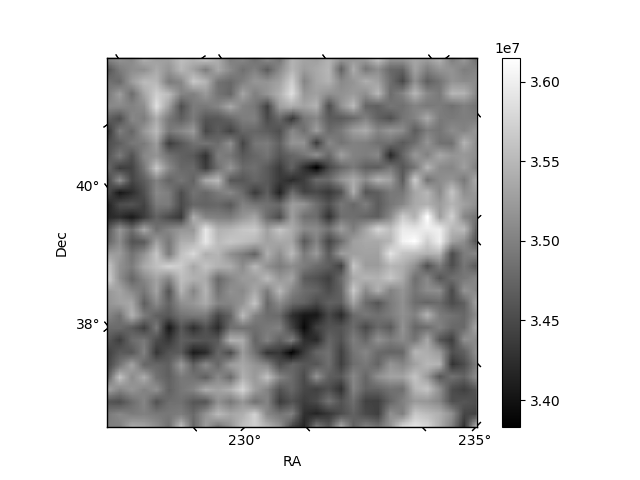
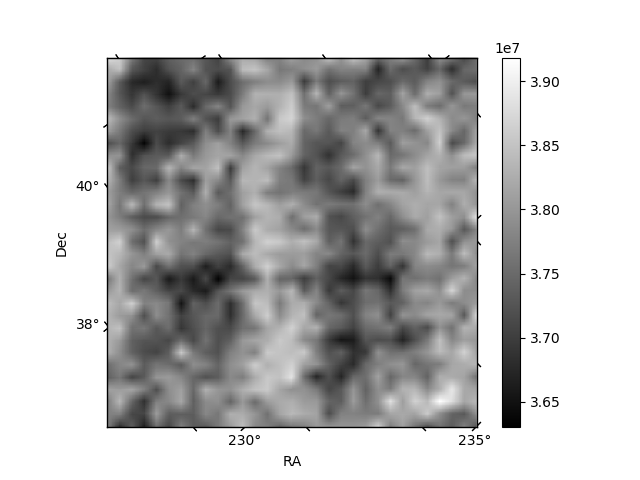
Histogram calculated using DETX and DETY for each event in the final _common_clean file
| Quadrant A |  |
 |
Quadrant B |
|---|---|---|---|
| Quadrant D |  |
 |
Quadrant C |
| Plot type | Count rate plots | Images |
|---|---|---|
| Comparison with Poisson distribution Blue bars denote a histogram of data divided into 1 sec bins. Red curve is a Poisson curve with rate = median count rate of data. |
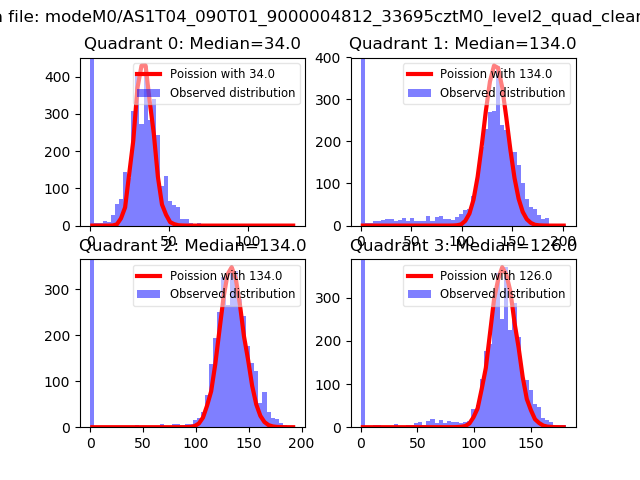 |
 |
| Quadrant-wise count rates Data is divided into 100 sec bins |
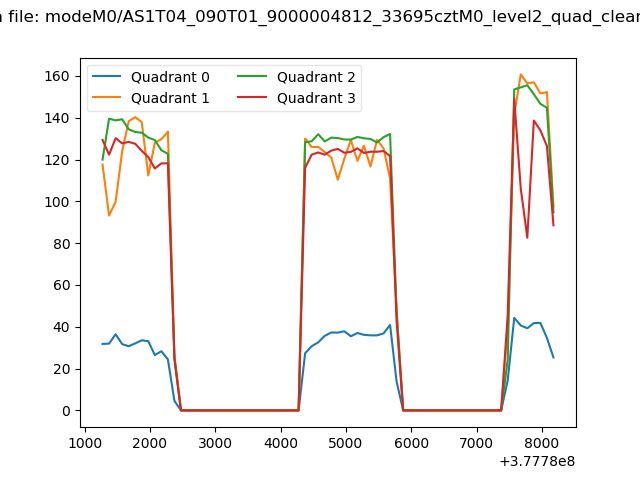 |
|
| Module-wise count rates for Quadrant A Data is divided into 100 sec bins |
 |
 |
| Module-wise count rates for Quadrant B Data is divided into 100 sec bins |
 |
 |
| Module-wise count rates for Quadrant C Data is divided into 100 sec bins |
 |
 |
| Module-wise count rates for Quadrant D Data is divided into 100 sec bins |
 |
 |
| Parameter | Plot |
|---|---|
| CZT HV Monitor |  |
| D_VDD | 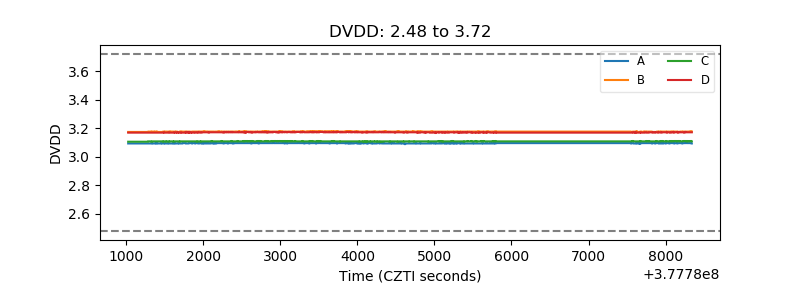 |
| Temperature 1 |  |
| Veto HV Monitor |  |
| Veto LLD |  |
| Alpha Counter |  |
| _CPM_Rate | 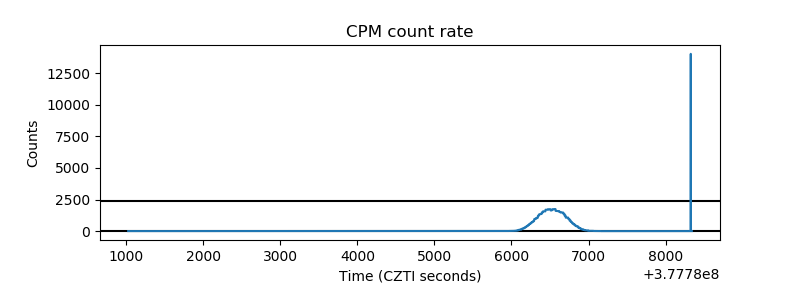 |
| CZT Counter |  |
| +2.5 Volts monitor |  |
| +5 Volts monitor |  |
| _ROLL_ROT |  |
| _Roll_DEC |  |
| _Roll_RA |  |
| Veto Counter |  |