| Param | Original file | Final file |
|---|---|---|
| Filename | modeM0/AS1T04_090T01_9000004812_33697cztM0_level2.evt | modeM0/AS1T04_090T01_9000004812_33697cztM0_level2_quad_clean.evt |
| Size (bytes) | 849,130,560 | 47,355,840 |
| Size | 809.8 MB | 45.2 MB |
| Events in quadrant A | 14,271,058 | 89,266 |
| Events in quadrant B | 3,653,315 | 321,542 |
| Events in quadrant C | 3,449,108 | 330,267 |
| Events in quadrant D | 3,980,032 | 314,889 |
| Mode M9 | |||
|---|---|---|---|
| Quadrant | BADHDUFLAG | Total packets | Discarded packets |
| A | 0 | 21 | 0 |
| B | 0 | 21 | 0 |
| C | 0 | 21 | 0 |
| D | 0 | 22 | 0 |
| Mode M0 | |||
|---|---|---|---|
| Quadrant | BADHDUFLAG | Total packets | Discarded packets |
| A | 0 | 46175 | 3 |
| B | 0 | 14247 | 2 |
| C | 0 | 13763 | 2 |
| D | 0 | 15711 | 2 |
| Mode SS | |||
|---|---|---|---|
| Quadrant | BADHDUFLAG | Total packets | Discarded packets |
| A | 0 | 110 | 0 |
| B | 0 | 110 | 0 |
| C | 0 | 110 | 0 |
| D | 0 | 110 | 0 |
| Quadrant | Total seconds | Saturated seconds | Saturation percentage |
|---|---|---|---|
| A | 5371 | 5371 | 100.000000% |
| B | 5371 | 273 | 5.082852% |
| C | 5371 | 95 | 1.768758% |
| D | 5371 | 138 | 2.569354% |
Noise dominated data is calculated using 1-second bins in cleaned event files. If a bin has >2000 counts, and if more than 50% of those come from <1% of pixels, then it is considered to be noise-dominated and hence unusable.
| Quadrant | # 1 sec bins | Bins with >0 counts | Bins with >2000 counts | High rate bins dominated by noise | Noise dominated (total time) | Noise dominated (detector-on time) | Marked lightcurve |
|---|---|---|---|---|---|---|---|
| A | 7372 | 5370 | 5322 | 5322 | 72.19% | 99.11% | 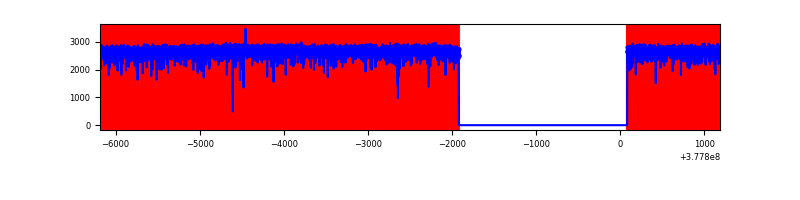 |
| B | 7373 | 5372 | 221 | 221 | 3.00% | 4.11% | 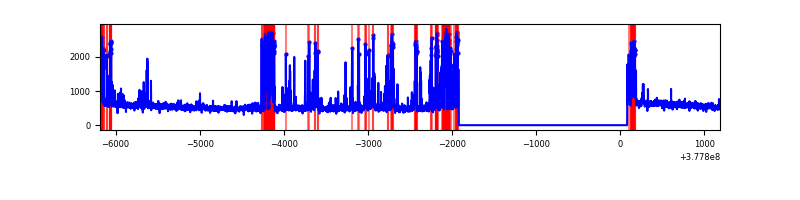 |
| C | 7373 | 5372 | 81 | 81 | 1.10% | 1.51% | 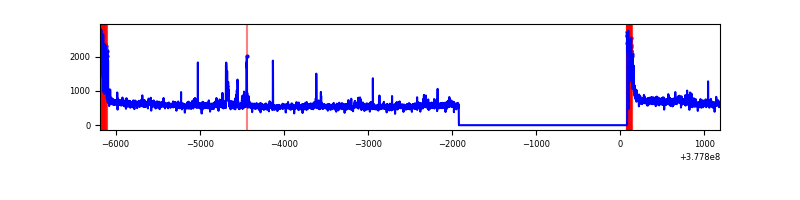 |
| D | 7373 | 5372 | 115 | 115 | 1.56% | 2.14% | 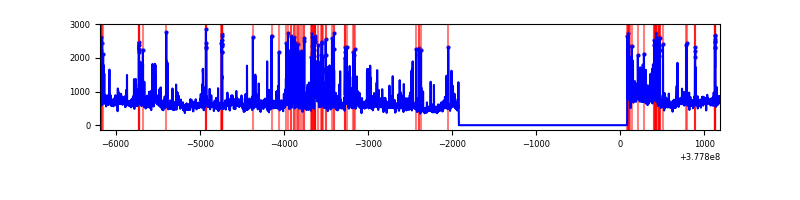 |
Top three noisy pixels from each quadrant. If the there are fewer than three noisy pixels in the level2.evt file, extra rows are filled as -1
| Pixel properties | Quadrant properties | ||||||
|---|---|---|---|---|---|---|---|
| Quadrant | DetID | PixID | Counts | Sigma | Mean | Median | Sigma |
| A | 15 | 169 | 12897093 | 266511.41 | 242 | 238 | 48.4 |
| A | 15 | 237 | 347336 | 7172.72 | 242 | 238 | 48.4 |
| A | 14 | 4 | 81793 | 1685.32 | 242 | 238 | 48.4 |
| B | 5 | 172 | 814911 | 6309.43 | 692 | 677 | 129.1 |
| B | 15 | 85 | 65273 | 500.55 | 692 | 677 | 129.1 |
| B | 0 | 213 | 26513 | 200.2 | 692 | 677 | 129.1 |
| C | 0 | 10 | 248275 | 1569.33 | 695 | 703 | 157.8 |
| C | 3 | 233 | 239351 | 1512.76 | 695 | 703 | 157.8 |
| C | 15 | 214 | 230752 | 1458.25 | 695 | 703 | 157.8 |
| D | 8 | 195 | 446093 | 2420.35 | 691 | 679 | 184.0 |
| D | 2 | 249 | 323266 | 1752.91 | 691 | 679 | 184.0 |
| D | 2 | 250 | 179468 | 971.53 | 691 | 679 | 184.0 |
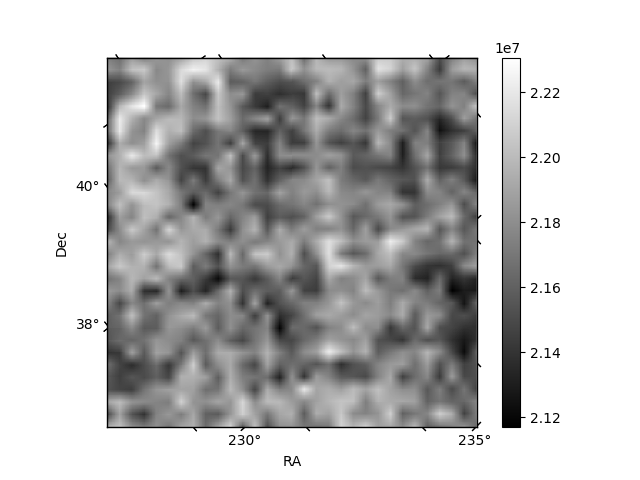
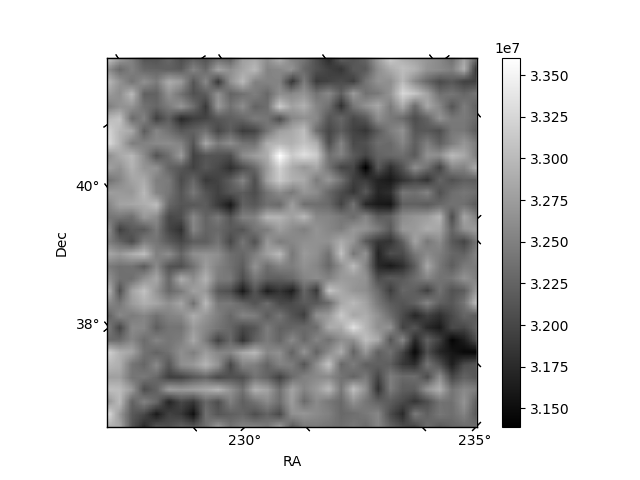
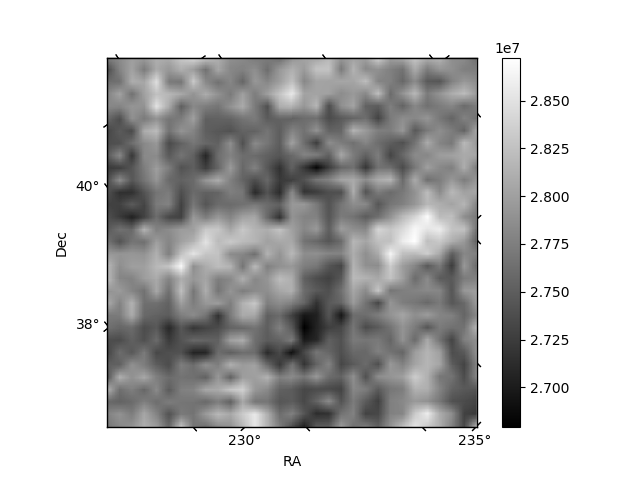
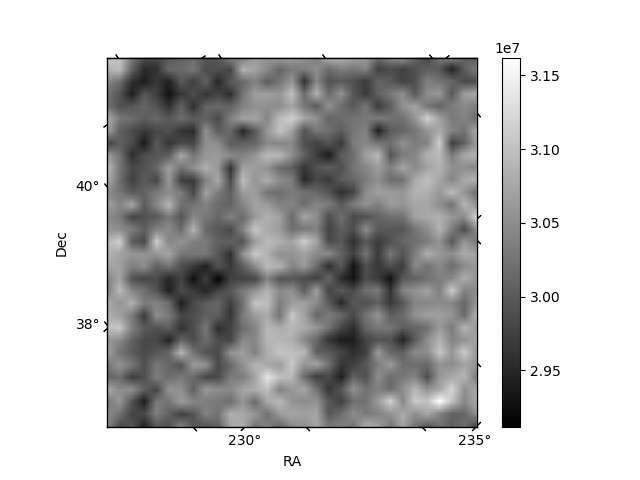
Histogram calculated using DETX and DETY for each event in the final _common_clean file
| Quadrant A |  |
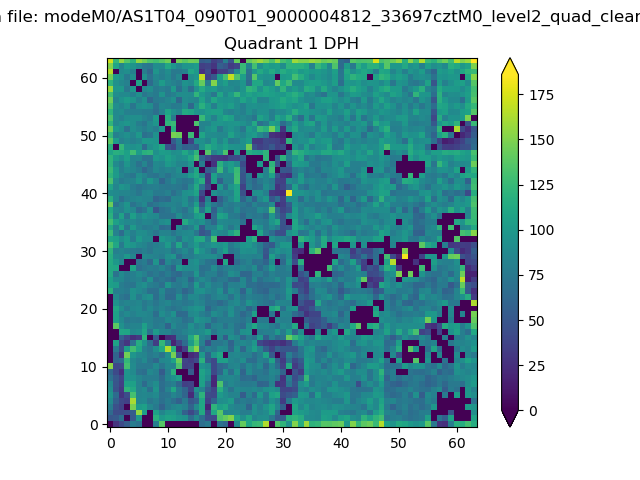 |
Quadrant B |
|---|---|---|---|
| Quadrant D | 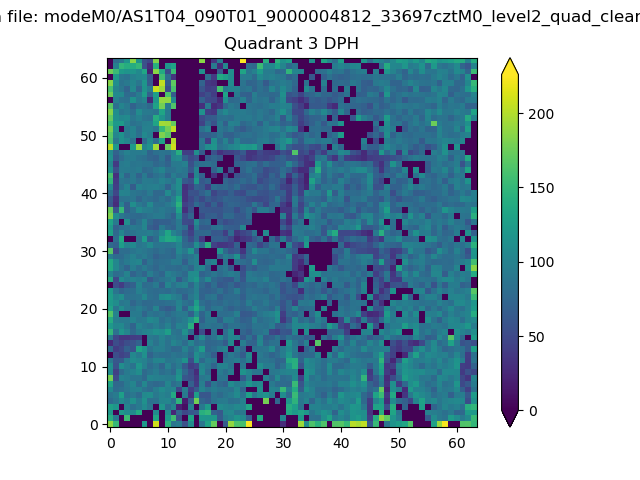 |
 |
Quadrant C |
| Plot type | Count rate plots | Images |
|---|---|---|
| Comparison with Poisson distribution Blue bars denote a histogram of data divided into 1 sec bins. Red curve is a Poisson curve with rate = median count rate of data. |
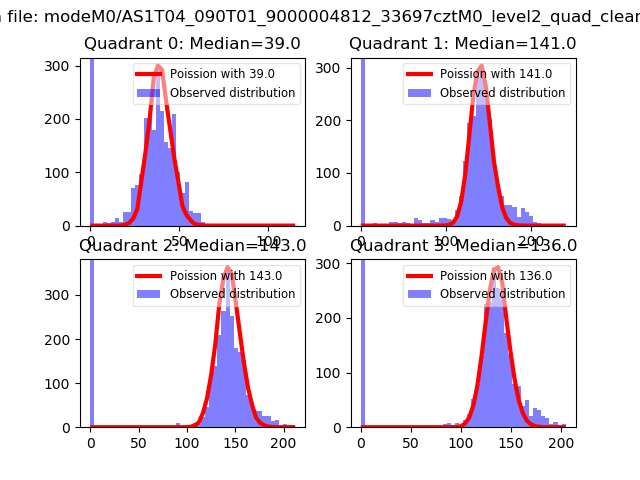 |
 |
| Quadrant-wise count rates Data is divided into 100 sec bins |
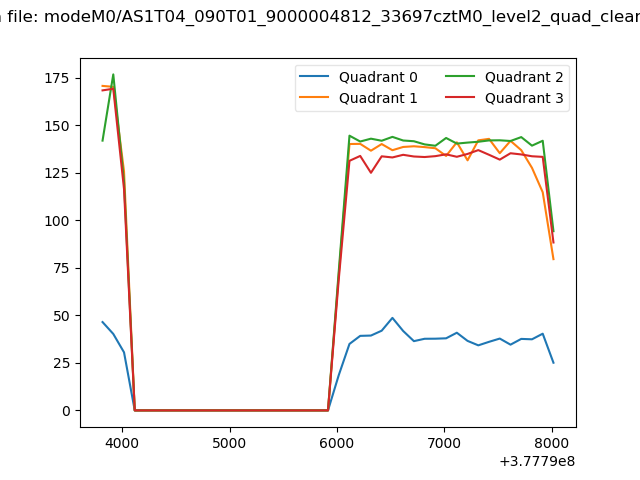 |
|
| Module-wise count rates for Quadrant A Data is divided into 100 sec bins |
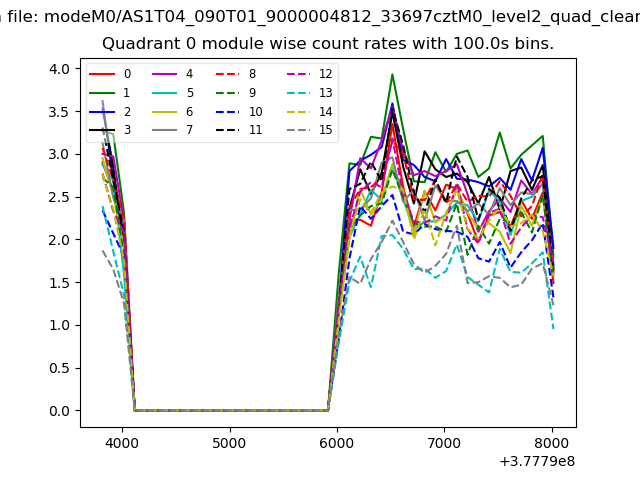 |
 |
| Module-wise count rates for Quadrant B Data is divided into 100 sec bins |
 |
 |
| Module-wise count rates for Quadrant C Data is divided into 100 sec bins |
 |
 |
| Module-wise count rates for Quadrant D Data is divided into 100 sec bins |
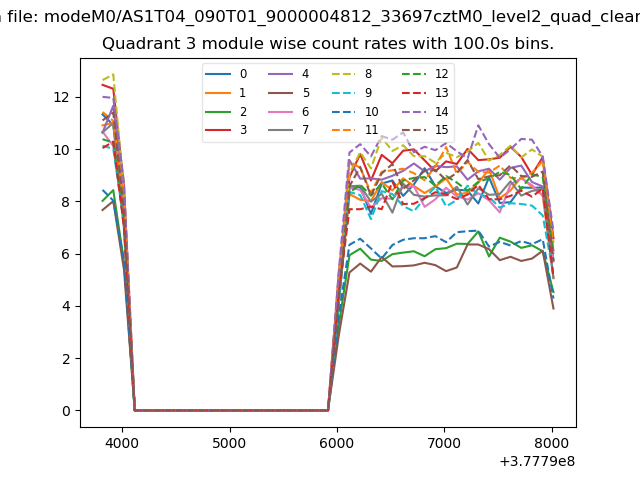 |
 |
| Parameter | Plot |
|---|---|
| CZT HV Monitor | 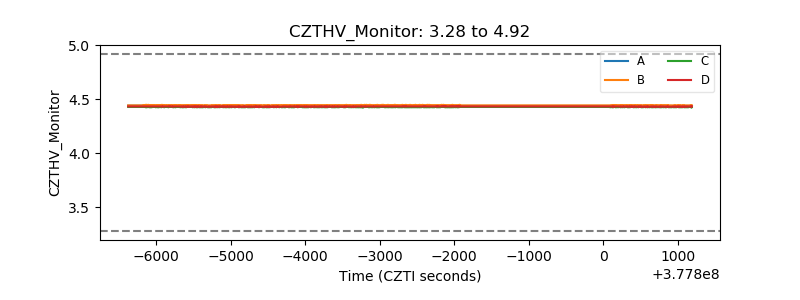 |
| D_VDD | 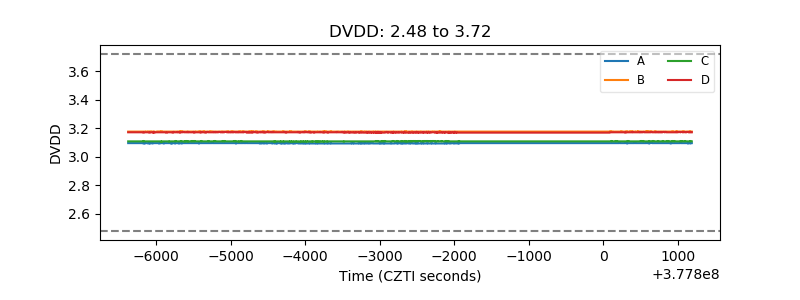 |
| Temperature 1 | 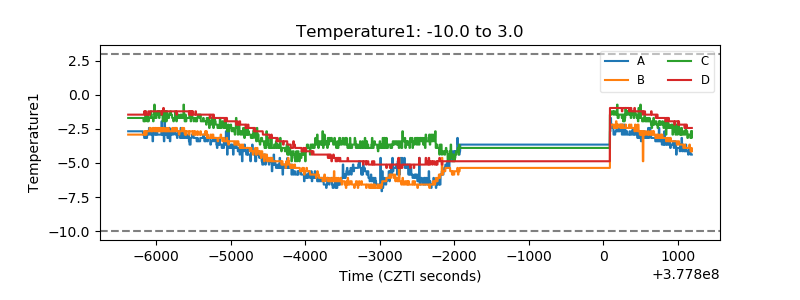 |
| Veto HV Monitor | 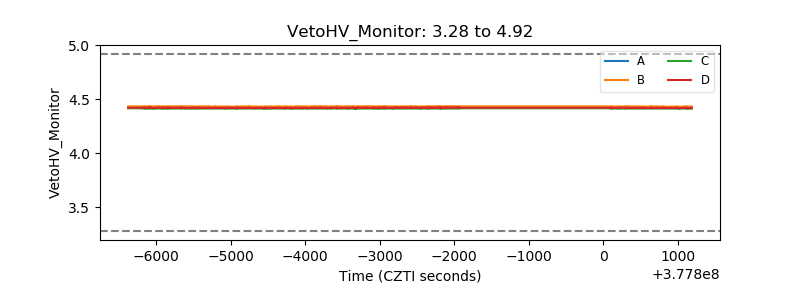 |
| Veto LLD | 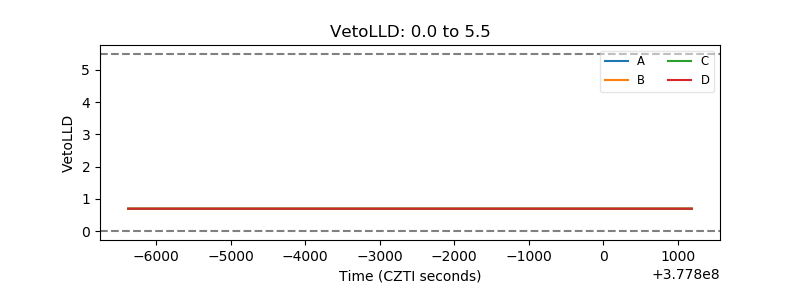 |
| Alpha Counter |  |
| _CPM_Rate | 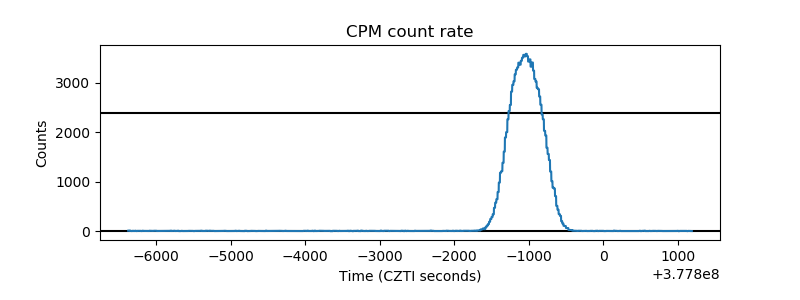 |
| CZT Counter | 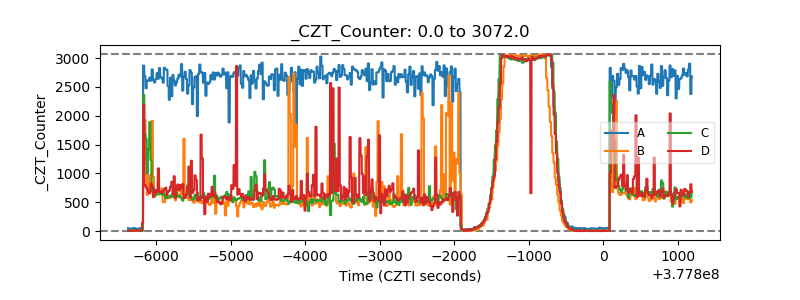 |
| +2.5 Volts monitor |  |
| +5 Volts monitor |  |
| _ROLL_ROT | 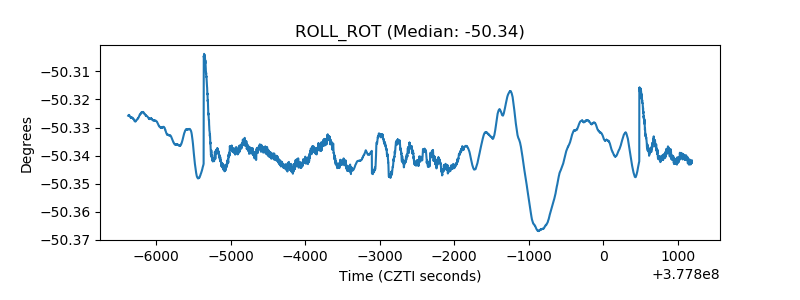 |
| _Roll_DEC | 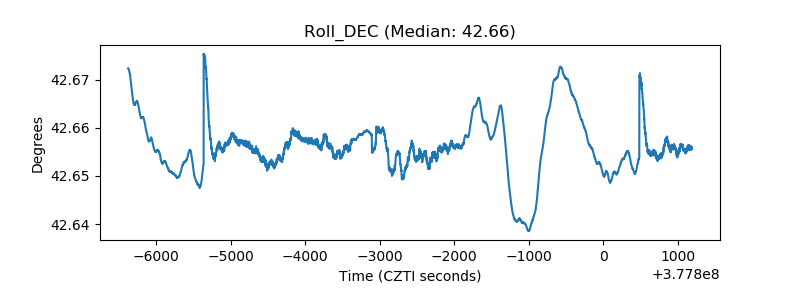 |
| _Roll_RA |  |
| Veto Counter | 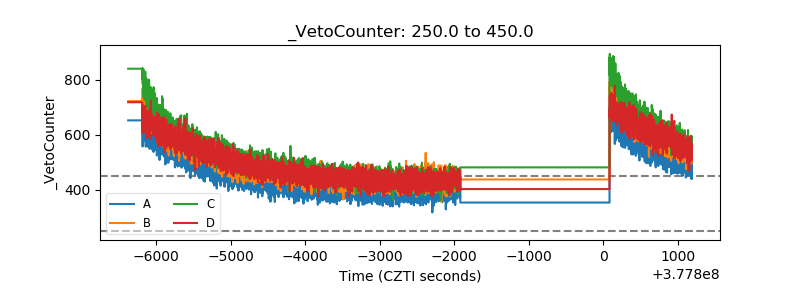 |