| Param | Original file | Final file |
|---|---|---|
| Filename | modeM0/AS1T04_090T01_9000004812_33698cztM0_level2.evt | modeM0/AS1T04_090T01_9000004812_33698cztM0_level2_quad_clean.evt |
| Size (bytes) | 741,049,920 | 50,189,760 |
| Size | 706.7 MB | 47.9 MB |
| Events in quadrant A | 11,057,963 | 176,525 |
| Events in quadrant B | 3,602,726 | 330,922 |
| Events in quadrant C | 3,130,649 | 347,617 |
| Events in quadrant D | 4,322,360 | 320,798 |
| Mode M9 | |||
|---|---|---|---|
| Quadrant | BADHDUFLAG | Total packets | Discarded packets |
| A | 0 | 21 | 0 |
| B | 0 | 21 | 0 |
| C | 0 | 21 | 0 |
| D | 0 | 21 | 0 |
| Mode M0 | |||
|---|---|---|---|
| Quadrant | BADHDUFLAG | Total packets | Discarded packets |
| A | 0 | 36254 | 2 |
| B | 0 | 13804 | 1 |
| C | 0 | 12553 | 1 |
| D | 0 | 16434 | 1 |
| Mode SS | |||
|---|---|---|---|
| Quadrant | BADHDUFLAG | Total packets | Discarded packets |
| A | 0 | 100 | 0 |
| B | 0 | 100 | 0 |
| C | 0 | 100 | 0 |
| D | 0 | 100 | 0 |
| Quadrant | Total seconds | Saturated seconds | Saturation percentage |
|---|---|---|---|
| A | 4882 | 3287 | 67.328964% |
| B | 4882 | 336 | 6.882425% |
| C | 4882 | 74 | 1.515772% |
| D | 4882 | 241 | 4.936501% |
Noise dominated data is calculated using 1-second bins in cleaned event files. If a bin has >2000 counts, and if more than 50% of those come from <1% of pixels, then it is considered to be noise-dominated and hence unusable.
| Quadrant | # 1 sec bins | Bins with >0 counts | Bins with >2000 counts | High rate bins dominated by noise | Noise dominated (total time) | Noise dominated (detector-on time) | Marked lightcurve |
|---|---|---|---|---|---|---|---|
| A | 6974 | 4881 | 3138 | 3138 | 45.00% | 64.29% | 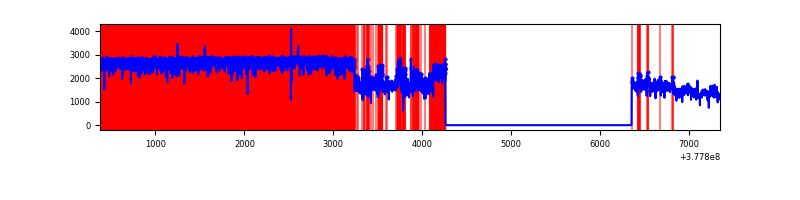 |
| B | 6973 | 4881 | 278 | 278 | 3.99% | 5.70% | 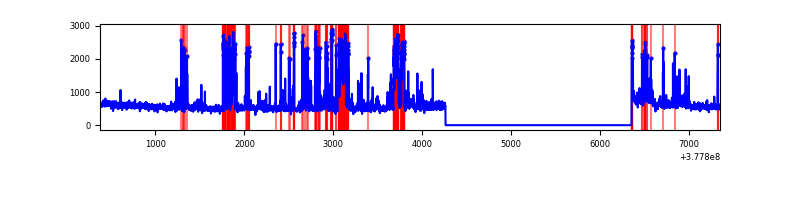 |
| C | 6974 | 4882 | 62 | 62 | 0.89% | 1.27% | 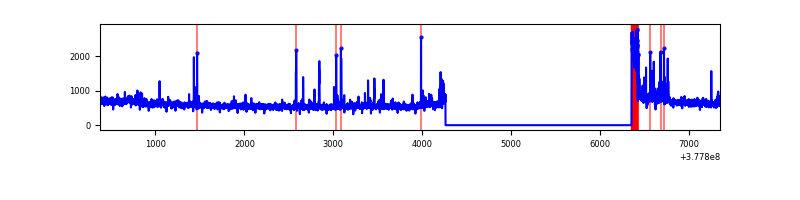 |
| D | 6974 | 4882 | 262 | 262 | 3.76% | 5.37% | 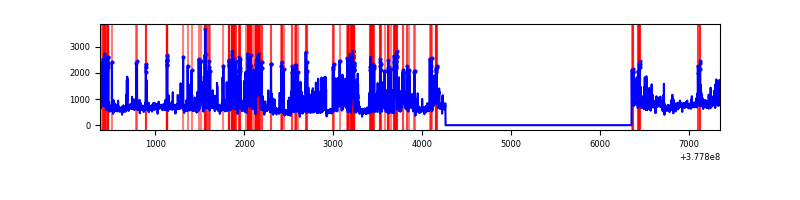 |
Top three noisy pixels from each quadrant. If the there are fewer than three noisy pixels in the level2.evt file, extra rows are filled as -1
| Pixel properties | Quadrant properties | ||||||
|---|---|---|---|---|---|---|---|
| Quadrant | DetID | PixID | Counts | Sigma | Mean | Median | Sigma |
| A | 15 | 169 | 9266788 | 120579.11 | 385 | 378 | 76.8 |
| A | 15 | 237 | 267099 | 3470.71 | 385 | 378 | 76.8 |
| A | 14 | 4 | 28616 | 367.45 | 385 | 378 | 76.8 |
| B | 5 | 172 | 889748 | 7619.91 | 629 | 614 | 116.7 |
| B | 15 | 85 | 100322 | 854.5 | 629 | 614 | 116.7 |
| B | 5 | 255 | 64589 | 548.27 | 629 | 614 | 116.7 |
| C | 3 | 233 | 288375 | 1984.98 | 636 | 644 | 145.0 |
| C | 15 | 214 | 211062 | 1451.62 | 636 | 644 | 145.0 |
| C | 0 | 10 | 128279 | 880.52 | 636 | 644 | 145.0 |
| D | 2 | 250 | 496599 | 2965.09 | 623 | 613 | 167.3 |
| D | 8 | 195 | 488518 | 2916.78 | 623 | 613 | 167.3 |
| D | 8 | 230 | 384928 | 2297.5 | 623 | 613 | 167.3 |
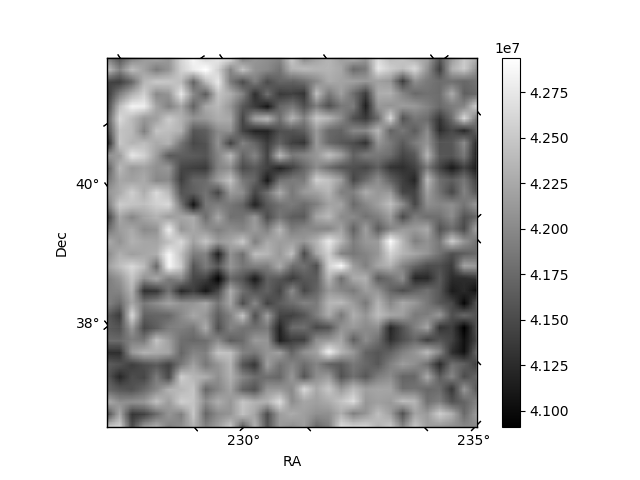
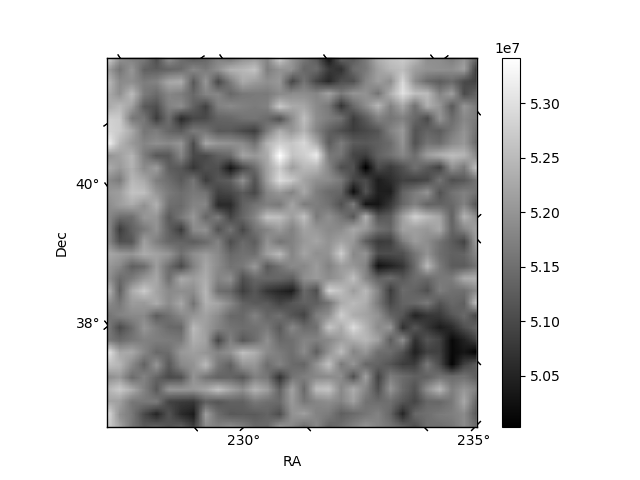
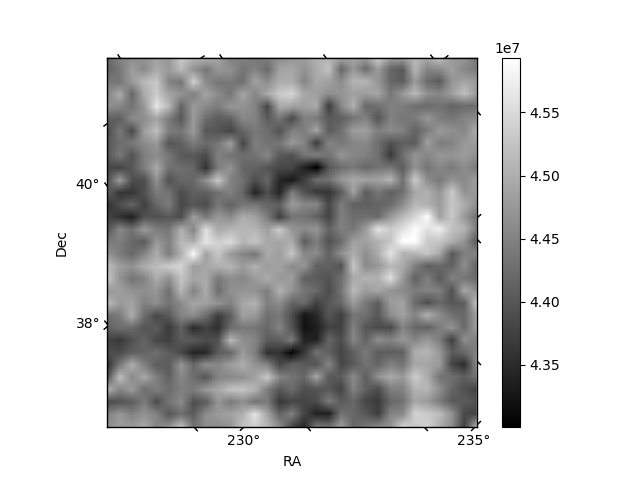
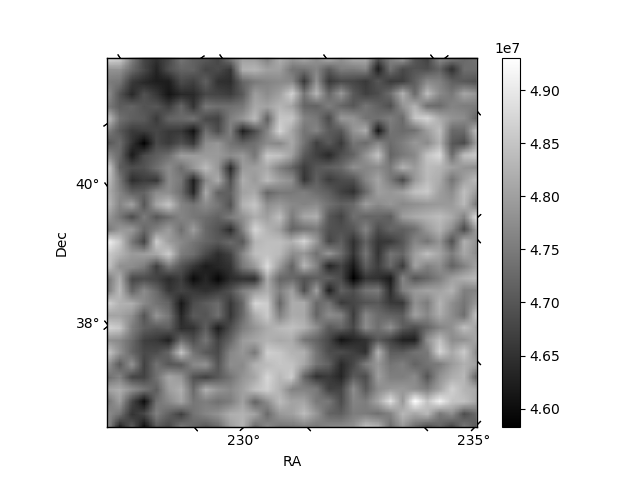
Histogram calculated using DETX and DETY for each event in the final _common_clean file
| Quadrant A | 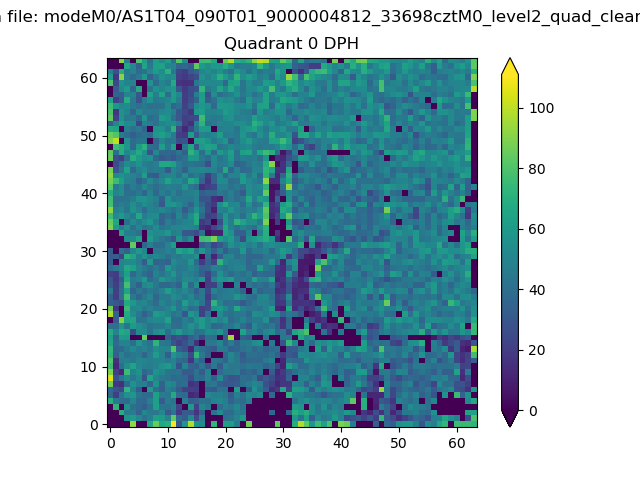 |
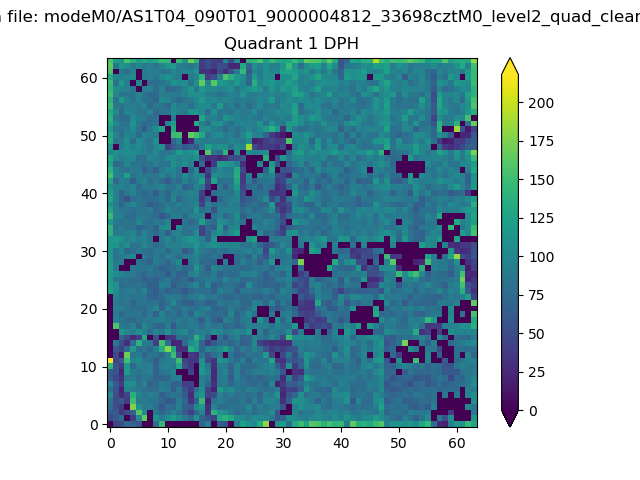 |
Quadrant B |
|---|---|---|---|
| Quadrant D | 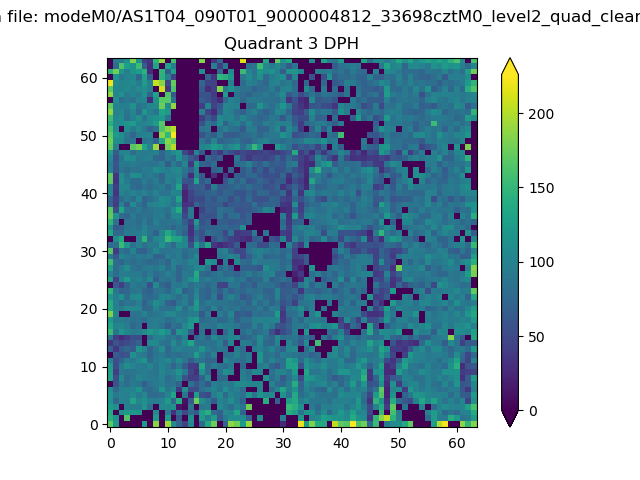 |
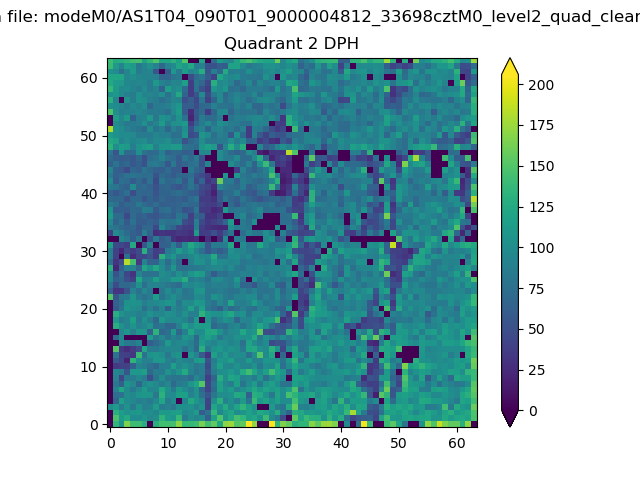 |
Quadrant C |
| Plot type | Count rate plots | Images |
|---|---|---|
| Comparison with Poisson distribution Blue bars denote a histogram of data divided into 1 sec bins. Red curve is a Poisson curve with rate = median count rate of data. |
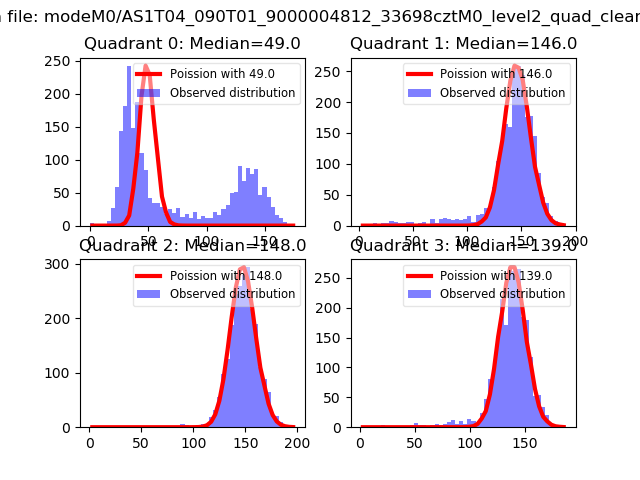 |
 |
| Quadrant-wise count rates Data is divided into 100 sec bins |
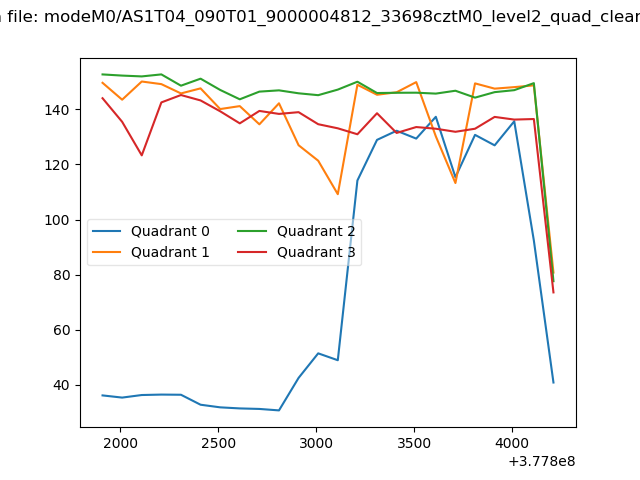 |
|
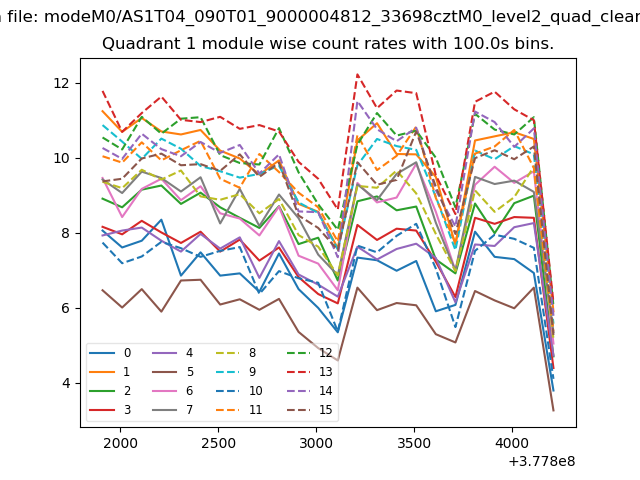
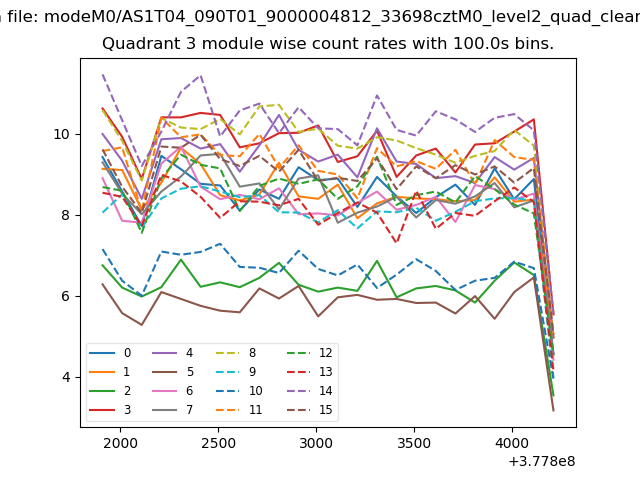
| Module-wise count rates for Quadrant A Data is divided into 100 sec bins |
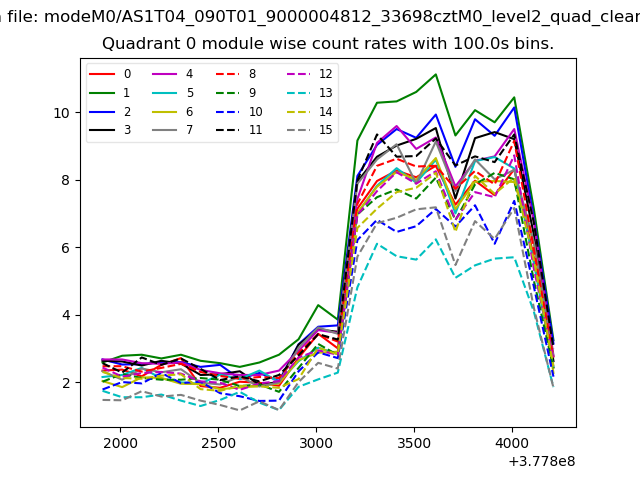 |
 |
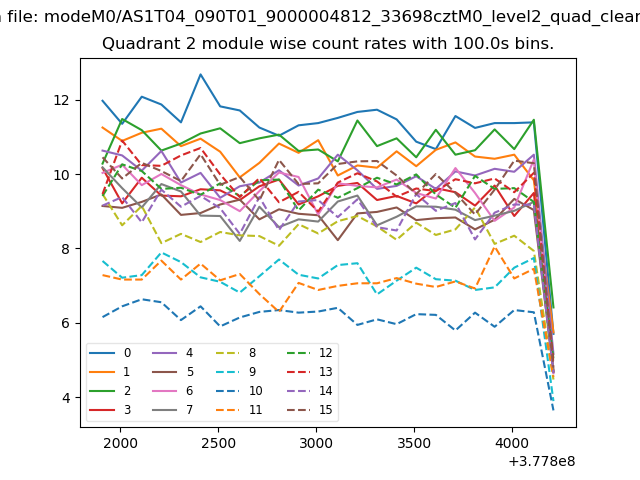
| Module-wise count rates for Quadrant B Data is divided into 100 sec bins |
 |
 |
| Module-wise count rates for Quadrant C Data is divided into 100 sec bins |
 |
 |
| Module-wise count rates for Quadrant D Data is divided into 100 sec bins |
 |
 |
| Parameter | Plot |
|---|---|
| CZT HV Monitor | 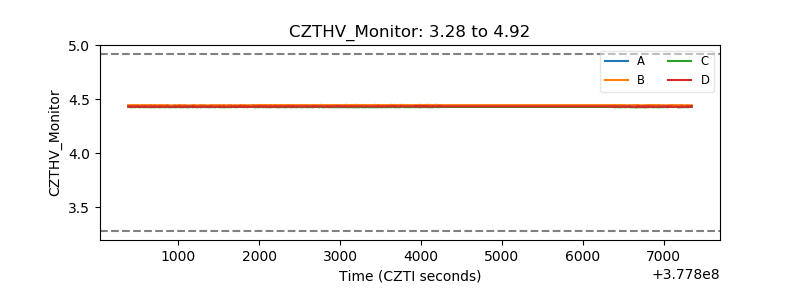 |
| D_VDD | 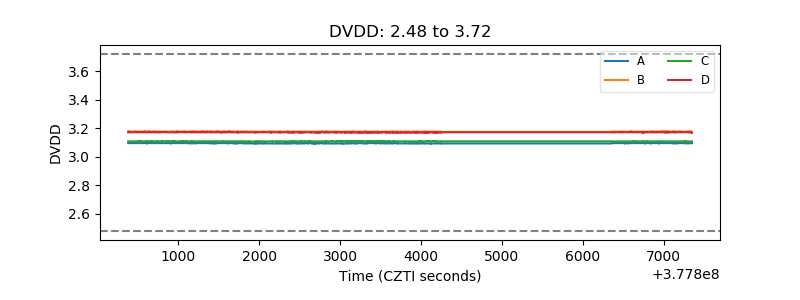 |
| Temperature 1 | 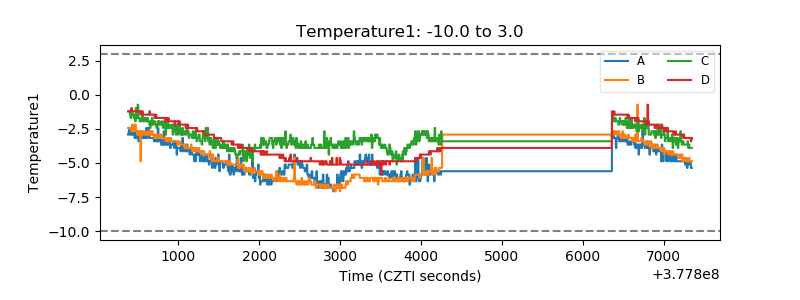 |
| Veto HV Monitor | 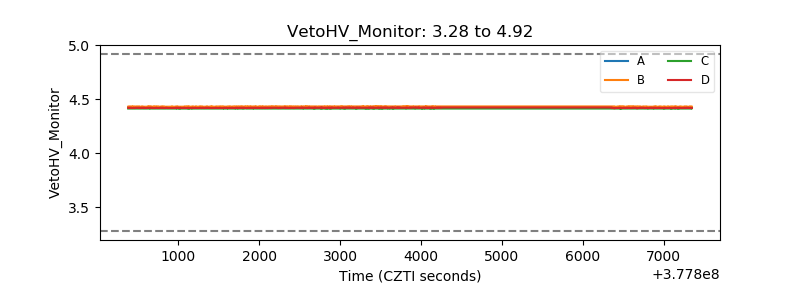 |
| Veto LLD | 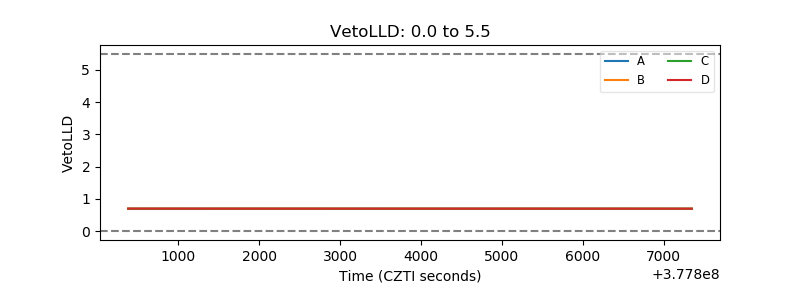 |
| Alpha Counter | 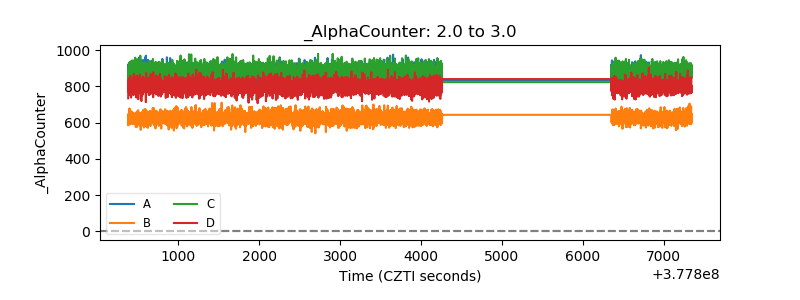 |
| _CPM_Rate | 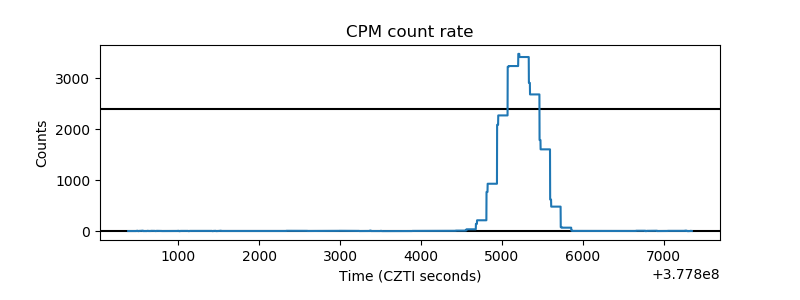 |
| CZT Counter | 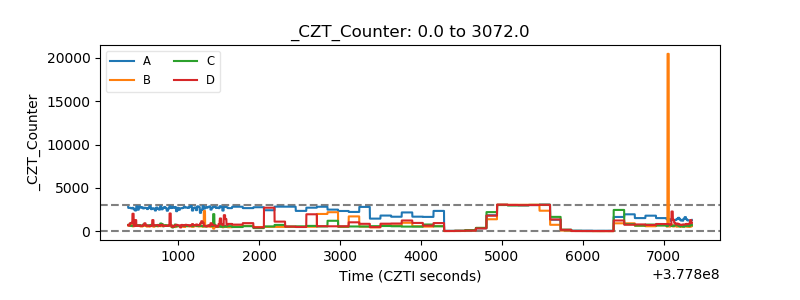 |
| +2.5 Volts monitor |  |
| +5 Volts monitor | 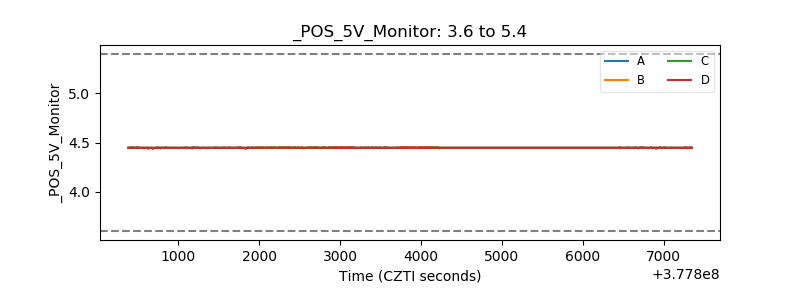 |
| _ROLL_ROT | 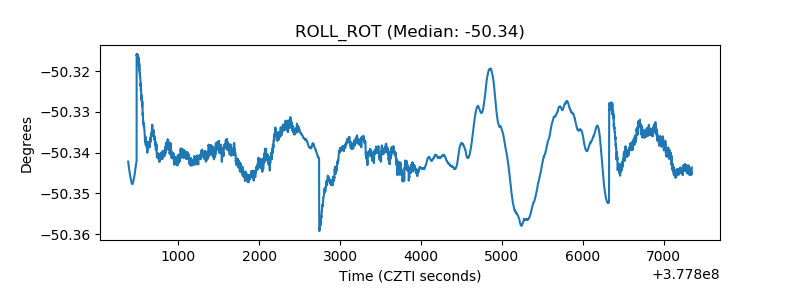 |
| _Roll_DEC | 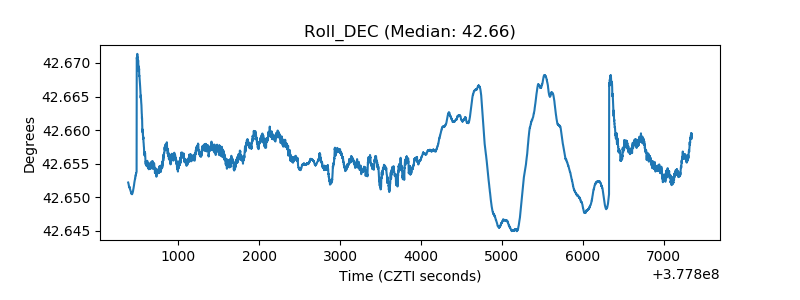 |
| _Roll_RA | 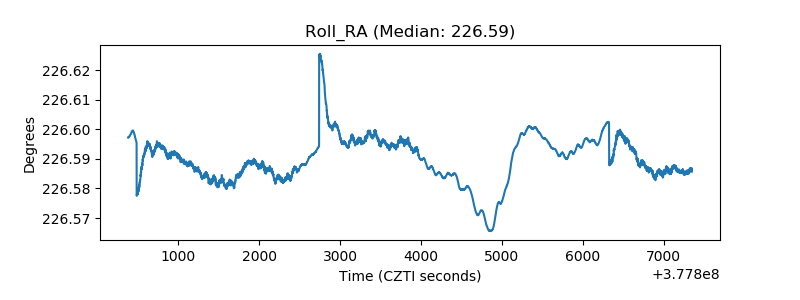 |
| Veto Counter | 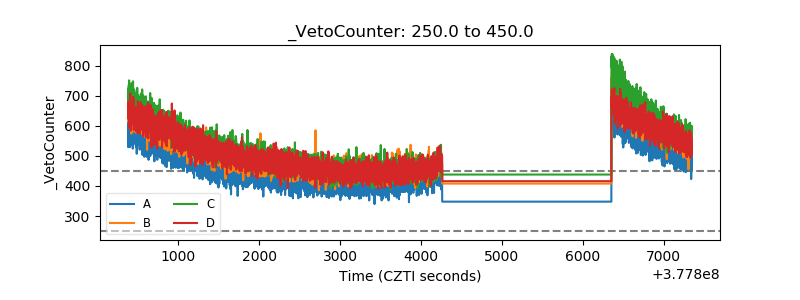 |