| Param | Original file | Final file |
|---|---|---|
| Filename | modeM0/AS1T04_090T01_9000004812_33699cztM0_level2.evt | modeM0/AS1T04_090T01_9000004812_33699cztM0_level2_quad_clean.evt |
| Size (bytes) | 3,294,921,600 | 237,415,680 |
| Size | 3.1 GB | 226.4 MB |
| Events in quadrant A | 51,009,771 | 798,199 |
| Events in quadrant B | 15,178,213 | 1,634,900 |
| Events in quadrant C | 13,120,411 | 1,691,101 |
| Events in quadrant D | 19,011,949 | 1,551,874 |
| Mode M9 | |||
|---|---|---|---|
| Quadrant | BADHDUFLAG | Total packets | Discarded packets |
| A | 0 | 98 | 0 |
| B | 0 | 98 | 0 |
| C | 0 | 98 | 0 |
| D | 0 | 98 | 0 |
| Mode M0 | |||
|---|---|---|---|
| Quadrant | BADHDUFLAG | Total packets | Discarded packets |
| A | 0 | 167026 | 6 |
| B | 0 | 58736 | 5 |
| C | 0 | 52003 | 5 |
| D | 0 | 72246 | 5 |
| Mode SS | |||
|---|---|---|---|
| Quadrant | BADHDUFLAG | Total packets | Discarded packets |
| A | 0 | 450 | 0 |
| B | 0 | 450 | 0 |
| C | 0 | 450 | 0 |
| D | 0 | 450 | 0 |
| Quadrant | Total seconds | Saturated seconds | Saturation percentage |
|---|---|---|---|
| A | 21922 | 16664 | 76.014962% |
| B | 21922 | 1323 | 6.035033% |
| C | 21922 | 286 | 1.304625% |
| D | 21922 | 1306 | 5.957486% |
Noise dominated data is calculated using 1-second bins in cleaned event files. If a bin has >2000 counts, and if more than 50% of those come from <1% of pixels, then it is considered to be noise-dominated and hence unusable.
| Quadrant | # 1 sec bins | Bins with >0 counts | Bins with >2000 counts | High rate bins dominated by noise | Noise dominated (total time) | Noise dominated (detector-on time) | Marked lightcurve |
|---|---|---|---|---|---|---|---|
| A | 31785 | 21922 | 16292 | 16292 | 51.26% | 74.32% | 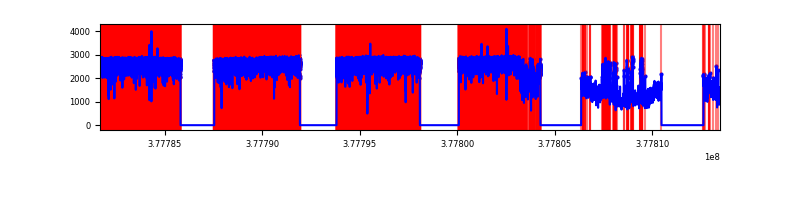 |
| B | 31785 | 21925 | 1071 | 1071 | 3.37% | 4.88% | 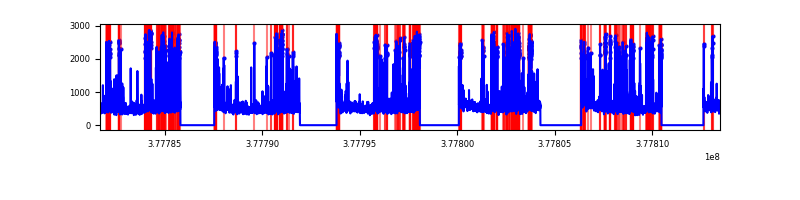 |
| C | 31785 | 21926 | 232 | 232 | 0.73% | 1.06% | 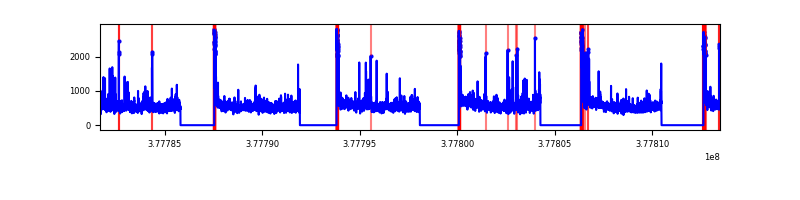 |
| D | 31785 | 21926 | 1349 | 1349 | 4.24% | 6.15% | 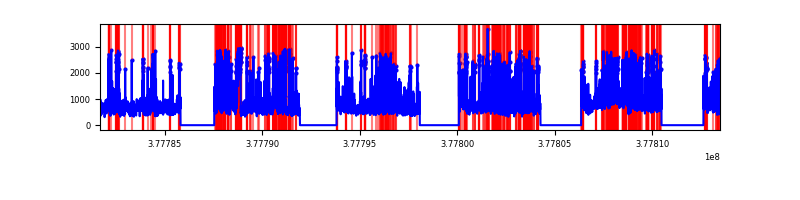 |
Top three noisy pixels from each quadrant. If the there are fewer than three noisy pixels in the level2.evt file, extra rows are filled as -1
| Pixel properties | Quadrant properties | ||||||
|---|---|---|---|---|---|---|---|
| Quadrant | DetID | PixID | Counts | Sigma | Mean | Median | Sigma |
| A | 15 | 169 | 43975578 | 159322.49 | 1419 | 1395 | 276.0 |
| A | 15 | 237 | 1284406 | 4648.47 | 1419 | 1395 | 276.0 |
| A | 14 | 4 | 240840 | 867.53 | 1419 | 1395 | 276.0 |
| B | 5 | 172 | 3655302 | 7424.03 | 2680 | 2623 | 492.0 |
| B | 4 | 170 | 302816 | 610.14 | 2680 | 2623 | 492.0 |
| B | 15 | 85 | 279917 | 563.6 | 2680 | 2623 | 492.0 |
| C | 15 | 214 | 942726 | 1543.1 | 2700 | 2730 | 609.2 |
| C | 3 | 233 | 892411 | 1460.51 | 2700 | 2730 | 609.2 |
| C | 0 | 10 | 638688 | 1043.99 | 2700 | 2730 | 609.2 |
| D | 8 | 195 | 2580948 | 3675.51 | 2630 | 2588 | 701.5 |
| D | 8 | 230 | 1711439 | 2436.01 | 2630 | 2588 | 701.5 |
| D | 2 | 249 | 1177277 | 1674.55 | 2630 | 2588 | 701.5 |
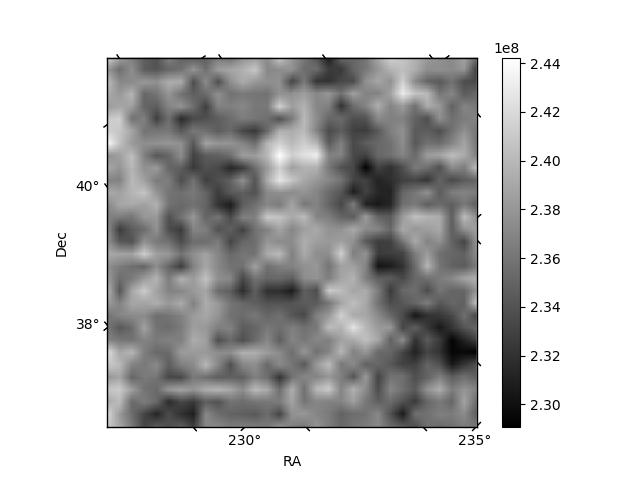
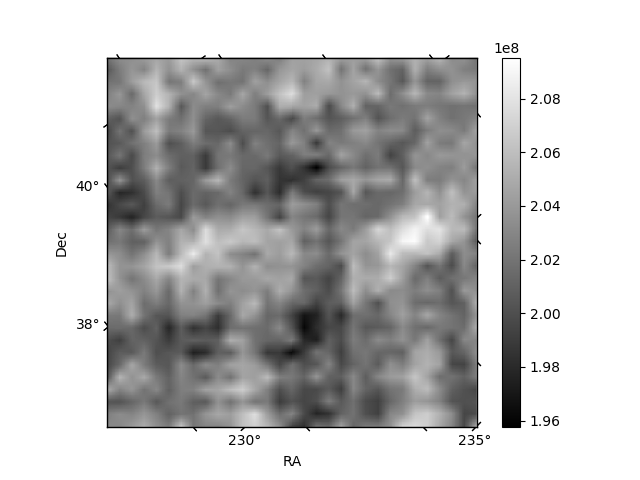
Histogram calculated using DETX and DETY for each event in the final _common_clean file
| Quadrant A | 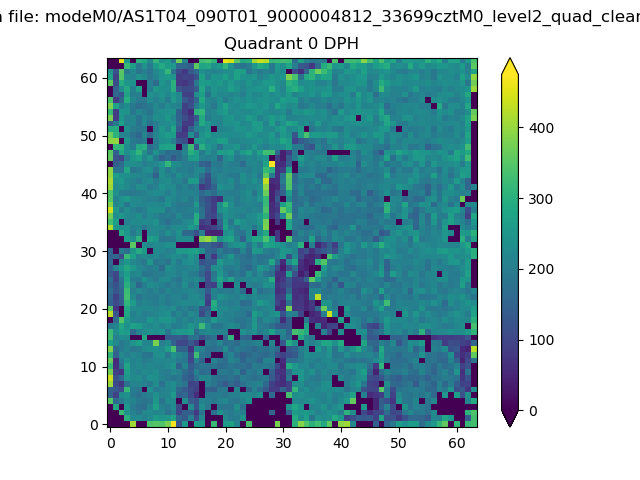 |
 |
Quadrant B |
|---|---|---|---|
| Quadrant D | 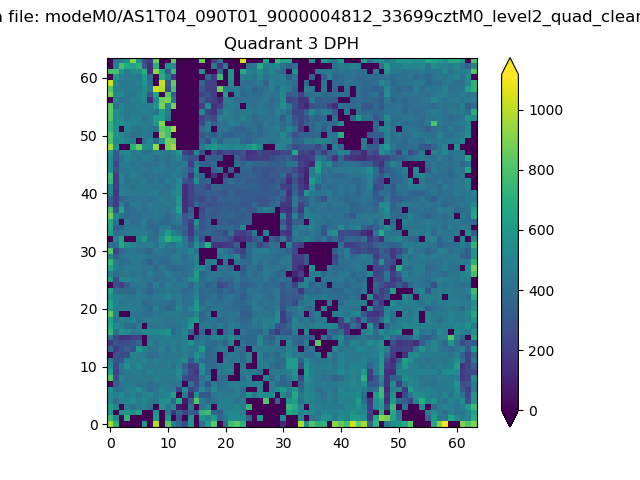 |
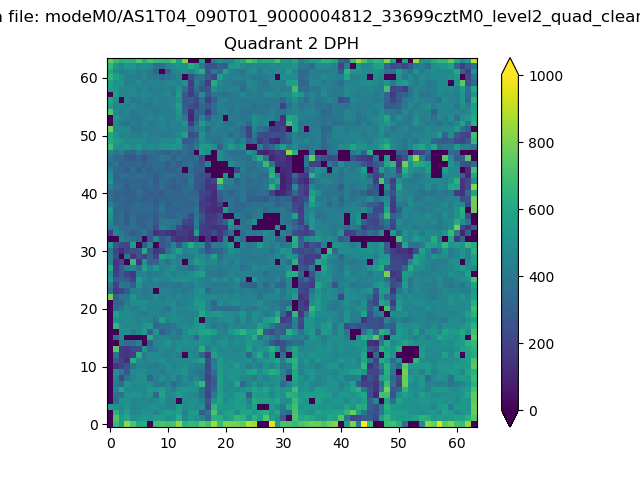 |
Quadrant C |
| Plot type | Count rate plots | Images |
|---|---|---|
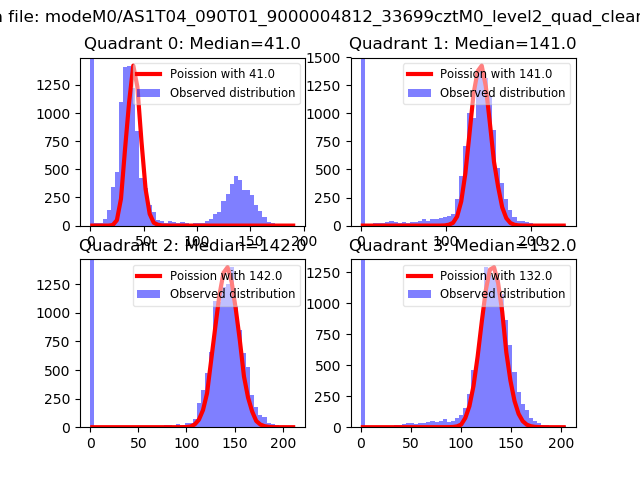
| Comparison with Poisson distribution Blue bars denote a histogram of data divided into 1 sec bins. Red curve is a Poisson curve with rate = median count rate of data. |
 |
 |
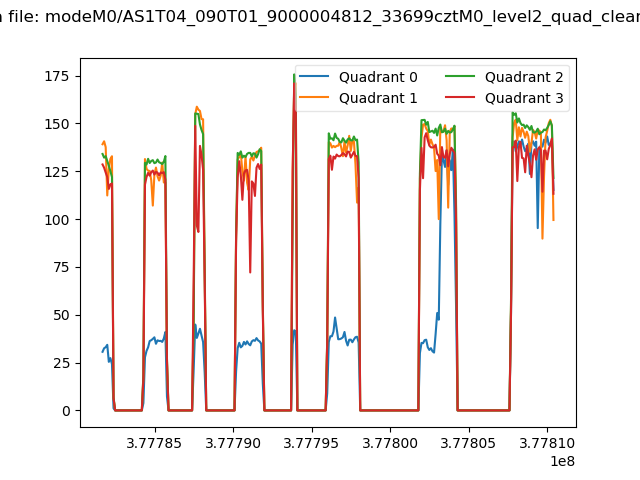
| Quadrant-wise count rates Data is divided into 100 sec bins |
 |
|
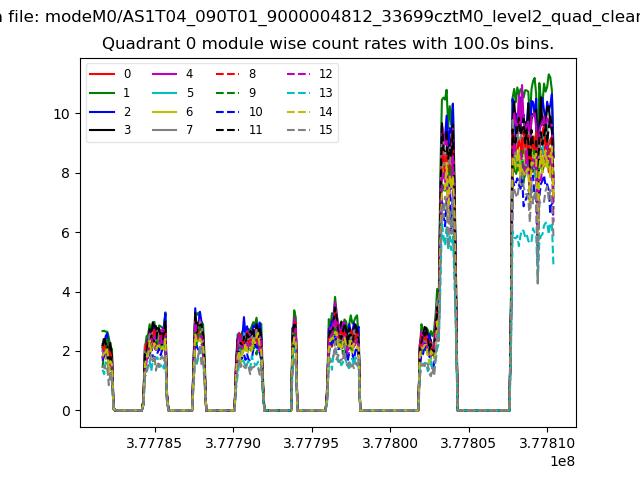
| Module-wise count rates for Quadrant A Data is divided into 100 sec bins |
 |
 |
| Module-wise count rates for Quadrant B Data is divided into 100 sec bins |
 |
 |
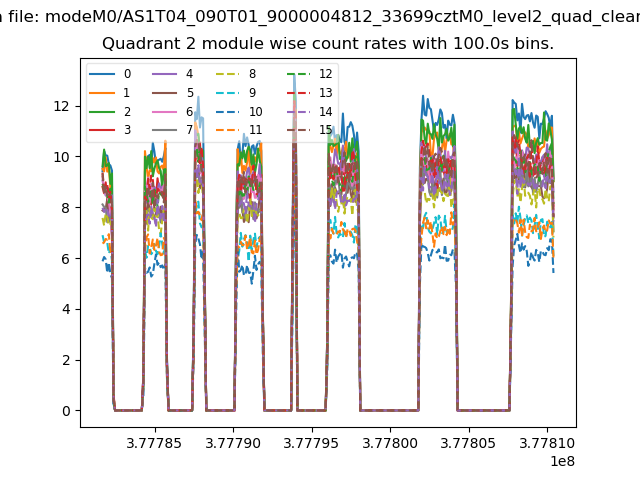
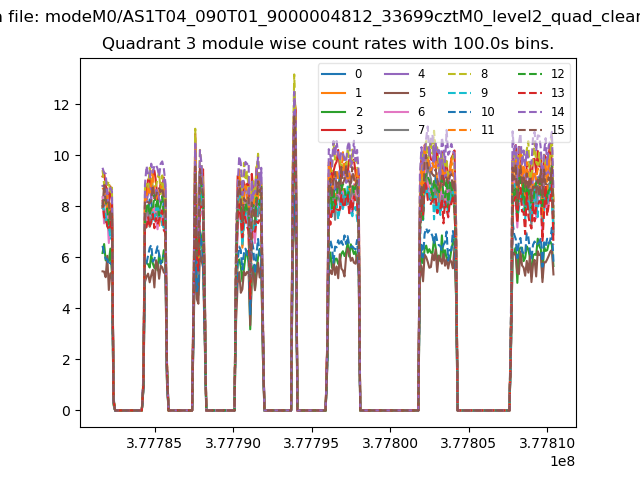
| Module-wise count rates for Quadrant C Data is divided into 100 sec bins |
 |
 |
| Module-wise count rates for Quadrant D Data is divided into 100 sec bins |
 |
 |
| Parameter | Plot |
|---|---|
| CZT HV Monitor | 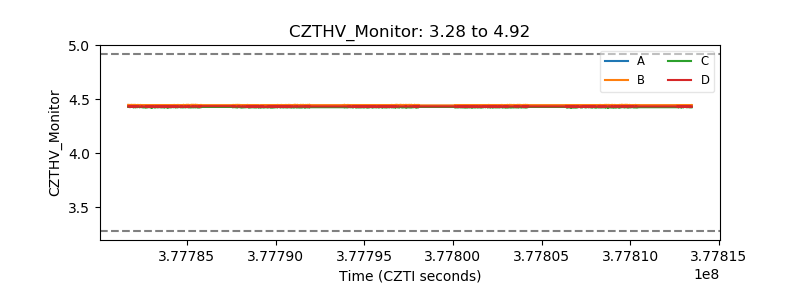 |
| D_VDD | 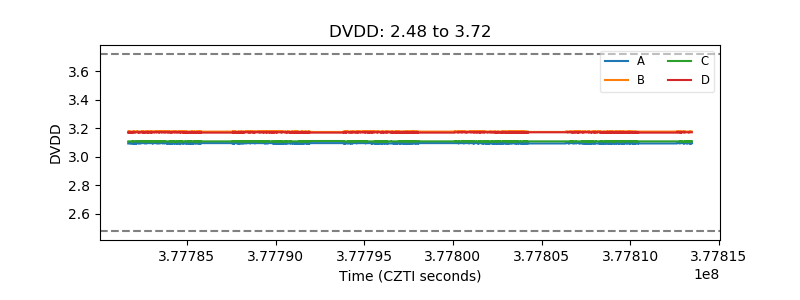 |
| Temperature 1 |  |
| Veto HV Monitor | 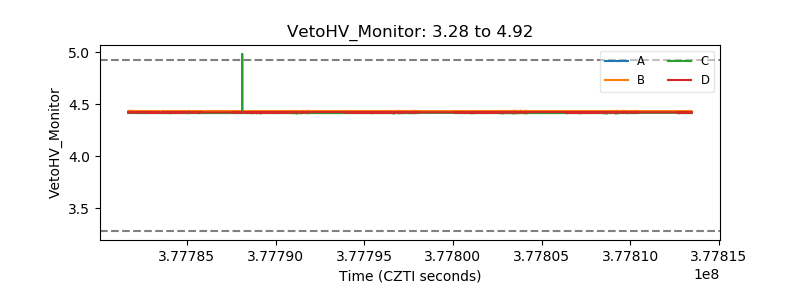 |
| Veto LLD | 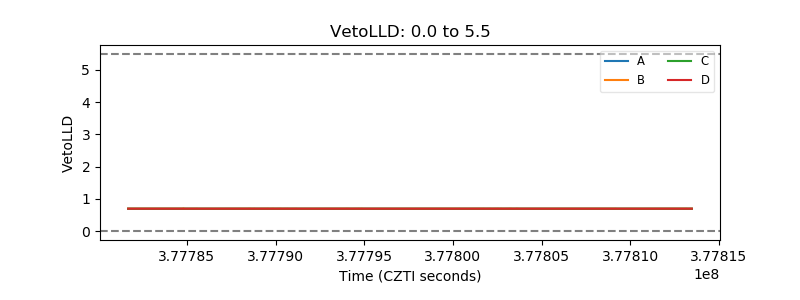 |
| Alpha Counter |  |
| _CPM_Rate | 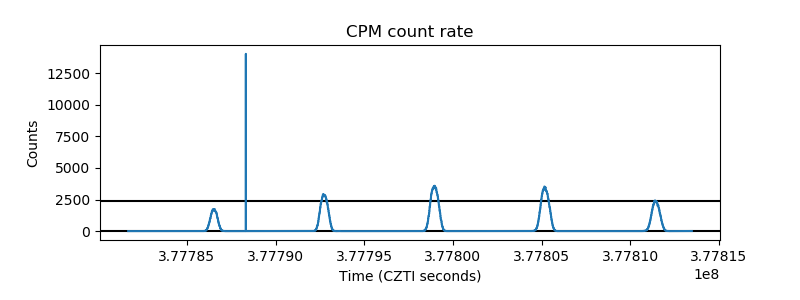 |
| CZT Counter |  |
| +2.5 Volts monitor |  |
| +5 Volts monitor | 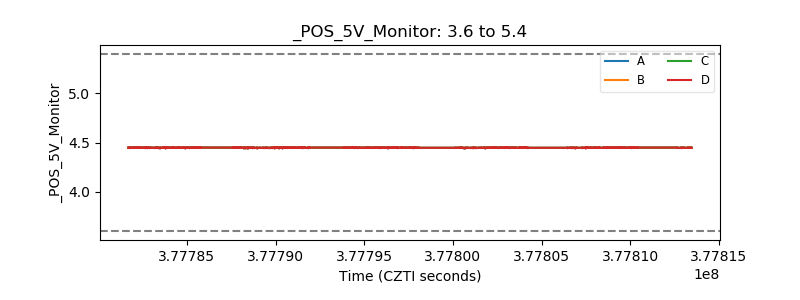 |
| _ROLL_ROT | 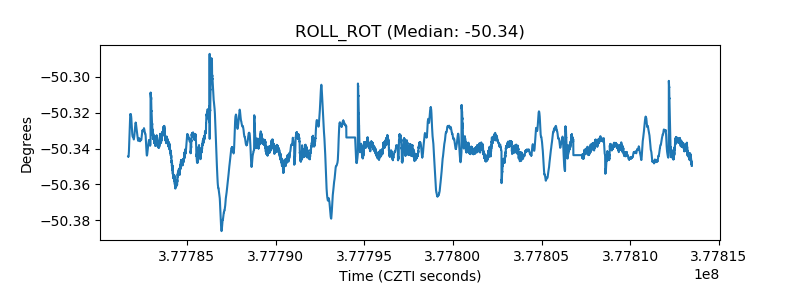 |
| _Roll_DEC | 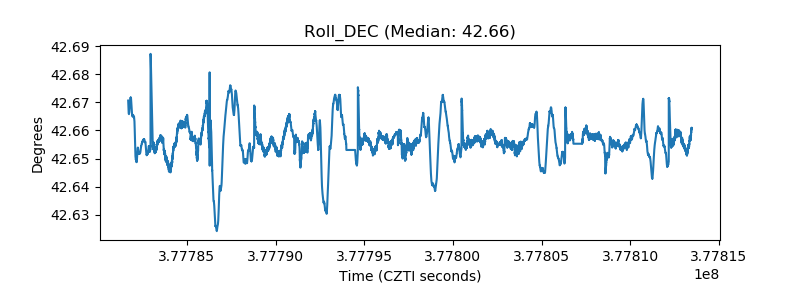 |
| _Roll_RA | 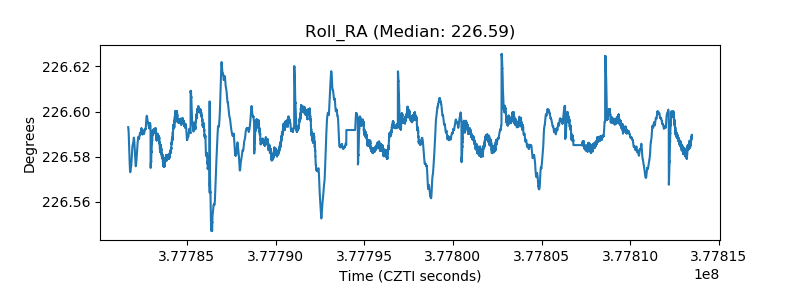 |
| Veto Counter | 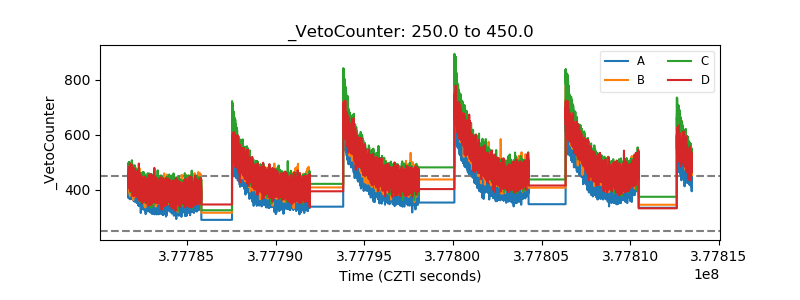 |