| Param | Original file | Final file |
|---|---|---|
| Filename | modeM0/AS1T04_090T01_9000004812_33701cztM0_level2.evt | modeM0/AS1T04_090T01_9000004812_33701cztM0_level2_quad_clean.evt |
| Size (bytes) | 741,672,000 | 81,996,480 |
| Size | 707.3 MB | 78.2 MB |
| Events in quadrant A | 10,861,972 | 420,887 |
| Events in quadrant B | 3,956,216 | 564,230 |
| Events in quadrant C | 2,896,824 | 591,816 |
| Events in quadrant D | 4,403,706 | 548,361 |
| Mode M9 | |||
|---|---|---|---|
| Quadrant | BADHDUFLAG | Total packets | Discarded packets |
| A | 0 | 26 | 0 |
| B | 0 | 26 | 0 |
| C | 0 | 26 | 0 |
| D | 0 | 27 | 0 |
| Mode M0 | |||
|---|---|---|---|
| Quadrant | BADHDUFLAG | Total packets | Discarded packets |
| A | 0 | 35728 | 3 |
| B | 0 | 15013 | 2 |
| C | 0 | 11607 | 2 |
| D | 0 | 16667 | 2 |
| Mode SS | |||
|---|---|---|---|
| Quadrant | BADHDUFLAG | Total packets | Discarded packets |
| A | 0 | 104 | 0 |
| B | 0 | 104 | 0 |
| C | 0 | 104 | 0 |
| D | 0 | 104 | 0 |
| Quadrant | Total seconds | Saturated seconds | Saturation percentage |
|---|---|---|---|
| A | 5079 | 3629 | 71.451073% |
| B | 5079 | 459 | 9.037212% |
| C | 5079 | 97 | 1.909825% |
| D | 5079 | 236 | 4.646584% |
Noise dominated data is calculated using 1-second bins in cleaned event files. If a bin has >2000 counts, and if more than 50% of those come from <1% of pixels, then it is considered to be noise-dominated and hence unusable.
| Quadrant | # 1 sec bins | Bins with >0 counts | Bins with >2000 counts | High rate bins dominated by noise | Noise dominated (total time) | Noise dominated (detector-on time) | Marked lightcurve |
|---|---|---|---|---|---|---|---|
| A | 6991 | 5079 | 3680 | 3680 | 52.64% | 72.46% | 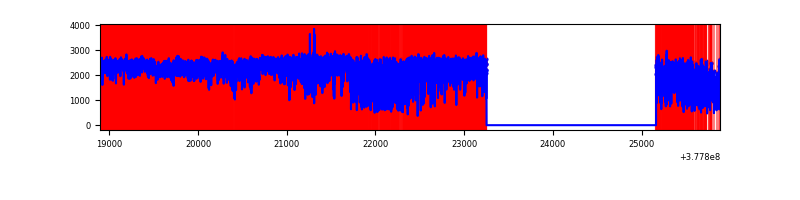 |
| B | 6991 | 5080 | 383 | 383 | 5.48% | 7.54% | 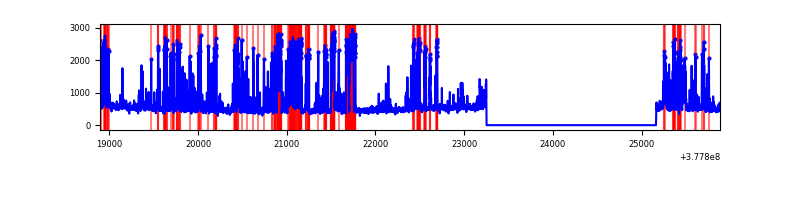 |
| C | 6991 | 5080 | 79 | 79 | 1.13% | 1.56% | 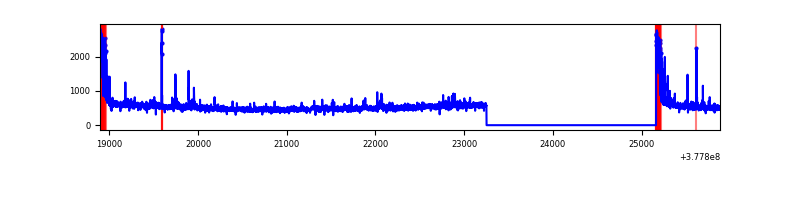 |
| D | 6991 | 5080 | 257 | 257 | 3.68% | 5.06% | 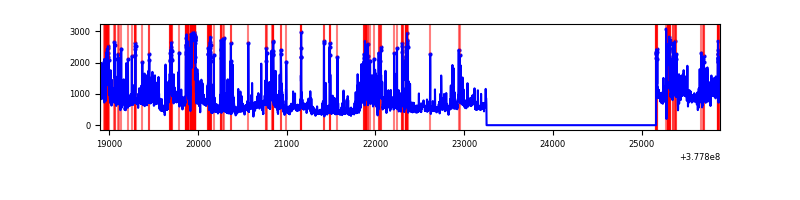 |
Top three noisy pixels from each quadrant. If the there are fewer than three noisy pixels in the level2.evt file, extra rows are filled as -1
| Pixel properties | Quadrant properties | ||||||
|---|---|---|---|---|---|---|---|
| Quadrant | DetID | PixID | Counts | Sigma | Mean | Median | Sigma |
| A | 15 | 169 | 8737572 | 96994.89 | 450 | 443 | 90.1 |
| A | 15 | 237 | 353909 | 3923.99 | 450 | 443 | 90.1 |
| A | 14 | 4 | 22374 | 243.47 | 450 | 443 | 90.1 |
| B | 5 | 172 | 1533128 | 14069.05 | 575 | 563 | 108.9 |
| B | 0 | 213 | 38269 | 346.14 | 575 | 563 | 108.9 |
| B | 4 | 170 | 23680 | 212.22 | 575 | 563 | 108.9 |
| C | 15 | 214 | 232938 | 1735.11 | 580 | 586 | 133.9 |
| C | 0 | 10 | 232614 | 1732.69 | 580 | 586 | 133.9 |
| C | 3 | 233 | 114256 | 848.84 | 580 | 586 | 133.9 |
| D | 8 | 195 | 824456 | 5451.25 | 566 | 556 | 151.1 |
| D | 7 | 80 | 767924 | 5077.22 | 566 | 556 | 151.1 |
| D | 12 | 6 | 116214 | 765.24 | 566 | 556 | 151.1 |
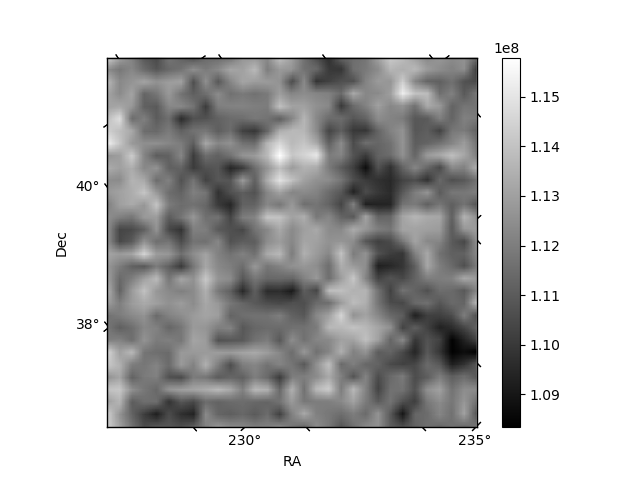
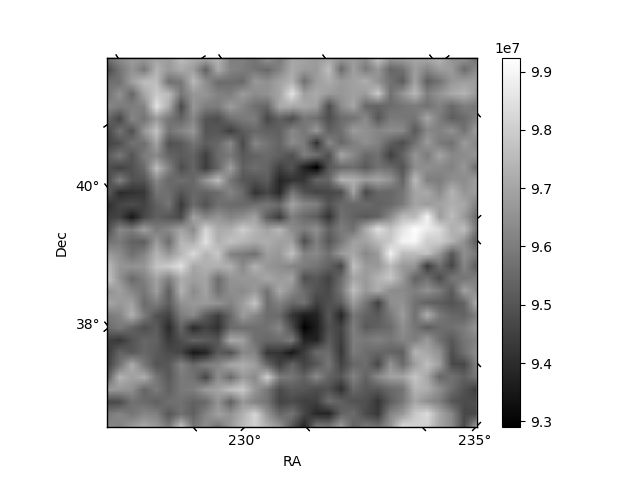
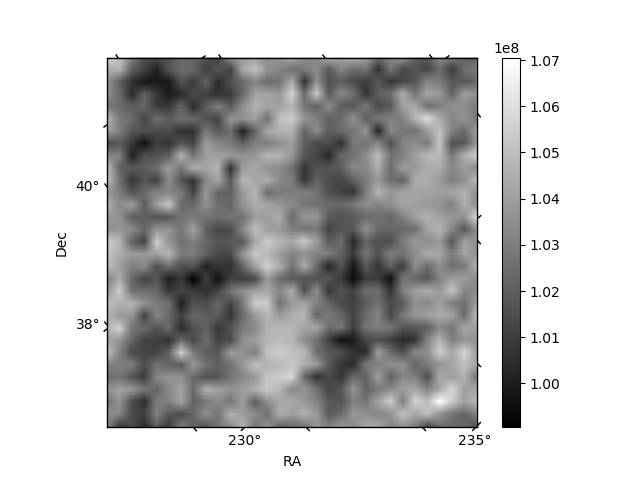
Histogram calculated using DETX and DETY for each event in the final _common_clean file
| Quadrant A | 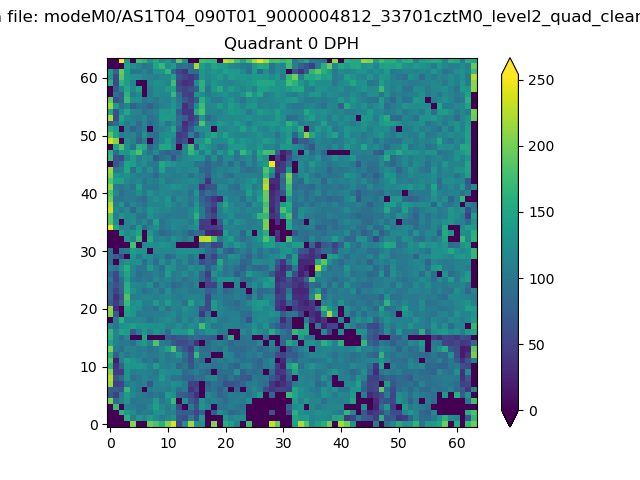 |
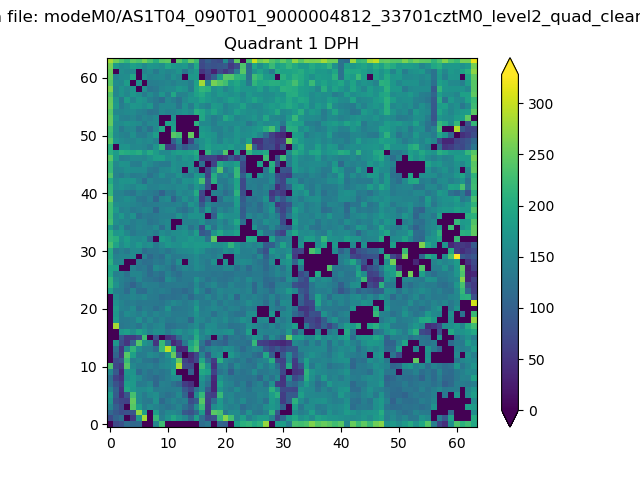 |
Quadrant B |
|---|---|---|---|
| Quadrant D | 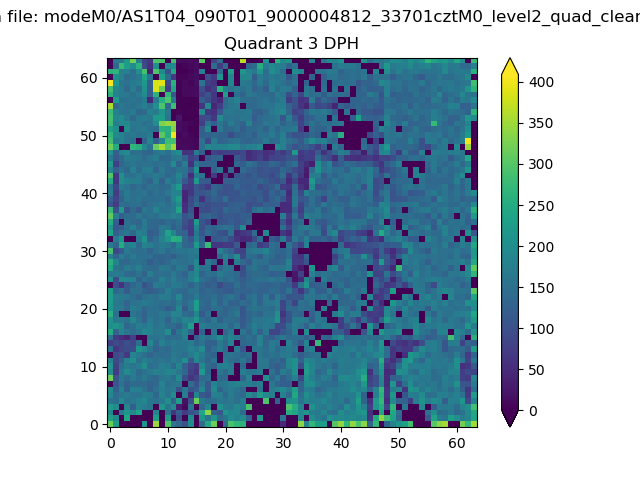 |
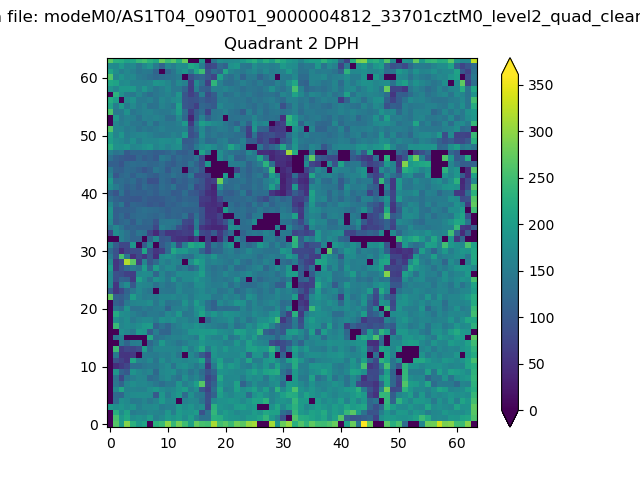 |
Quadrant C |
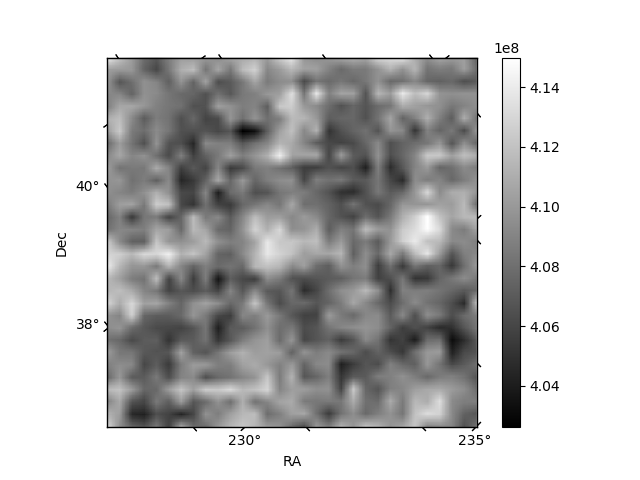
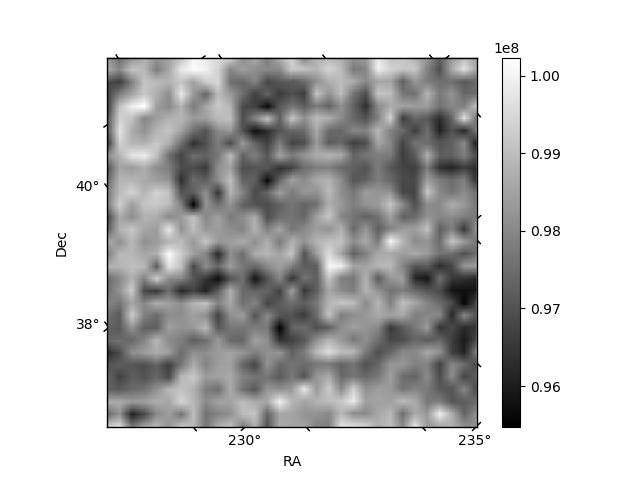
| Plot type | Count rate plots | Images |
|---|---|---|
| Comparison with Poisson distribution Blue bars denote a histogram of data divided into 1 sec bins. Red curve is a Poisson curve with rate = median count rate of data. |
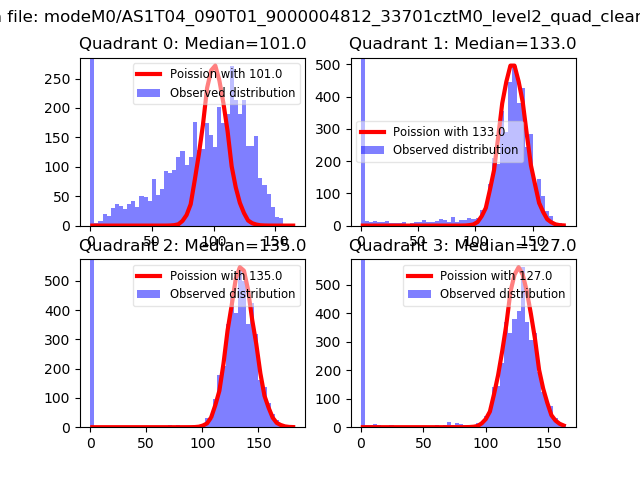 |
 |
| Quadrant-wise count rates Data is divided into 100 sec bins |
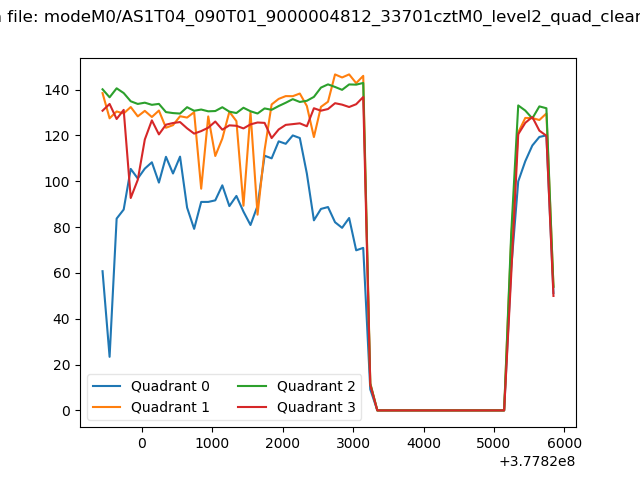 |
|
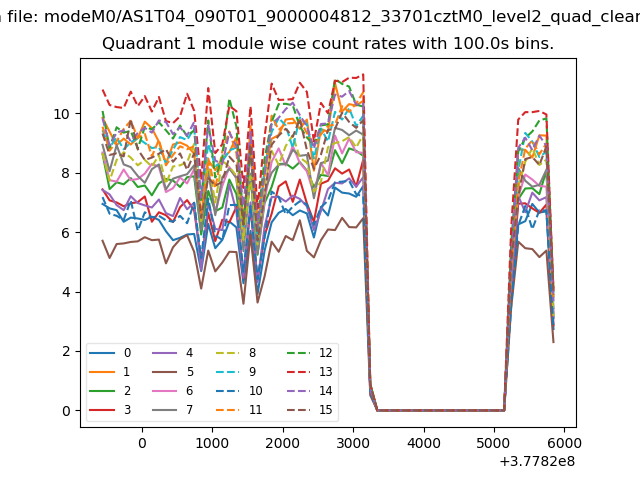
| Module-wise count rates for Quadrant A Data is divided into 100 sec bins |
 |
 |
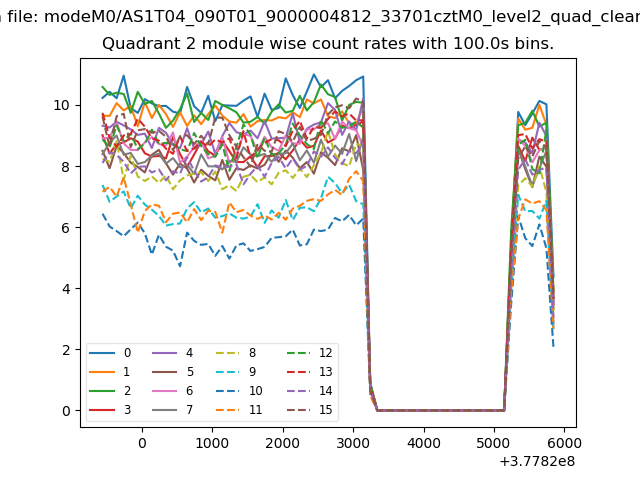
| Module-wise count rates for Quadrant B Data is divided into 100 sec bins |
 |
 |
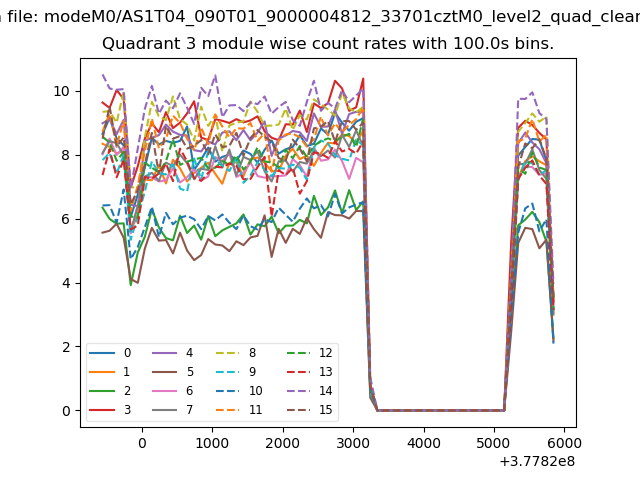
| Module-wise count rates for Quadrant C Data is divided into 100 sec bins |
 |
 |
| Module-wise count rates for Quadrant D Data is divided into 100 sec bins |
 |
 |
| Parameter | Plot |
|---|---|
| CZT HV Monitor | 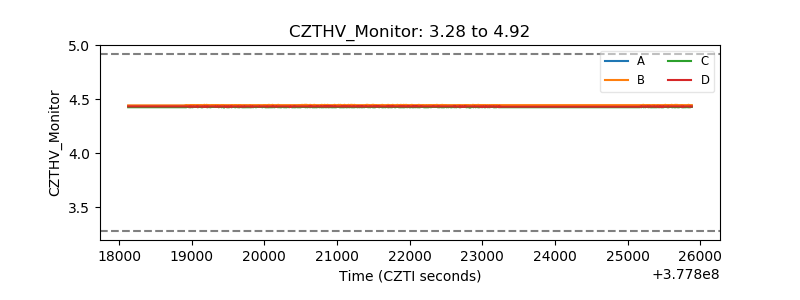 |
| D_VDD | 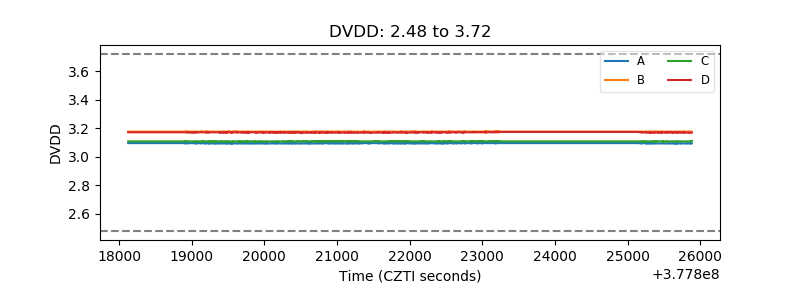 |
| Temperature 1 | 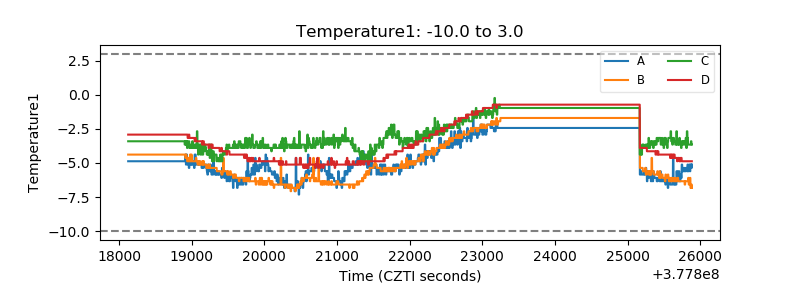 |
| Veto HV Monitor | 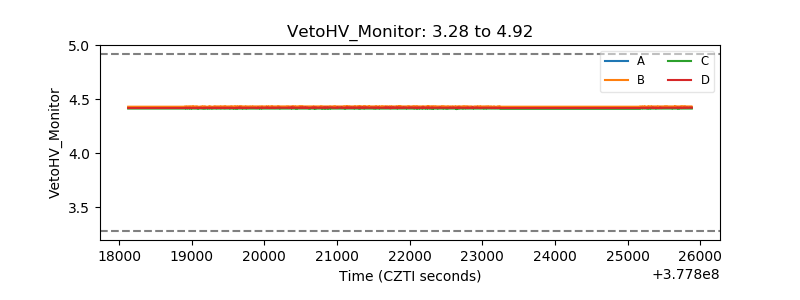 |
| Veto LLD | 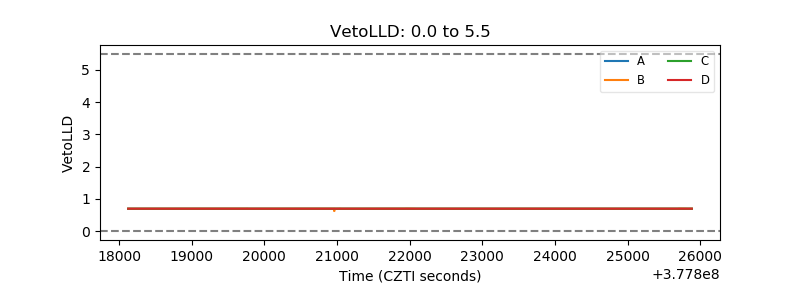 |
| Alpha Counter | 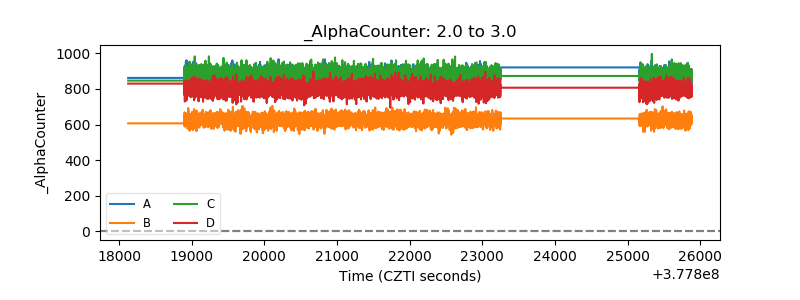 |
| _CPM_Rate | 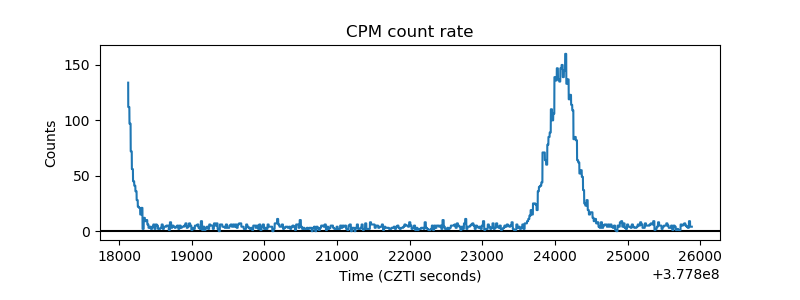 |
| CZT Counter | 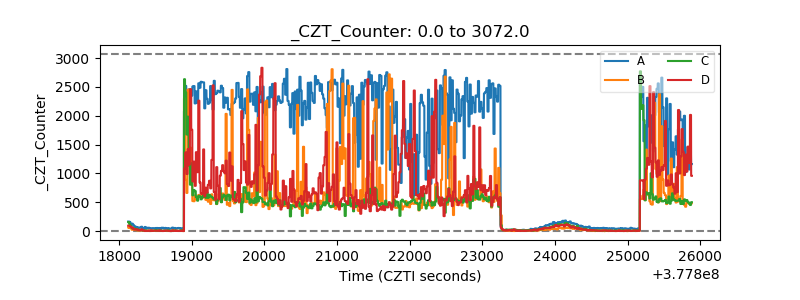 |
| +2.5 Volts monitor |  |
| +5 Volts monitor |  |
| _ROLL_ROT |  |
| _Roll_DEC | 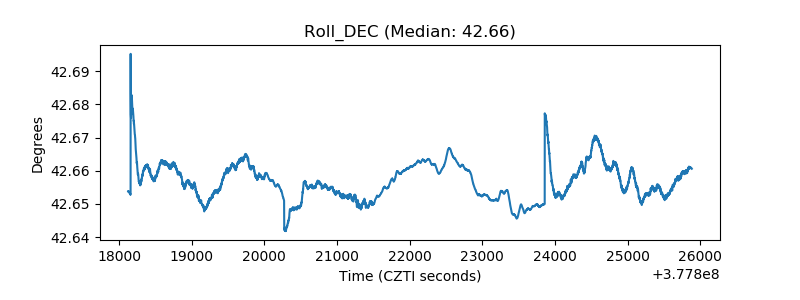 |
| _Roll_RA | 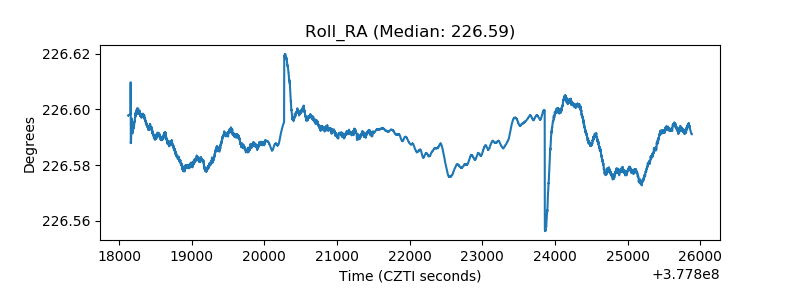 |
| Veto Counter |  |