| Param | Original file | Final file |
|---|---|---|
| Filename | modeM0/AS1T04_090T01_9000004812_33702cztM0_level2.evt | modeM0/AS1T04_090T01_9000004812_33702cztM0_level2_quad_clean.evt |
| Size (bytes) | 774,178,560 | 88,053,120 |
| Size | 738.3 MB | 84.0 MB |
| Events in quadrant A | 9,304,980 | 533,947 |
| Events in quadrant B | 4,756,078 | 577,638 |
| Events in quadrant C | 3,040,946 | 606,208 |
| Events in quadrant D | 5,969,468 | 558,414 |
| Mode M9 | |||
|---|---|---|---|
| Quadrant | BADHDUFLAG | Total packets | Discarded packets |
| A | 0 | 28 | 0 |
| B | 0 | 28 | 0 |
| C | 0 | 28 | 0 |
| D | 0 | 29 | 0 |
| Mode M0 | |||
|---|---|---|---|
| Quadrant | BADHDUFLAG | Total packets | Discarded packets |
| A | 0 | 31528 | 3 |
| B | 0 | 17879 | 2 |
| C | 0 | 12347 | 2 |
| D | 0 | 21634 | 2 |
| Mode SS | |||
|---|---|---|---|
| Quadrant | BADHDUFLAG | Total packets | Discarded packets |
| A | 0 | 112 | 0 |
| B | 0 | 112 | 0 |
| C | 0 | 112 | 0 |
| D | 0 | 112 | 0 |
| Quadrant | Total seconds | Saturated seconds | Saturation percentage |
|---|---|---|---|
| A | 5570 | 2017 | 36.211849% |
| B | 5570 | 599 | 10.754039% |
| C | 5570 | 82 | 1.472172% |
| D | 5570 | 507 | 9.102334% |
Noise dominated data is calculated using 1-second bins in cleaned event files. If a bin has >2000 counts, and if more than 50% of those come from <1% of pixels, then it is considered to be noise-dominated and hence unusable.
| Quadrant | # 1 sec bins | Bins with >0 counts | Bins with >2000 counts | High rate bins dominated by noise | Noise dominated (total time) | Noise dominated (detector-on time) | Marked lightcurve |
|---|---|---|---|---|---|---|---|
| A | 7153 | 5569 | 1946 | 1946 | 27.21% | 34.94% | 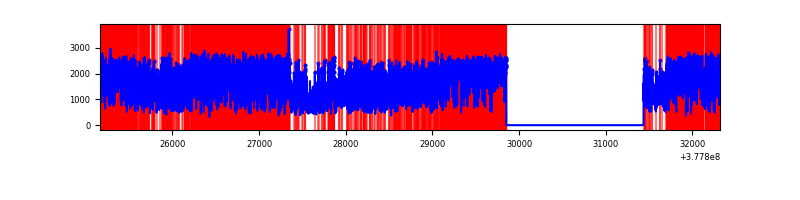 |
| B | 7153 | 5570 | 504 | 504 | 7.05% | 9.05% | 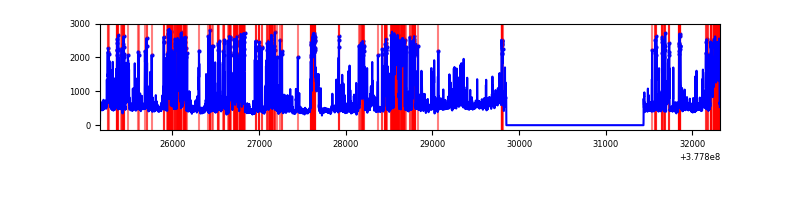 |
| C | 7153 | 5570 | 64 | 64 | 0.89% | 1.15% | 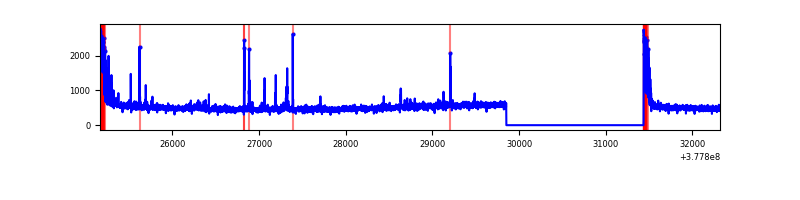 |
| D | 7153 | 5570 | 463 | 463 | 6.47% | 8.31% | 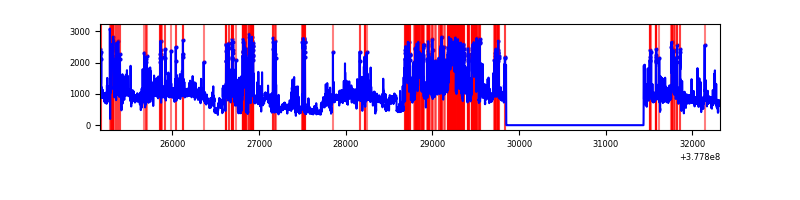 |
Top three noisy pixels from each quadrant. If the there are fewer than three noisy pixels in the level2.evt file, extra rows are filled as -1
| Pixel properties | Quadrant properties | ||||||
|---|---|---|---|---|---|---|---|
| Quadrant | DetID | PixID | Counts | Sigma | Mean | Median | Sigma |
| A | 15 | 169 | 6927960 | 60671.66 | 570 | 557 | 114.2 |
| A | 15 | 237 | 144542 | 1261.05 | 570 | 557 | 114.2 |
| A | 14 | 4 | 15042 | 126.86 | 570 | 557 | 114.2 |
| B | 5 | 172 | 2003969 | 17121.35 | 617 | 601 | 117.0 |
| B | 5 | 255 | 151569 | 1290.22 | 617 | 601 | 117.0 |
| B | 0 | 213 | 42007 | 353.87 | 617 | 601 | 117.0 |
| C | 15 | 214 | 255596 | 1753.24 | 625 | 629 | 145.4 |
| C | 0 | 10 | 203574 | 1395.52 | 625 | 629 | 145.4 |
| C | 3 | 233 | 74065 | 504.97 | 625 | 629 | 145.4 |
| D | 8 | 195 | 1745192 | 10964.93 | 601 | 588 | 159.1 |
| D | 7 | 80 | 1106658 | 6951.71 | 601 | 588 | 159.1 |
| D | 2 | 250 | 270986 | 1699.47 | 601 | 588 | 159.1 |
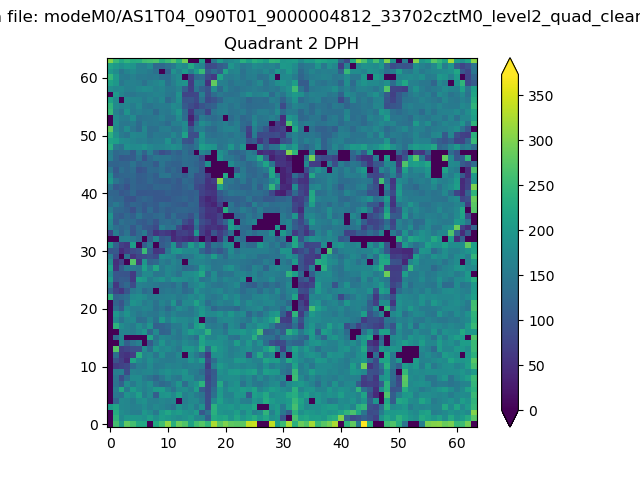
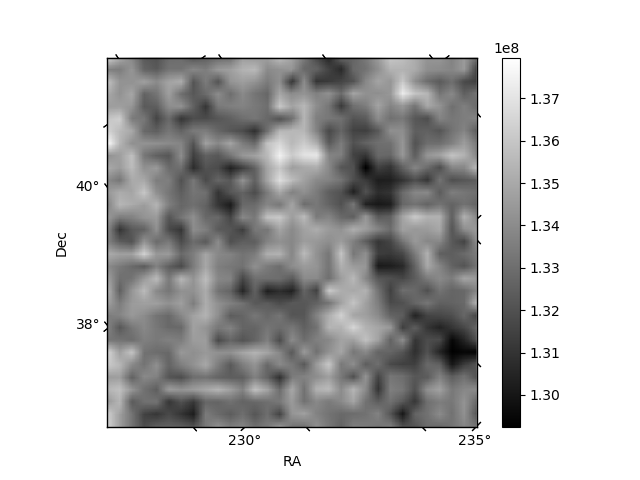
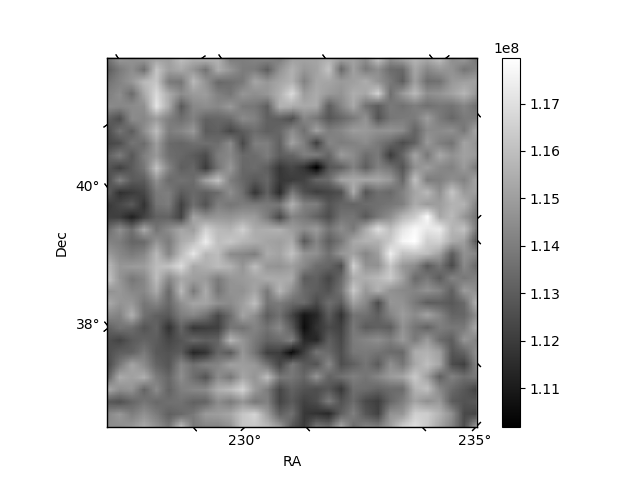
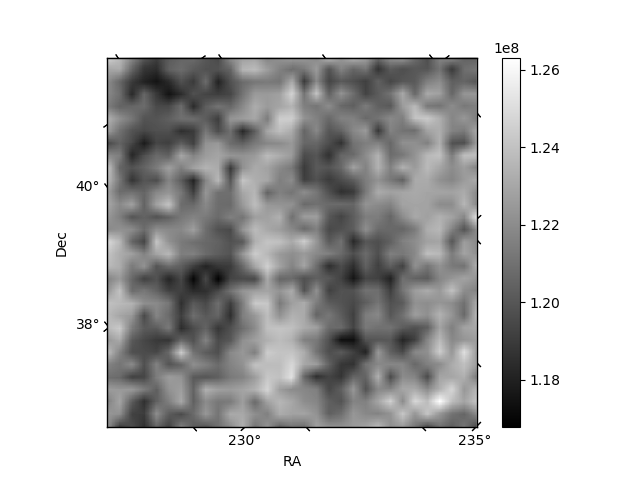
Histogram calculated using DETX and DETY for each event in the final _common_clean file
| Quadrant A |  |
 |
Quadrant B |
|---|---|---|---|
| Quadrant D | 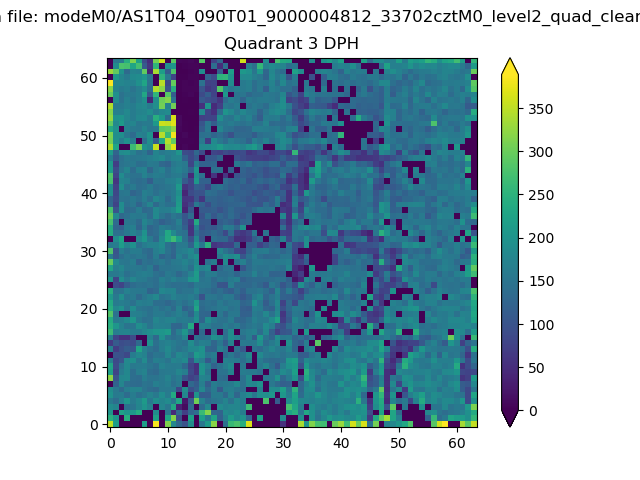 |
 |
Quadrant C |
| Plot type | Count rate plots | Images |
|---|---|---|
| Comparison with Poisson distribution Blue bars denote a histogram of data divided into 1 sec bins. Red curve is a Poisson curve with rate = median count rate of data. |
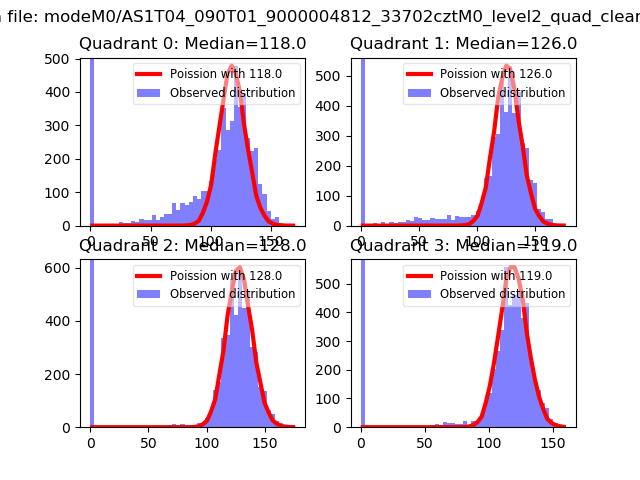 |
 |
| Quadrant-wise count rates Data is divided into 100 sec bins |
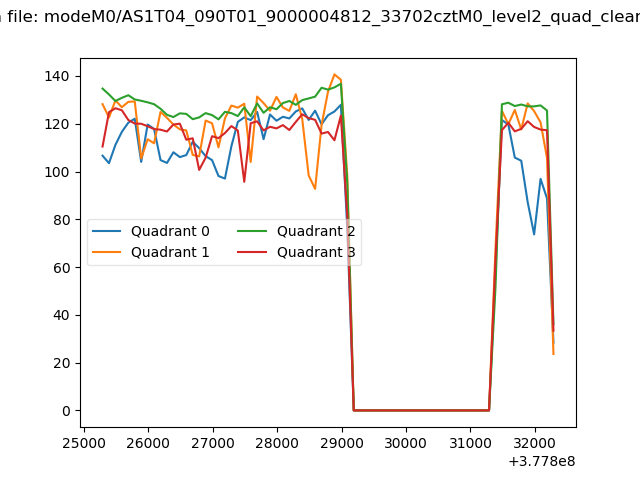 |
|
| Module-wise count rates for Quadrant A Data is divided into 100 sec bins |
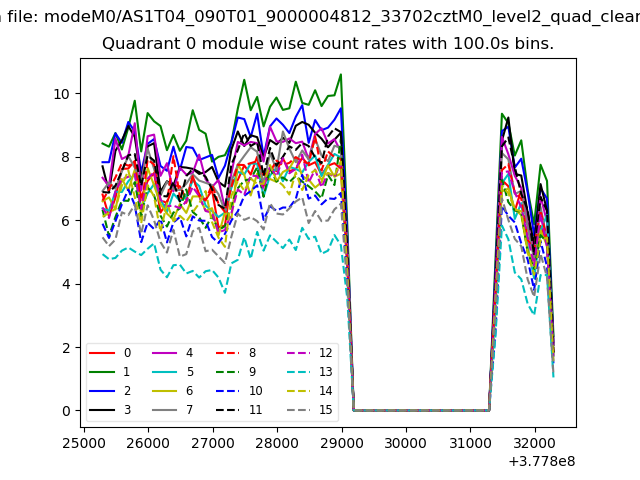 |
 |
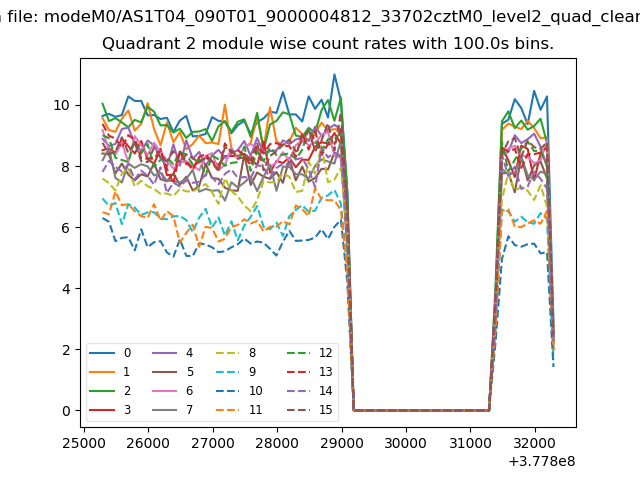
| Module-wise count rates for Quadrant B Data is divided into 100 sec bins |
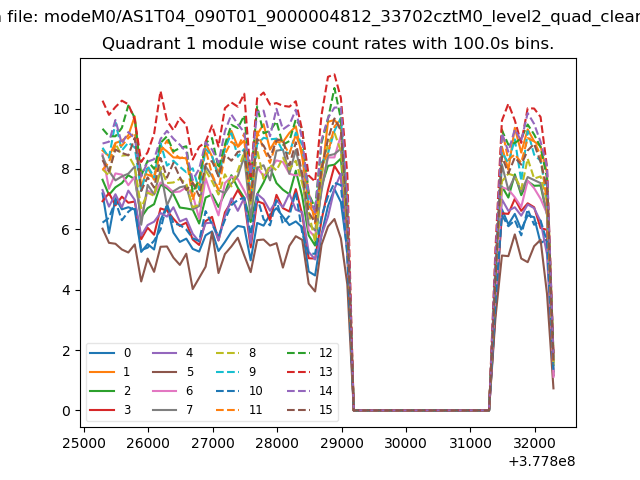 |
 |
| Module-wise count rates for Quadrant C Data is divided into 100 sec bins |
 |
 |
| Module-wise count rates for Quadrant D Data is divided into 100 sec bins |
 |
 |
| Parameter | Plot |
|---|---|
| CZT HV Monitor | 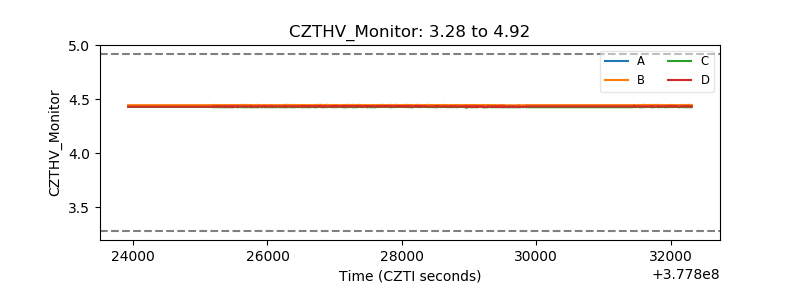 |
| D_VDD | 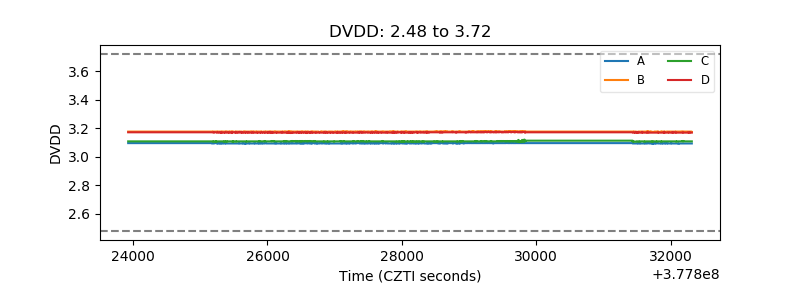 |
| Temperature 1 | 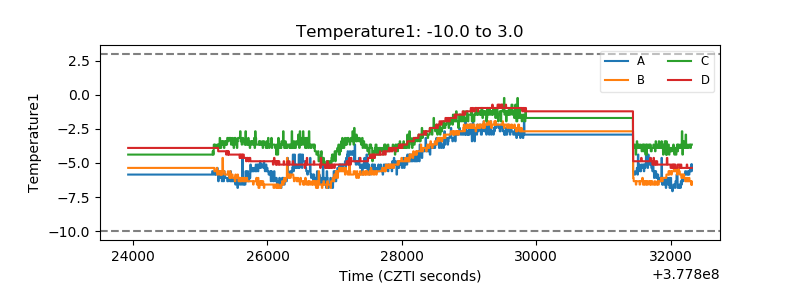 |
| Veto HV Monitor | 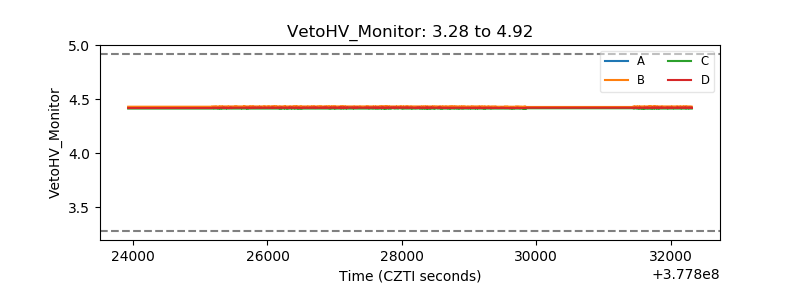 |
| Veto LLD | 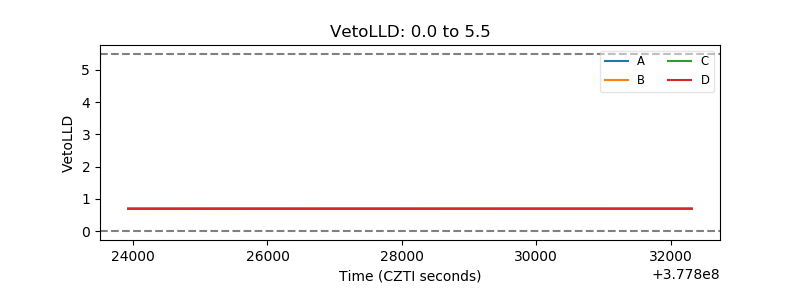 |
| Alpha Counter | 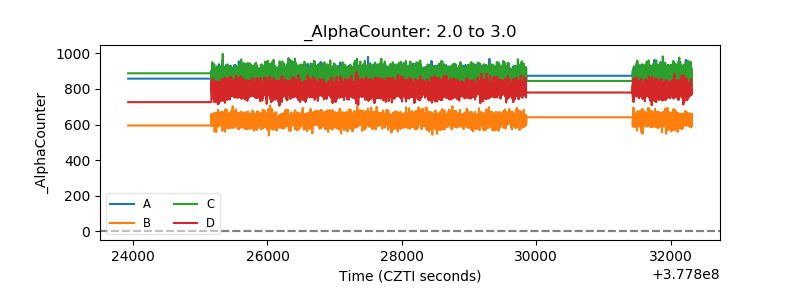 |
| _CPM_Rate | 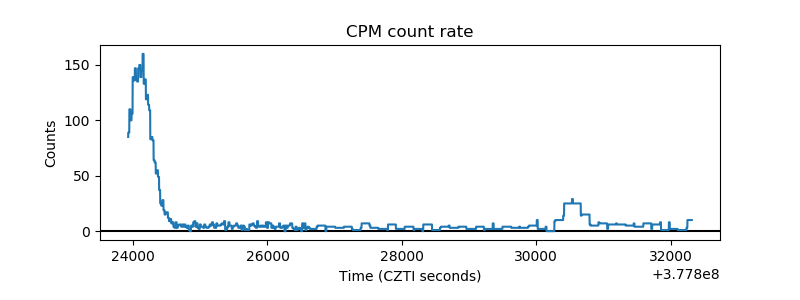 |
| CZT Counter | 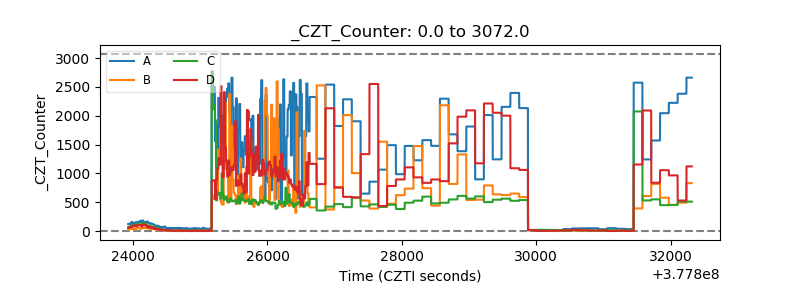 |
| +2.5 Volts monitor |  |
| +5 Volts monitor | 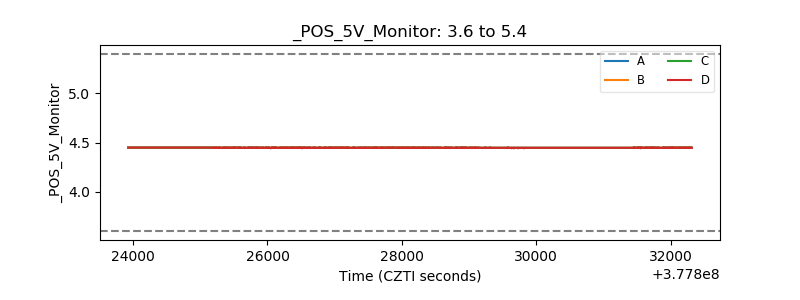 |
| _ROLL_ROT |  |
| _Roll_DEC | 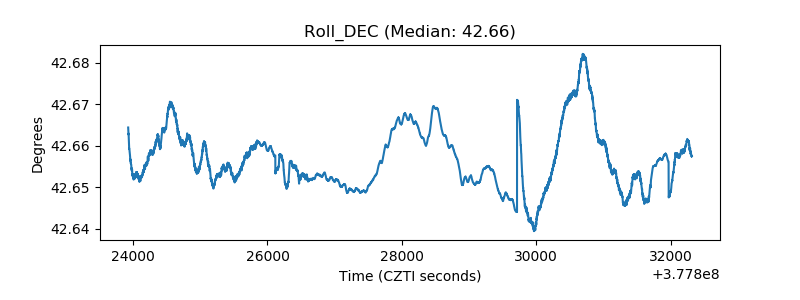 |
| _Roll_RA |  |
| Veto Counter | 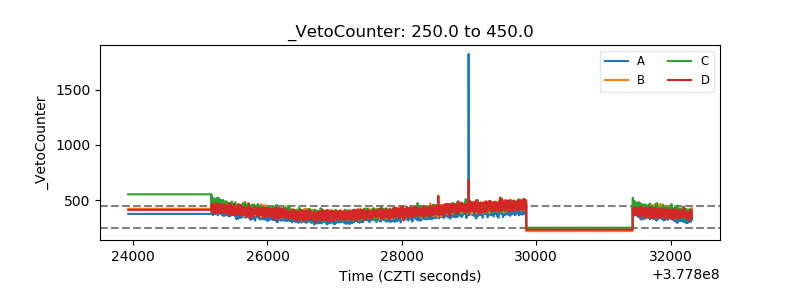 |