| Param | Original file | Final file |
|---|---|---|
| Filename | modeM0/AS1T04_090T01_9000004812_33703cztM0_level2.evt | modeM0/AS1T04_090T01_9000004812_33703cztM0_level2_quad_clean.evt |
| Size (bytes) | 810,930,240 | 80,740,800 |
| Size | 773.4 MB | 77.0 MB |
| Events in quadrant A | 11,146,963 | 419,564 |
| Events in quadrant B | 5,201,807 | 530,398 |
| Events in quadrant C | 3,111,016 | 558,753 |
| Events in quadrant D | 4,703,880 | 525,189 |
| Mode M9 | |||
|---|---|---|---|
| Quadrant | BADHDUFLAG | Total packets | Discarded packets |
| A | 0 | 18 | 0 |
| B | 0 | 18 | 0 |
| C | 0 | 18 | 0 |
| D | 0 | 19 | 0 |
| Mode M0 | |||
|---|---|---|---|
| Quadrant | BADHDUFLAG | Total packets | Discarded packets |
| A | 0 | 37265 | 134 |
| B | 0 | 19285 | 10 |
| C | 0 | 12839 | 6 |
| D | 0 | 18055 | 12 |
| Mode SS | |||
|---|---|---|---|
| Quadrant | BADHDUFLAG | Total packets | Discarded packets |
| A | 0 | 120 | 0 |
| B | 0 | 120 | 0 |
| C | 0 | 120 | 0 |
| D | 0 | 120 | 0 |
| Quadrant | Total seconds | Saturated seconds | Saturation percentage |
|---|---|---|---|
| A | 5847 | 3589 | 61.381905% |
| B | 5861 | 722 | 12.318717% |
| C | 5863 | 57 | 0.972199% |
| D | 5861 | 170 | 2.900529% |
Noise dominated data is calculated using 1-second bins in cleaned event files. If a bin has >2000 counts, and if more than 50% of those come from <1% of pixels, then it is considered to be noise-dominated and hence unusable.
| Quadrant | # 1 sec bins | Bins with >0 counts | Bins with >2000 counts | High rate bins dominated by noise | Noise dominated (total time) | Noise dominated (detector-on time) | Marked lightcurve |
|---|---|---|---|---|---|---|---|
| A | 7207 | 5854 | 3370 | 3370 | 46.76% | 57.57% | 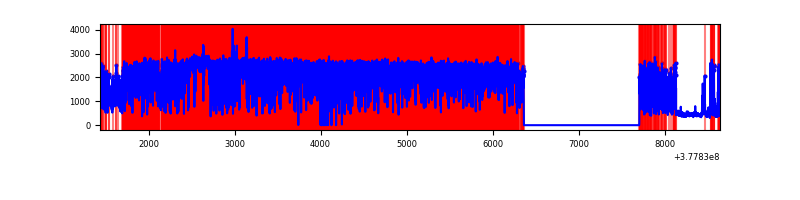 |
| B | 7206 | 5864 | 631 | 631 | 8.76% | 10.76% | 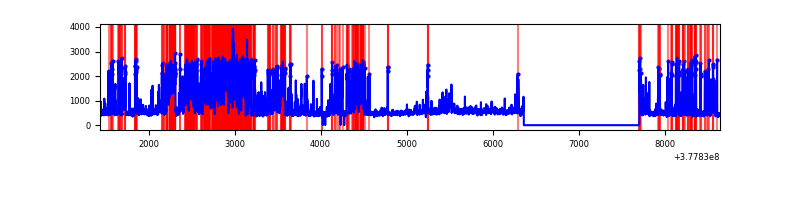 |
| C | 7206 | 5864 | 46 | 46 | 0.64% | 0.78% | 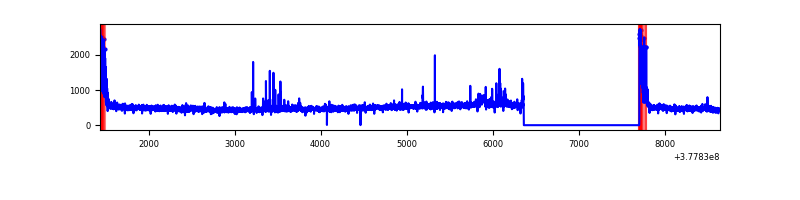 |
| D | 7207 | 5865 | 166 | 166 | 2.30% | 2.83% | 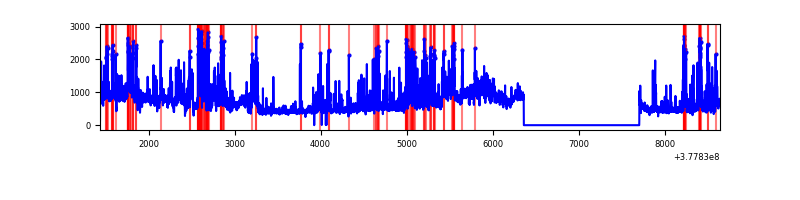 |
Top three noisy pixels from each quadrant. If the there are fewer than three noisy pixels in the level2.evt file, extra rows are filled as -1
| Pixel properties | Quadrant properties | ||||||
|---|---|---|---|---|---|---|---|
| Quadrant | DetID | PixID | Counts | Sigma | Mean | Median | Sigma |
| A | 15 | 169 | 8156805 | 79401.42 | 513 | 504 | 102.7 |
| A | 15 | 237 | 986778 | 9601.36 | 513 | 504 | 102.7 |
| A | 13 | 254 | 8627 | 79.08 | 513 | 504 | 102.7 |
| B | 5 | 255 | 1433119 | 11546.17 | 648 | 632 | 124.1 |
| B | 5 | 172 | 1065246 | 8581.03 | 648 | 632 | 124.1 |
| B | 15 | 222 | 52482 | 417.92 | 648 | 632 | 124.1 |
| C | 15 | 214 | 270690 | 1782.05 | 653 | 657 | 151.5 |
| C | 0 | 10 | 192409 | 1265.45 | 653 | 657 | 151.5 |
| C | 0 | 239 | 26619 | 171.33 | 653 | 657 | 151.5 |
| D | 8 | 195 | 770393 | 4405.13 | 643 | 632 | 174.7 |
| D | 7 | 80 | 673743 | 3852.03 | 643 | 632 | 174.7 |
| D | 2 | 250 | 376742 | 2152.37 | 643 | 632 | 174.7 |
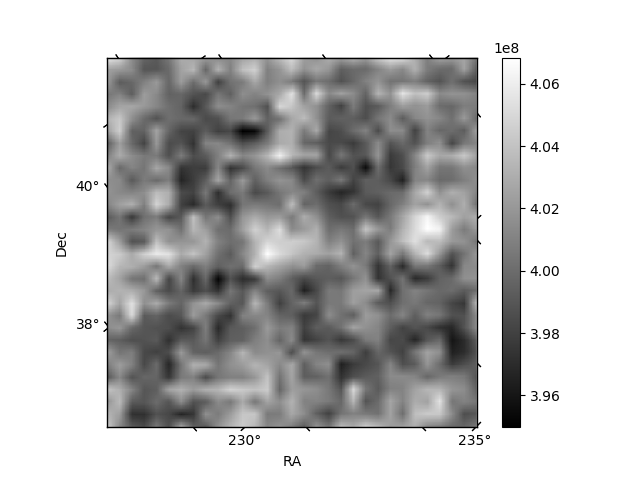
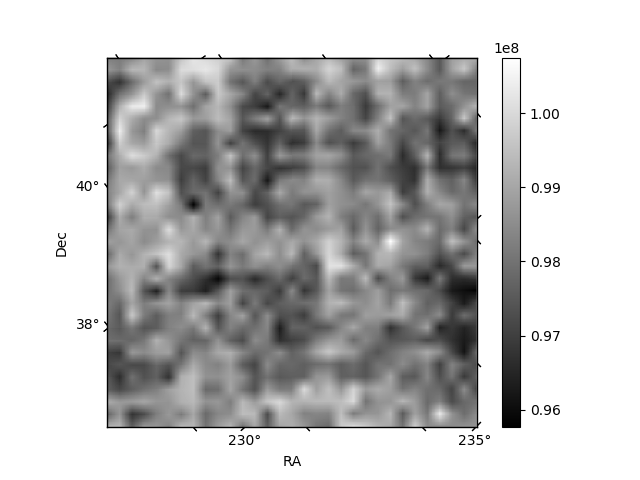
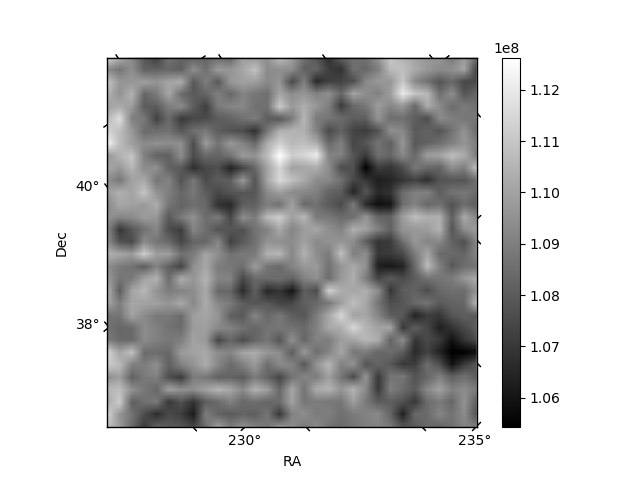
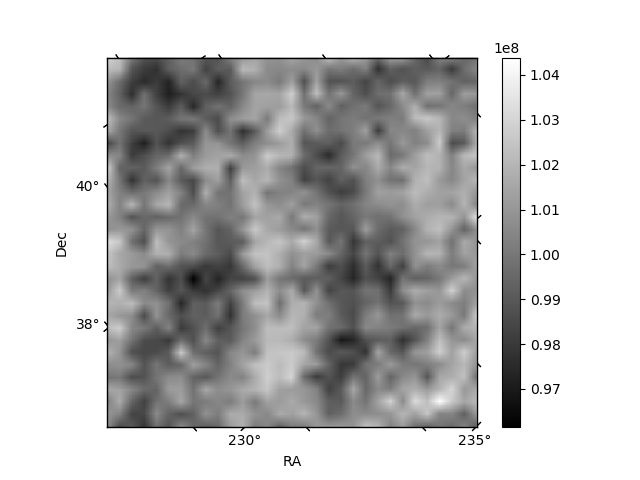
Histogram calculated using DETX and DETY for each event in the final _common_clean file
| Quadrant A | 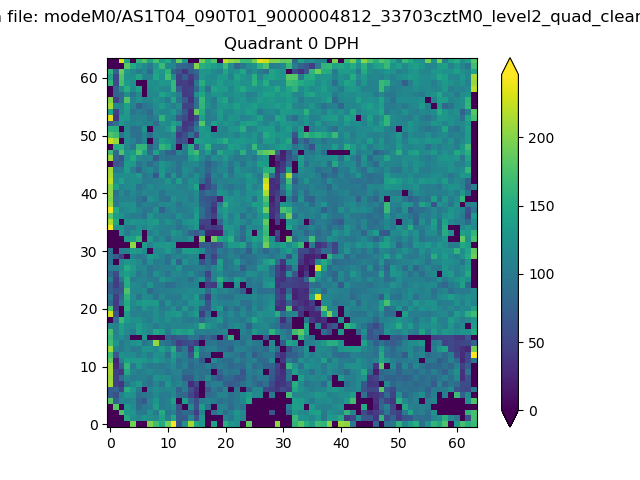 |
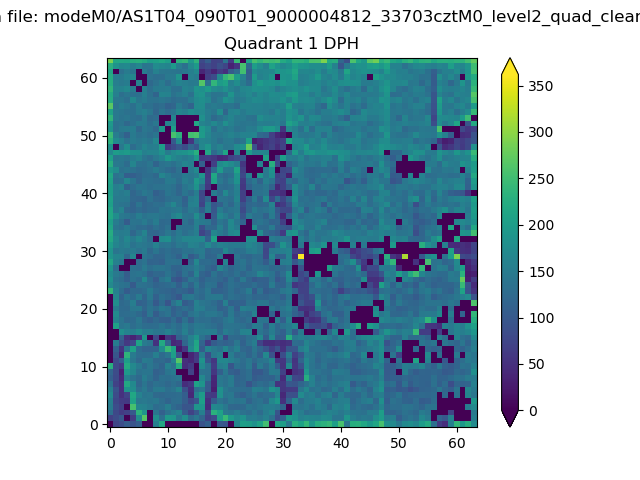 |
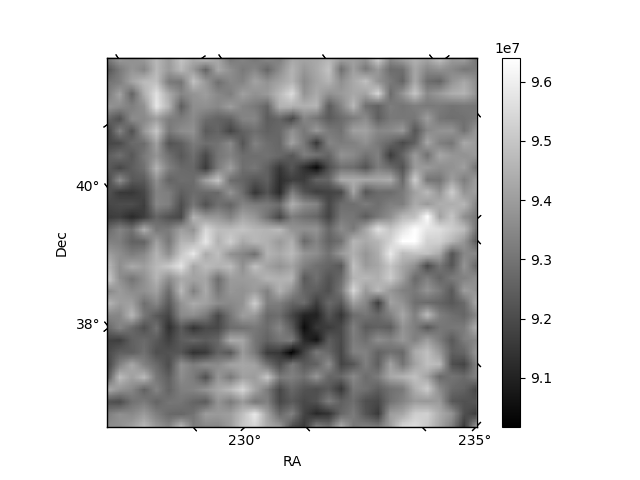
Quadrant B |
|---|---|---|---|
| Quadrant D |  |
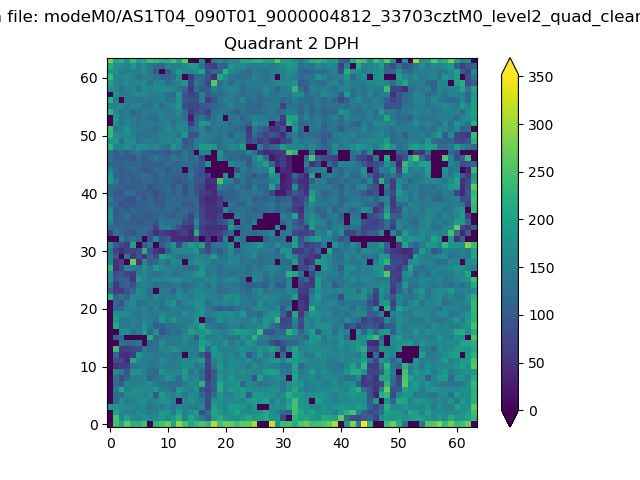 |
Quadrant C |
| Plot type | Count rate plots | Images |
|---|---|---|
| Comparison with Poisson distribution Blue bars denote a histogram of data divided into 1 sec bins. Red curve is a Poisson curve with rate = median count rate of data. |
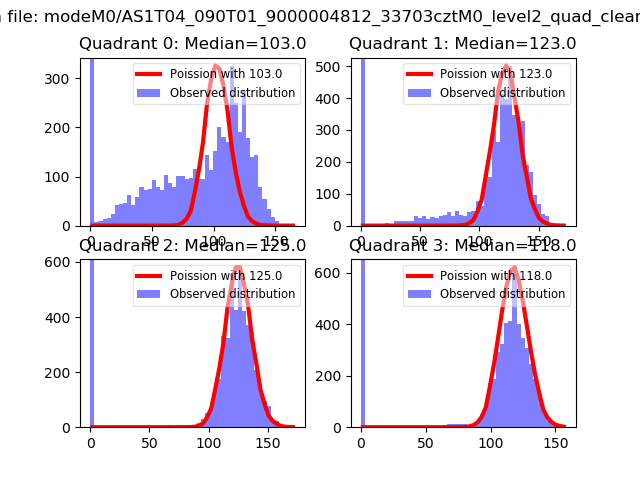 |
 |
| Quadrant-wise count rates Data is divided into 100 sec bins |
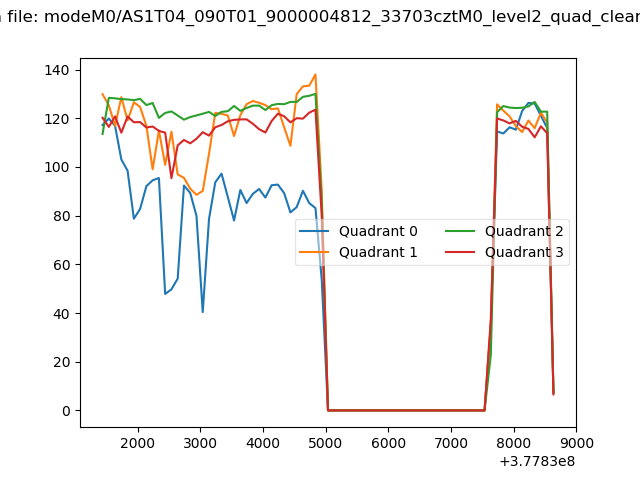 |
|
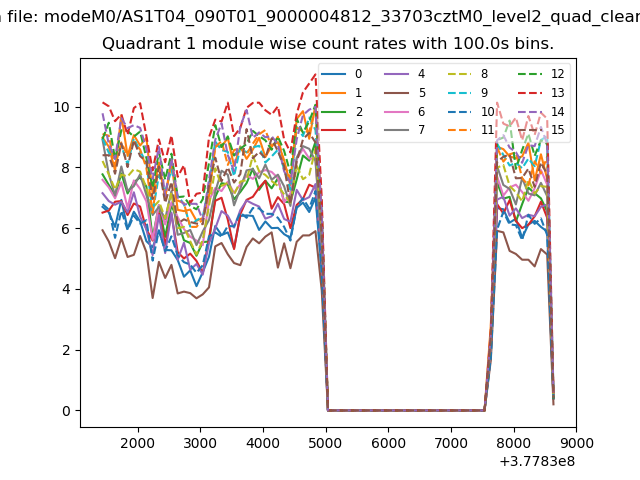
| Module-wise count rates for Quadrant A Data is divided into 100 sec bins |
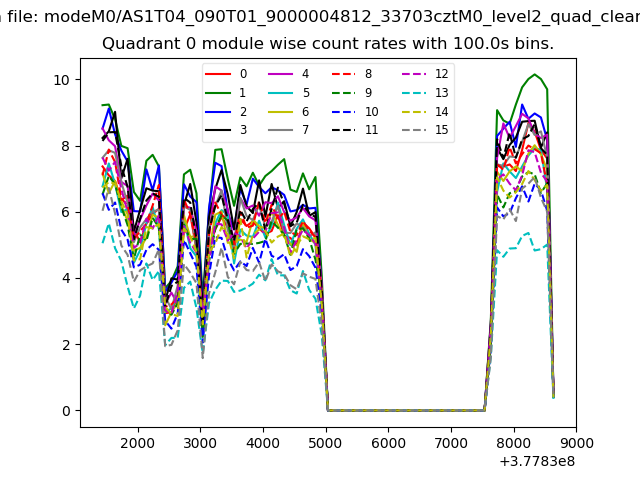 |
 |
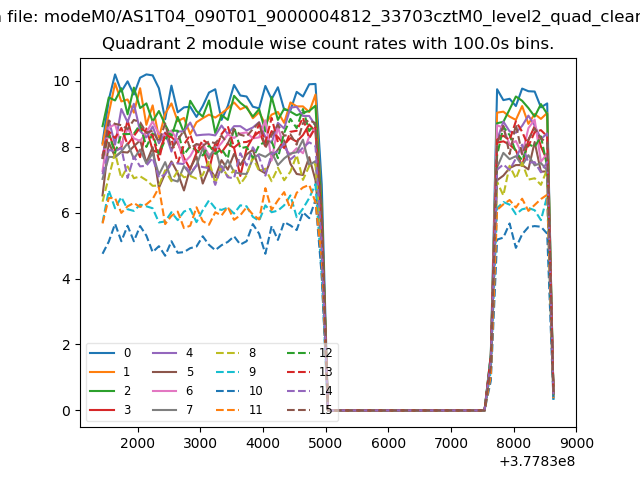
| Module-wise count rates for Quadrant B Data is divided into 100 sec bins |
 |
 |
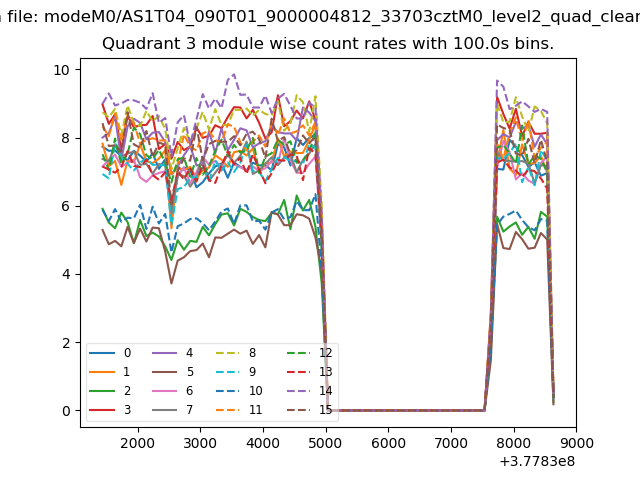
| Module-wise count rates for Quadrant C Data is divided into 100 sec bins |
 |
 |
| Module-wise count rates for Quadrant D Data is divided into 100 sec bins |
 |
 |
| Parameter | Plot |
|---|---|
| CZT HV Monitor |  |
| D_VDD |  |
| Temperature 1 | 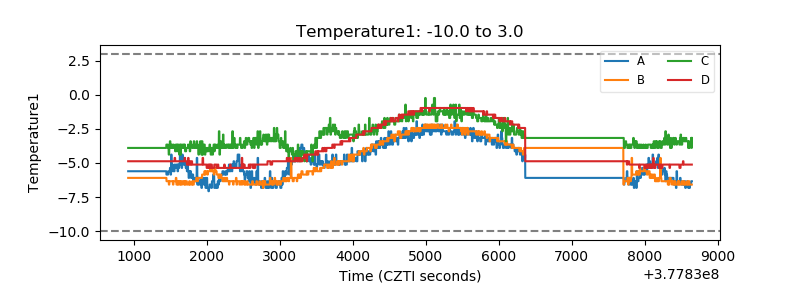 |
| Veto HV Monitor | 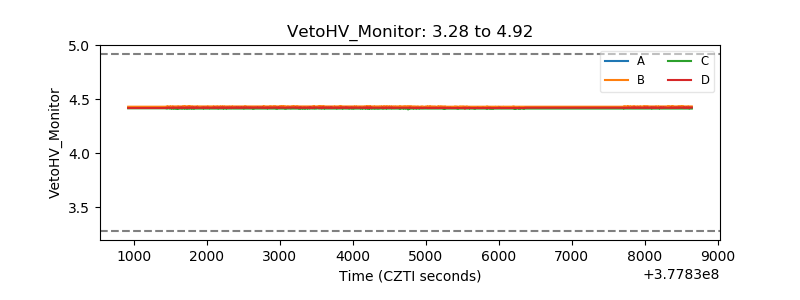 |
| Veto LLD |  |
| Alpha Counter | 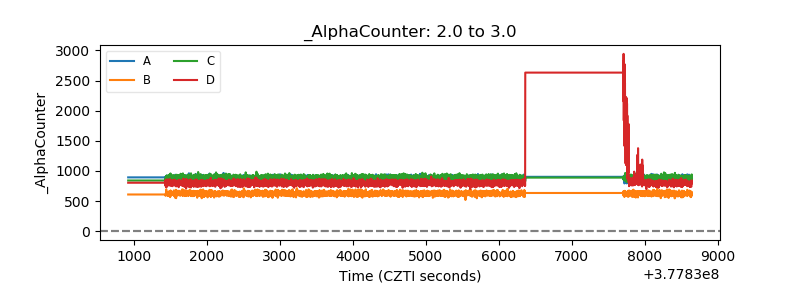 |
| _CPM_Rate | 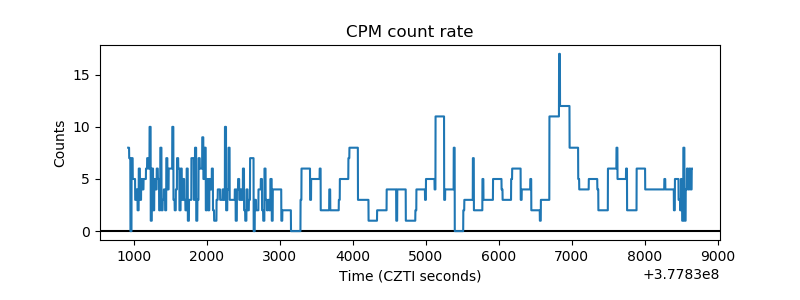 |
| CZT Counter | 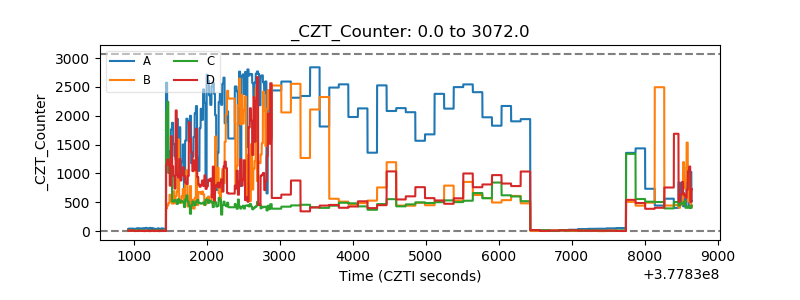 |
| +2.5 Volts monitor |  |
| +5 Volts monitor |  |
| _ROLL_ROT | 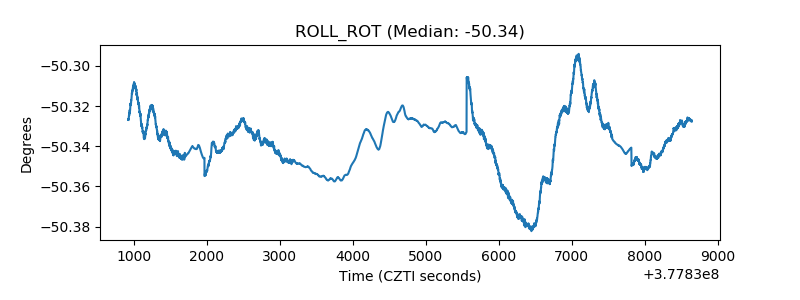 |
| _Roll_DEC | 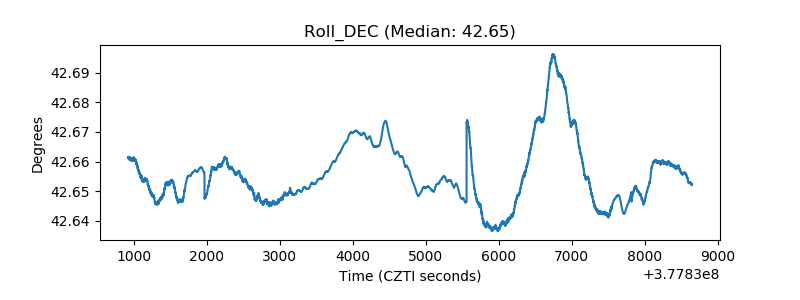 |
| _Roll_RA | 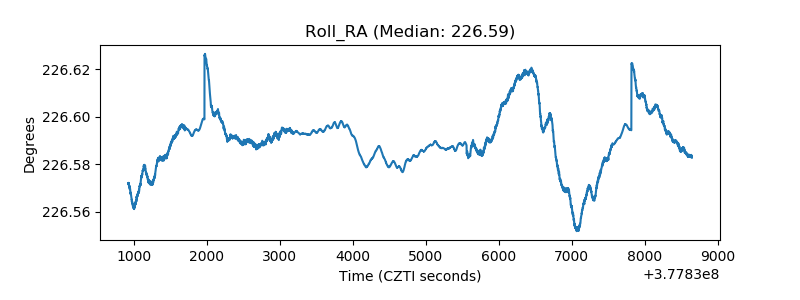 |
| Veto Counter | 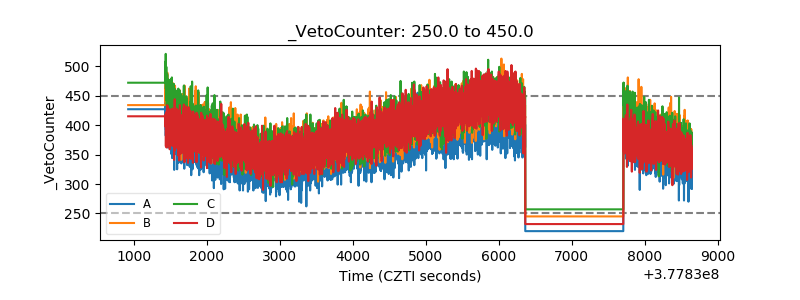 |