| Param | Original file | Final file |
|---|---|---|
| Filename | modeM0/AS1T04_090T01_9000004812_33704cztM0_level2.evt | modeM0/AS1T04_090T01_9000004812_33704cztM0_level2_quad_clean.evt |
| Size (bytes) | 589,942,080 | 78,019,200 |
| Size | 562.6 MB | 74.4 MB |
| Events in quadrant A | 4,072,133 | 493,359 |
| Events in quadrant B | 4,234,112 | 484,861 |
| Events in quadrant C | 3,117,330 | 502,082 |
| Events in quadrant D | 6,041,126 | 467,027 |
| Mode M9 | |||
|---|---|---|---|
| Quadrant | BADHDUFLAG | Total packets | Discarded packets |
| A | 0 | 23 | 0 |
| B | 0 | 23 | 0 |
| C | 0 | 23 | 0 |
| D | 0 | 24 | 0 |
| Mode M0 | |||
|---|---|---|---|
| Quadrant | BADHDUFLAG | Total packets | Discarded packets |
| A | 0 | 16011 | 3 |
| B | 0 | 16451 | 2 |
| C | 0 | 12934 | 2 |
| D | 0 | 22086 | 2 |
| Mode SS | |||
|---|---|---|---|
| Quadrant | BADHDUFLAG | Total packets | Discarded packets |
| A | 0 | 122 | 0 |
| B | 0 | 122 | 0 |
| C | 0 | 122 | 0 |
| D | 0 | 122 | 0 |
| Quadrant | Total seconds | Saturated seconds | Saturation percentage |
|---|---|---|---|
| A | 5934 | 285 | 4.802831% |
| B | 5934 | 483 | 8.139535% |
| C | 5934 | 54 | 0.910010% |
| D | 5934 | 543 | 9.150657% |
Noise dominated data is calculated using 1-second bins in cleaned event files. If a bin has >2000 counts, and if more than 50% of those come from <1% of pixels, then it is considered to be noise-dominated and hence unusable.
| Quadrant | # 1 sec bins | Bins with >0 counts | Bins with >2000 counts | High rate bins dominated by noise | Noise dominated (total time) | Noise dominated (detector-on time) | Marked lightcurve |
|---|---|---|---|---|---|---|---|
| A | 7247 | 5934 | 261 | 261 | 3.60% | 4.40% | 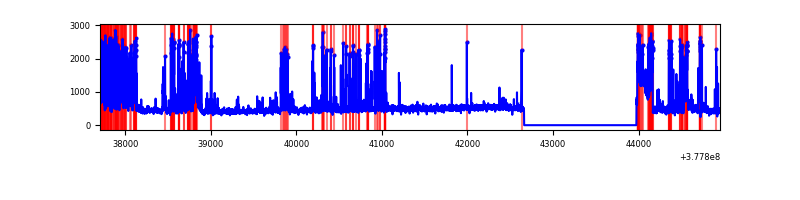 |
| B | 7247 | 5935 | 373 | 373 | 5.15% | 6.28% | 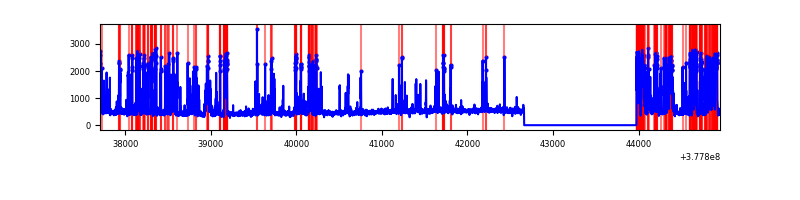 |
| C | 7247 | 5935 | 46 | 46 | 0.63% | 0.78% | 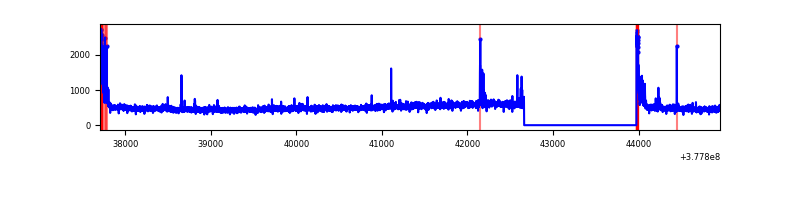 |
| D | 7247 | 5935 | 405 | 405 | 5.59% | 6.82% | 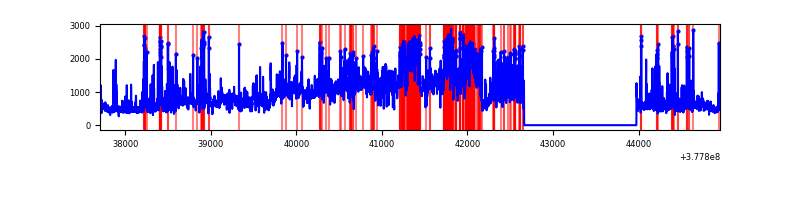 |
Top three noisy pixels from each quadrant. If the there are fewer than three noisy pixels in the level2.evt file, extra rows are filled as -1
| Pixel properties | Quadrant properties | ||||||
|---|---|---|---|---|---|---|---|
| Quadrant | DetID | PixID | Counts | Sigma | Mean | Median | Sigma |
| A | 15 | 169 | 747675 | 5551.27 | 675 | 661 | 134.6 |
| A | 15 | 237 | 704252 | 5228.58 | 675 | 661 | 134.6 |
| A | 13 | 254 | 11088 | 77.49 | 675 | 661 | 134.6 |
| B | 5 | 172 | 1490641 | 11837.3 | 657 | 642 | 125.9 |
| B | 15 | 85 | 87578 | 690.66 | 657 | 642 | 125.9 |
| B | 5 | 255 | 27359 | 212.25 | 657 | 642 | 125.9 |
| C | 15 | 214 | 273956 | 1805.97 | 659 | 665 | 151.3 |
| C | 0 | 10 | 176937 | 1164.84 | 659 | 665 | 151.3 |
| C | 3 | 233 | 42180 | 274.34 | 659 | 665 | 151.3 |
| D | 8 | 195 | 1950974 | 11264.52 | 636 | 623 | 173.1 |
| D | 7 | 80 | 490225 | 2827.76 | 636 | 623 | 173.1 |
| D | 2 | 250 | 292607 | 1686.39 | 636 | 623 | 173.1 |
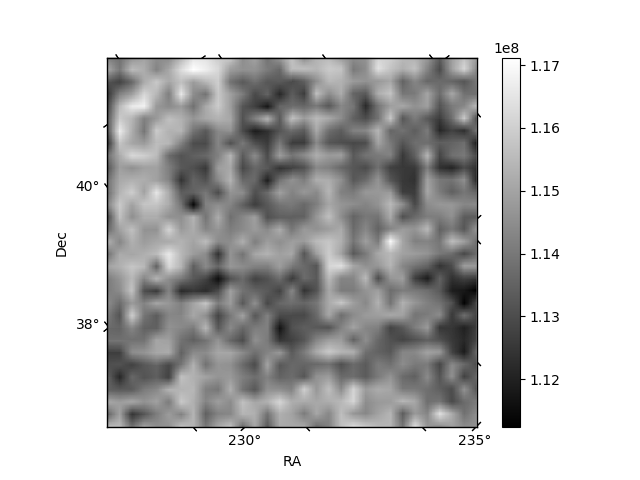
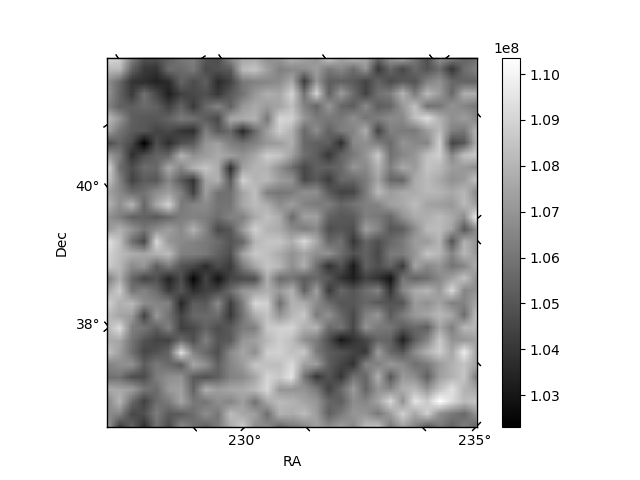
Histogram calculated using DETX and DETY for each event in the final _common_clean file
| Quadrant A | 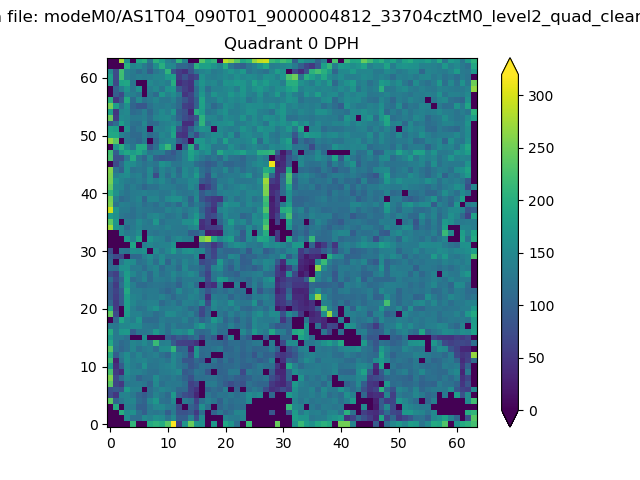 |
 |
Quadrant B |
|---|---|---|---|
| Quadrant D | 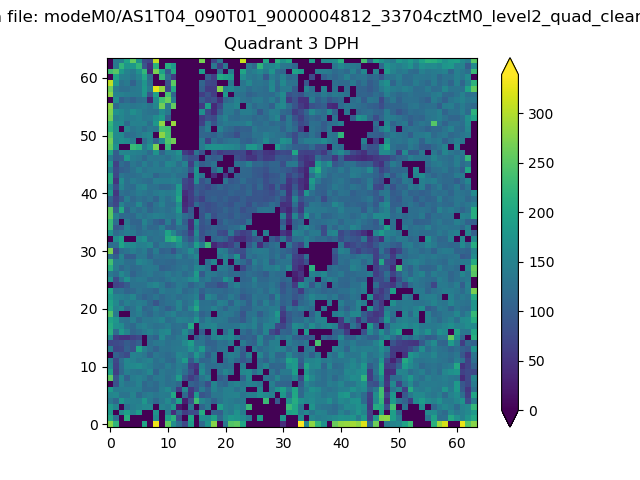 |
 |
Quadrant C |
| Plot type | Count rate plots | Images |
|---|---|---|
| Comparison with Poisson distribution Blue bars denote a histogram of data divided into 1 sec bins. Red curve is a Poisson curve with rate = median count rate of data. |
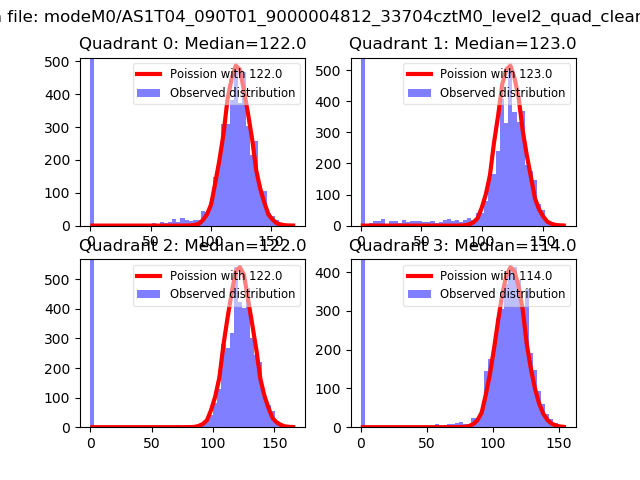 |
 |
| Quadrant-wise count rates Data is divided into 100 sec bins |
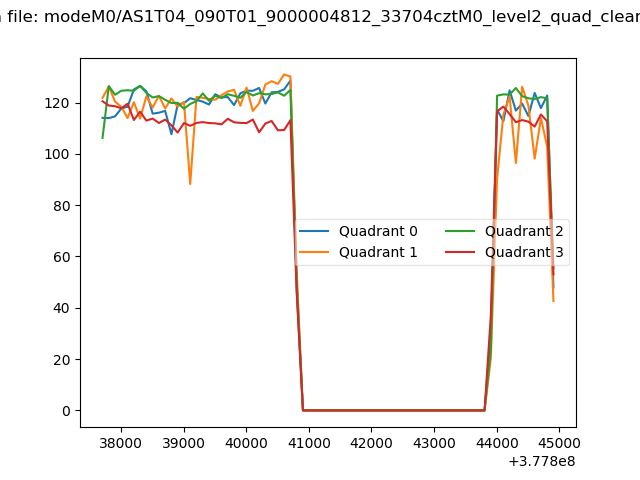 |
|
| Module-wise count rates for Quadrant A Data is divided into 100 sec bins |
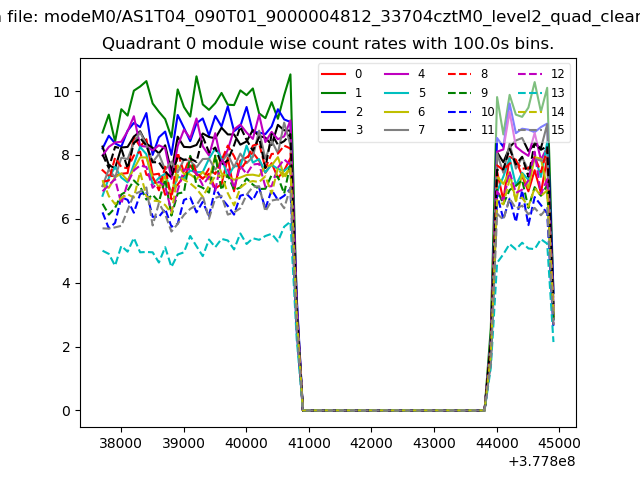 |
 |
| Module-wise count rates for Quadrant B Data is divided into 100 sec bins |
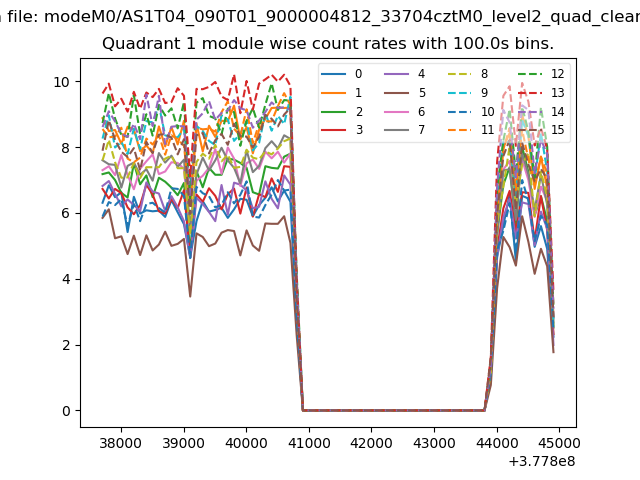 |
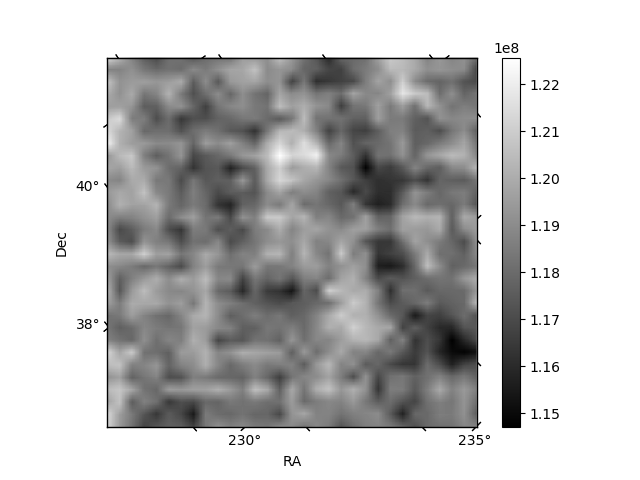 |
| Module-wise count rates for Quadrant C Data is divided into 100 sec bins |
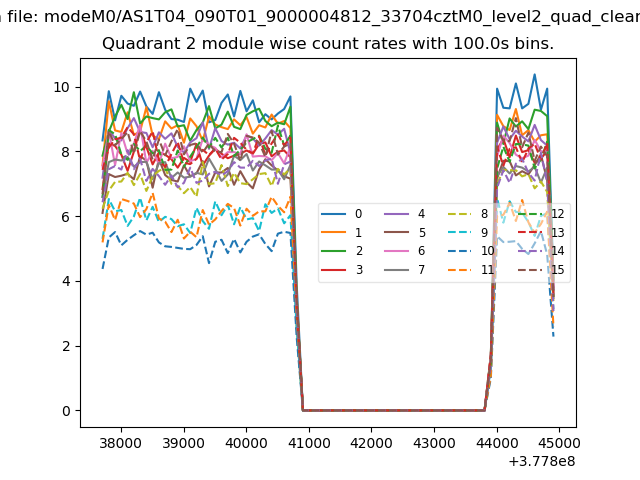 |
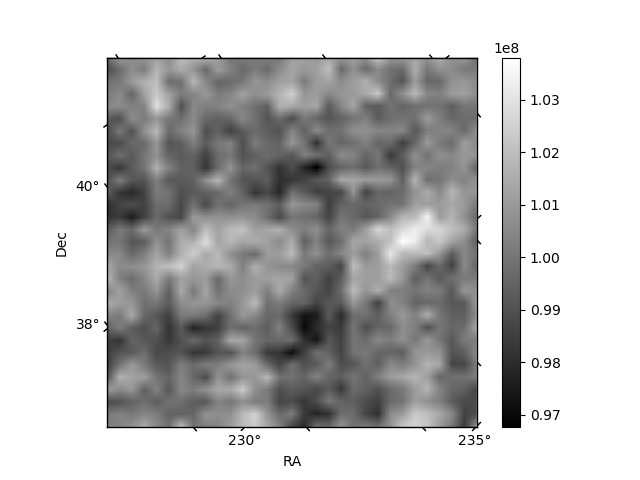 |
| Module-wise count rates for Quadrant D Data is divided into 100 sec bins |
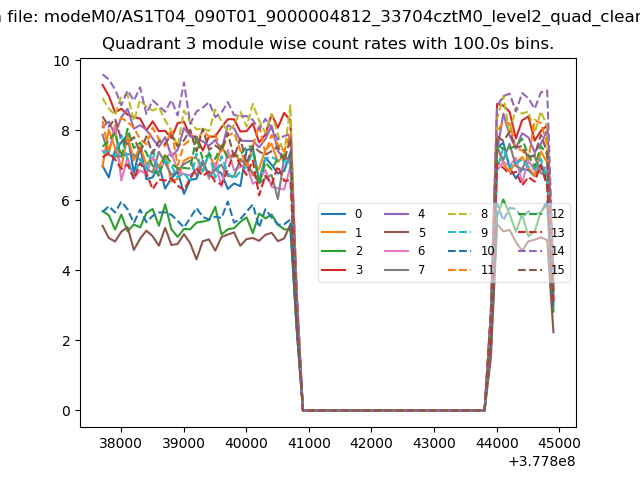 |
 |
| Parameter | Plot |
|---|---|
| CZT HV Monitor | 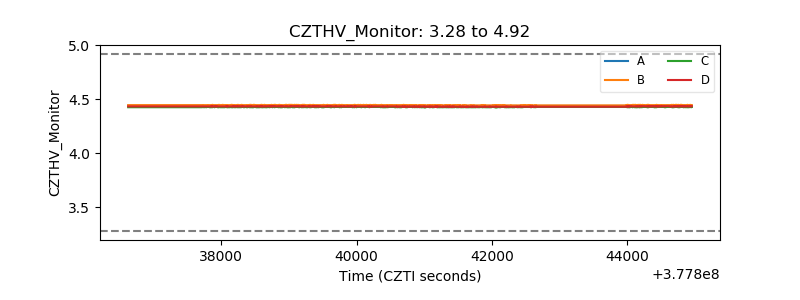 |
| D_VDD | 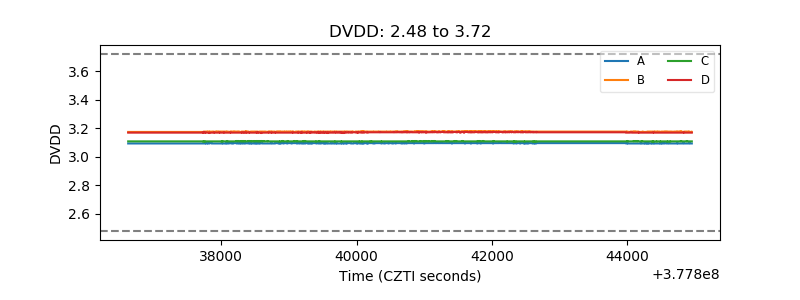 |
| Temperature 1 | 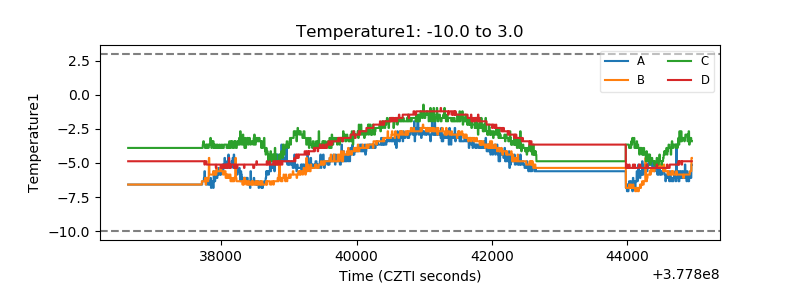 |
| Veto HV Monitor | 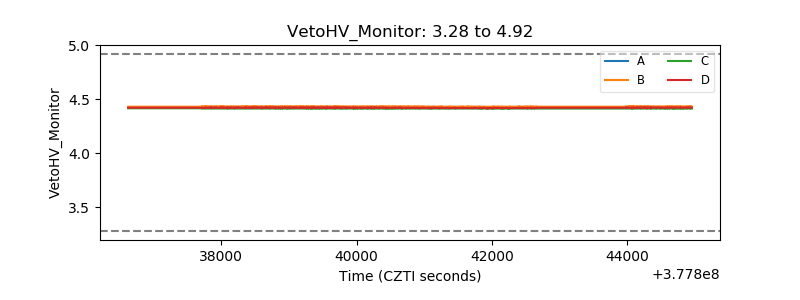 |
| Veto LLD | 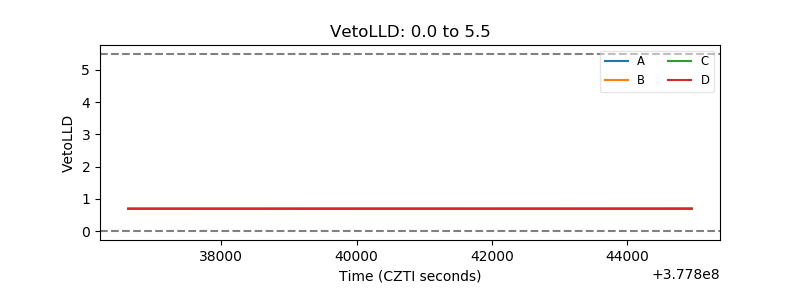 |
| Alpha Counter | 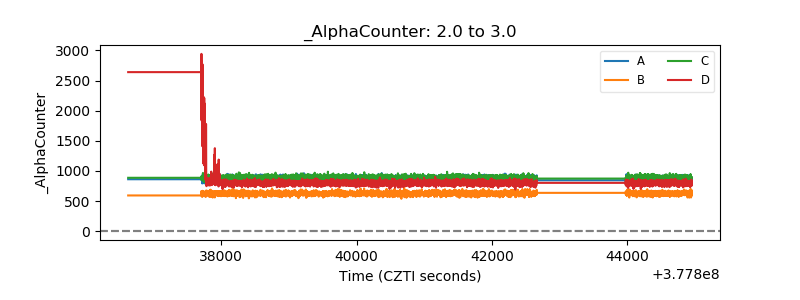 |
| _CPM_Rate | 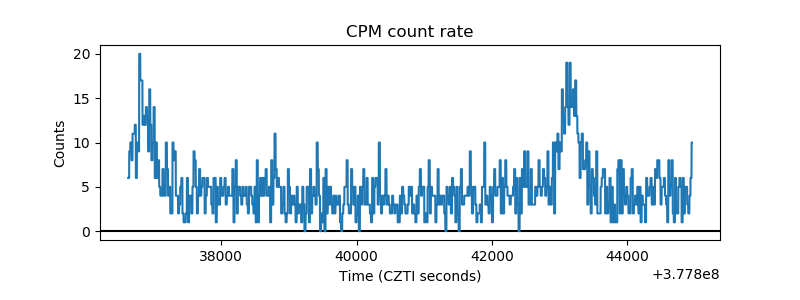 |
| CZT Counter |  |
| +2.5 Volts monitor |  |
| +5 Volts monitor | 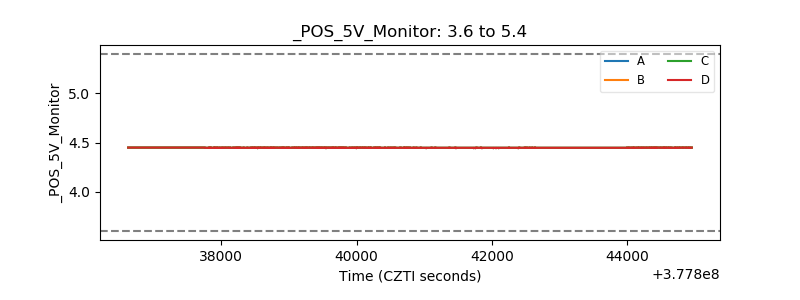 |
| _ROLL_ROT | 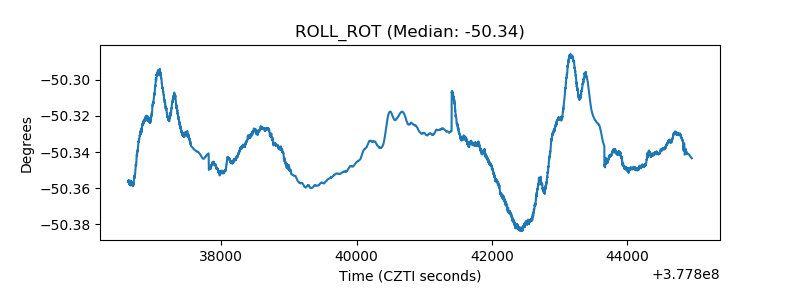 |
| _Roll_DEC | 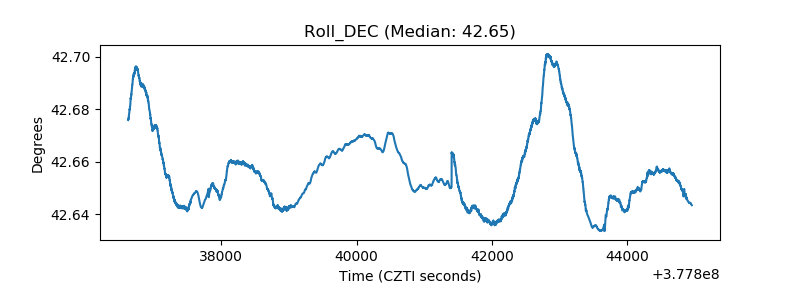 |
| _Roll_RA | 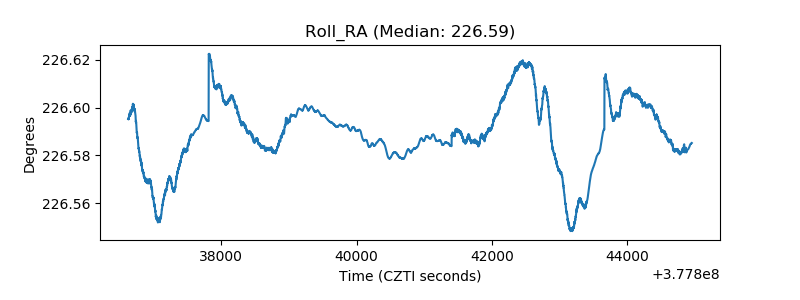 |
| Veto Counter | 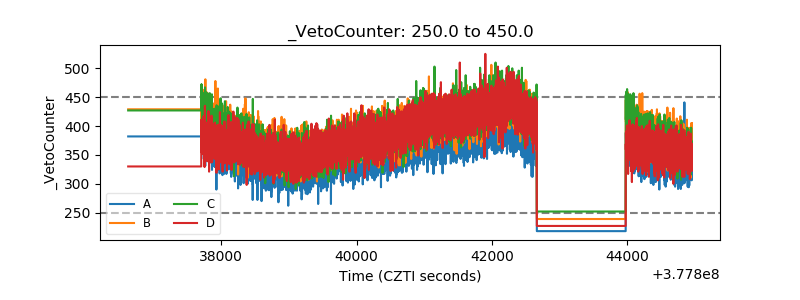 |