| Param | Original file | Final file |
|---|---|---|
| Filename | modeM0/AS1T04_090T01_9000004812_33707cztM0_level2.evt | modeM0/AS1T04_090T01_9000004812_33707cztM0_level2_quad_clean.evt |
| Size (bytes) | 439,534,080 | 46,923,840 |
| Size | 419.2 MB | 44.8 MB |
| Events in quadrant A | 2,873,974 | 296,745 |
| Events in quadrant B | 4,428,618 | 231,981 |
| Events in quadrant C | 2,419,809 | 300,103 |
| Events in quadrant D | 3,289,220 | 280,758 |
| Mode M0 | |||
|---|---|---|---|
| Quadrant | BADHDUFLAG | Total packets | Discarded packets |
| A | 0 | 11458 | 0 |
| B | 0 | 15985 | 0 |
| C | 0 | 9734 | 0 |
| D | 0 | 12865 | 0 |
| Mode SS | |||
|---|---|---|---|
| Quadrant | BADHDUFLAG | Total packets | Discarded packets |
| A | 0 | 88 | 0 |
| B | 0 | 88 | 0 |
| C | 0 | 88 | 0 |
| D | 0 | 88 | 0 |
| Quadrant | Total seconds | Saturated seconds | Saturation percentage |
|---|---|---|---|
| A | 4413 | 184 | 4.169499% |
| B | 4413 | 931 | 21.096760% |
| C | 4413 | 41 | 0.929073% |
| D | 4413 | 184 | 4.169499% |
Noise dominated data is calculated using 1-second bins in cleaned event files. If a bin has >2000 counts, and if more than 50% of those come from <1% of pixels, then it is considered to be noise-dominated and hence unusable.
| Quadrant | # 1 sec bins | Bins with >0 counts | Bins with >2000 counts | High rate bins dominated by noise | Noise dominated (total time) | Noise dominated (detector-on time) | Marked lightcurve |
|---|---|---|---|---|---|---|---|
| A | 4413 | 4413 | 156 | 156 | 3.54% | 3.54% | 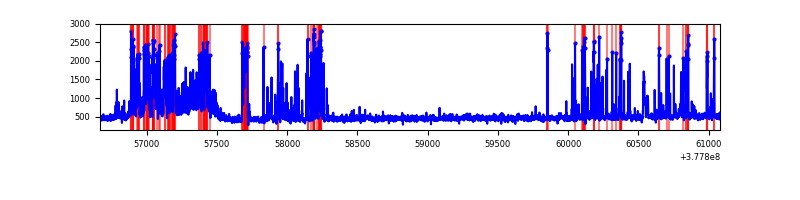 |
| B | 4413 | 4413 | 887 | 887 | 20.10% | 20.10% | 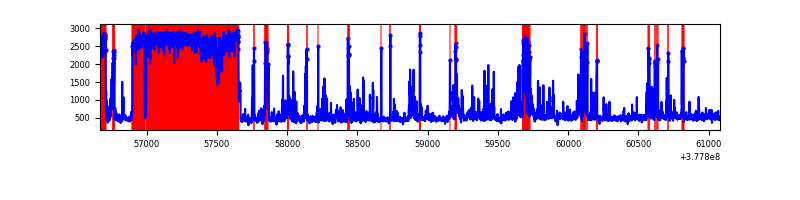 |
| C | 4412 | 4412 | 34 | 34 | 0.77% | 0.77% | 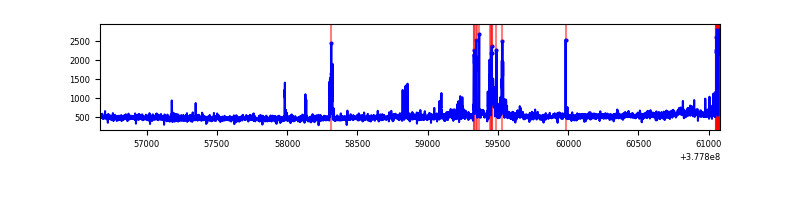 |
| D | 4412 | 4412 | 175 | 175 | 3.97% | 3.97% | 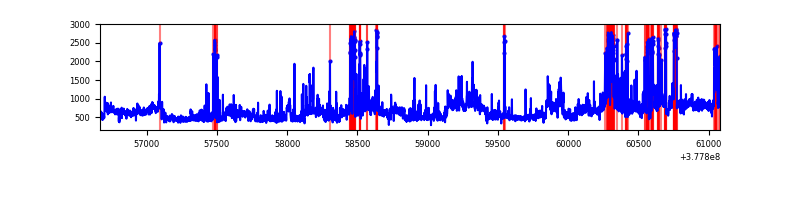 |
Top three noisy pixels from each quadrant. If the there are fewer than three noisy pixels in the level2.evt file, extra rows are filled as -1
| Pixel properties | Quadrant properties | ||||||
|---|---|---|---|---|---|---|---|
| Quadrant | DetID | PixID | Counts | Sigma | Mean | Median | Sigma |
| A | 15 | 237 | 908507 | 8900.67 | 507 | 497 | 102.0 |
| A | 13 | 254 | 8005 | 73.6 | 507 | 497 | 102.0 |
| A | 13 | 6 | 5101 | 45.13 | 507 | 497 | 102.0 |
| B | 5 | 200 | 1923012 | 22364.55 | 445 | 433 | 86.0 |
| B | 5 | 172 | 598793 | 6960.47 | 445 | 433 | 86.0 |
| B | 0 | 213 | 54871 | 633.25 | 445 | 433 | 86.0 |
| C | 15 | 214 | 200789 | 1727.11 | 497 | 502 | 116.0 |
| C | 14 | 254 | 188911 | 1624.68 | 497 | 502 | 116.0 |
| C | 14 | 67 | 26339 | 222.8 | 497 | 502 | 116.0 |
| D | 8 | 195 | 615442 | 5037.56 | 490 | 476 | 122.1 |
| D | 1 | 52 | 190177 | 1553.95 | 490 | 476 | 122.1 |
| D | 13 | 249 | 165388 | 1350.89 | 490 | 476 | 122.1 |
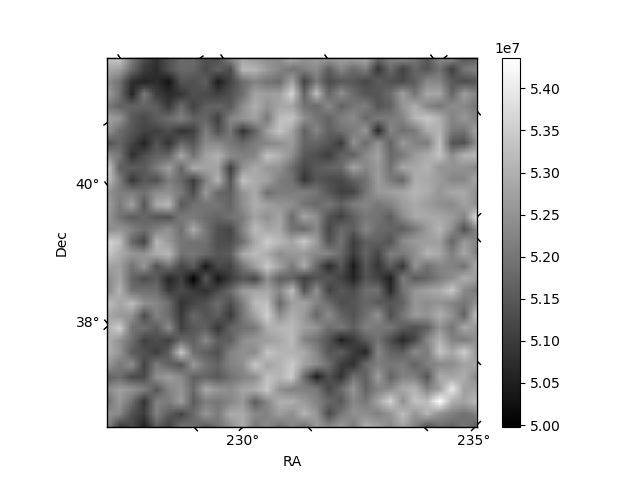
Histogram calculated using DETX and DETY for each event in the final _common_clean file
| Quadrant A | 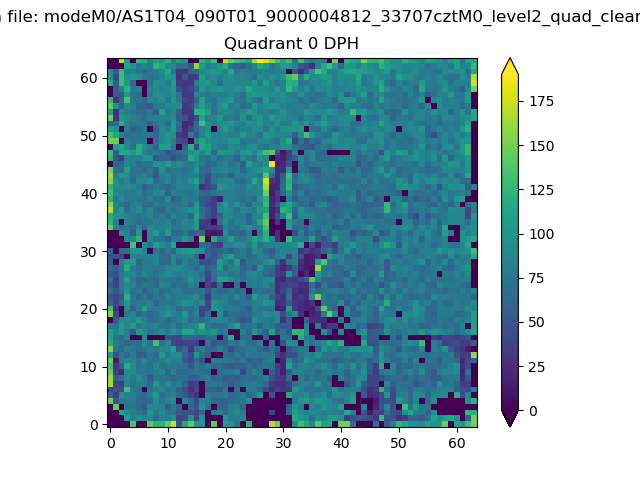 |
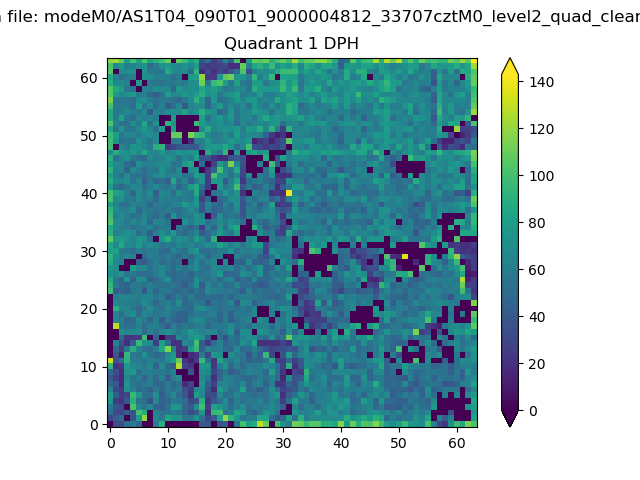 |
Quadrant B |
|---|---|---|---|
| Quadrant D | 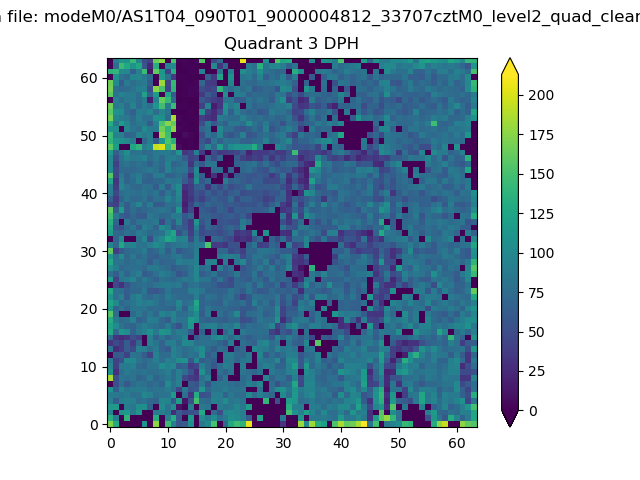 |
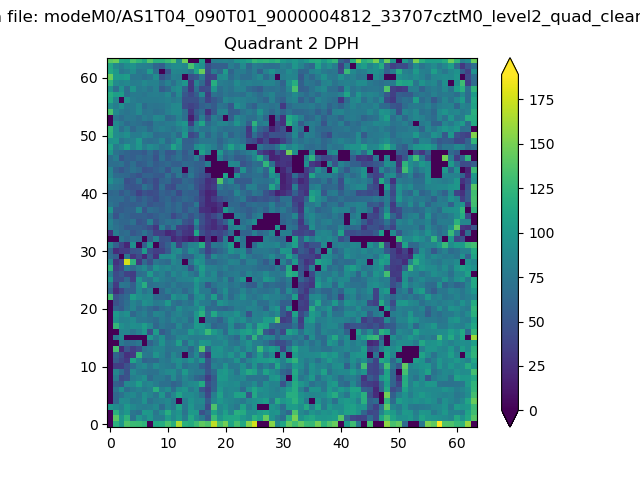 |
Quadrant C |
| Plot type | Count rate plots | Images |
|---|---|---|
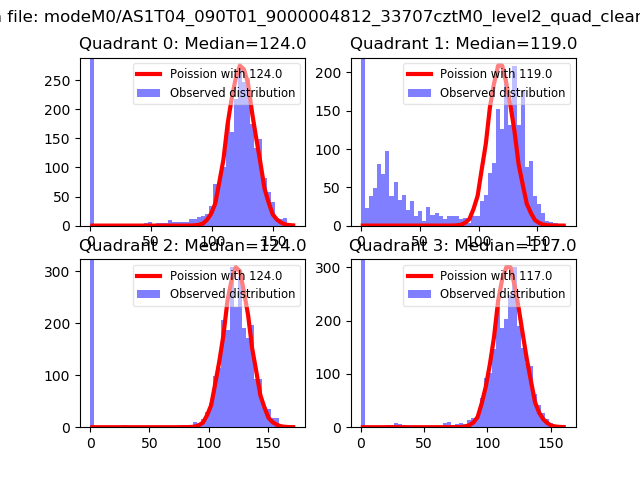
| Comparison with Poisson distribution Blue bars denote a histogram of data divided into 1 sec bins. Red curve is a Poisson curve with rate = median count rate of data. |
 |
 |
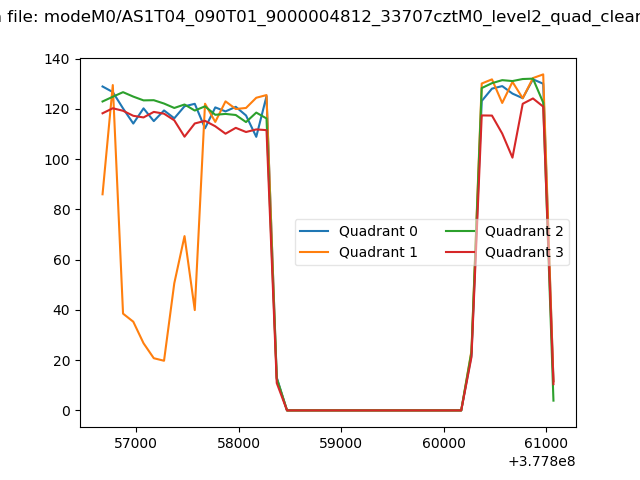
| Quadrant-wise count rates Data is divided into 100 sec bins |
 |
|
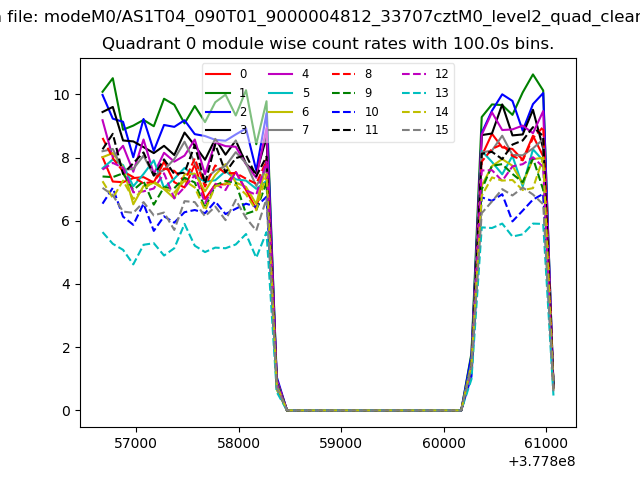
| Module-wise count rates for Quadrant A Data is divided into 100 sec bins |
 |
 |
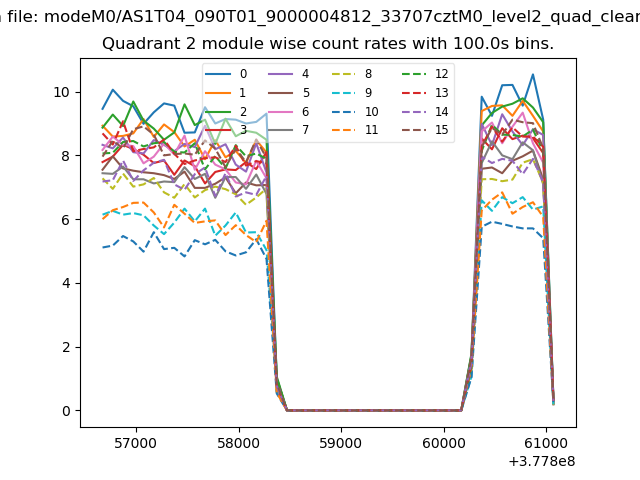
| Module-wise count rates for Quadrant B Data is divided into 100 sec bins |
 |
 |
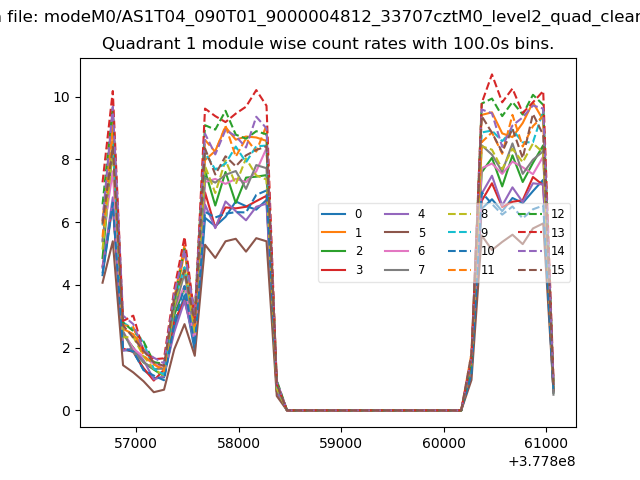
| Module-wise count rates for Quadrant C Data is divided into 100 sec bins |
 |
 |
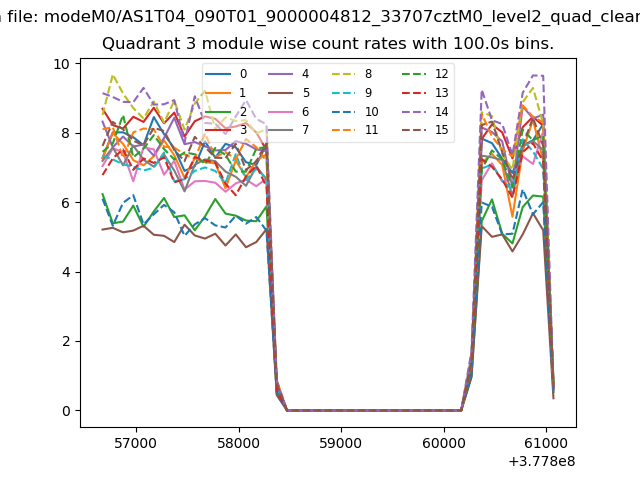
| Module-wise count rates for Quadrant D Data is divided into 100 sec bins |
 |
 |
| Parameter | Plot |
|---|---|
| CZT HV Monitor | 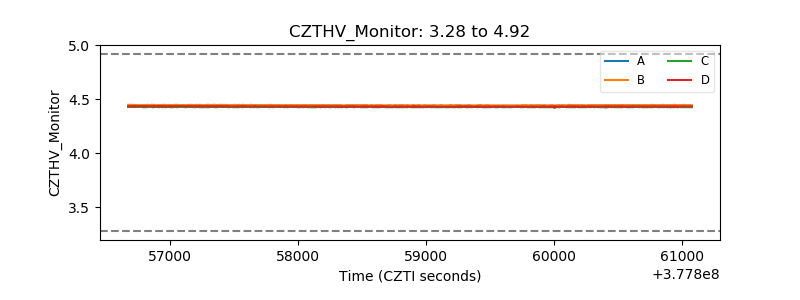 |
| D_VDD | 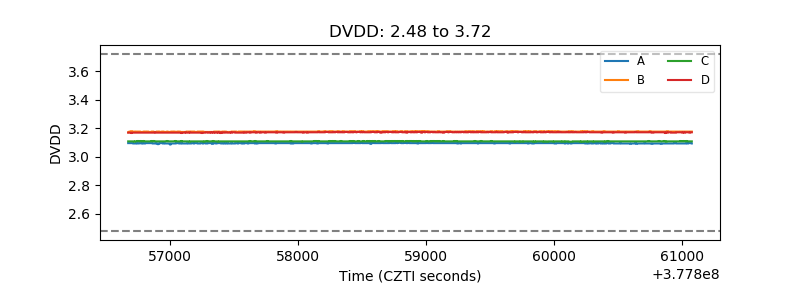 |
| Temperature 1 | 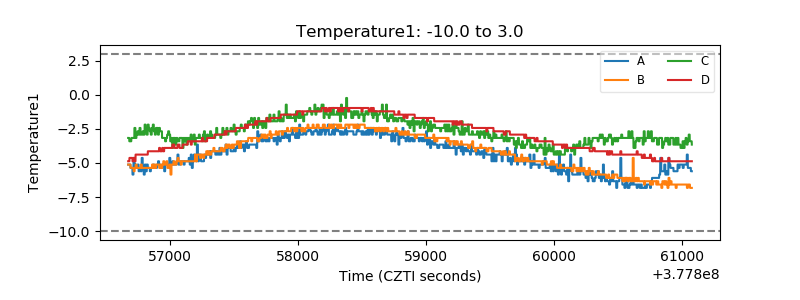 |
| Veto HV Monitor | 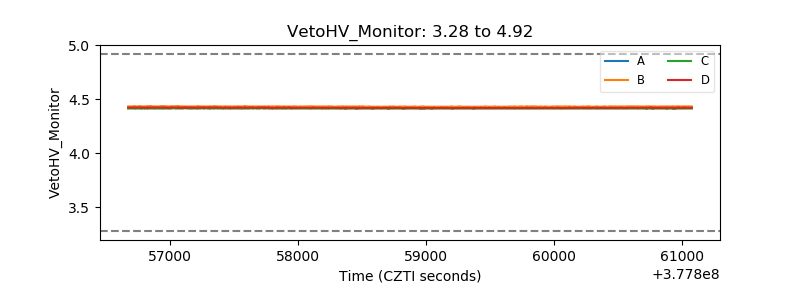 |
| Veto LLD | 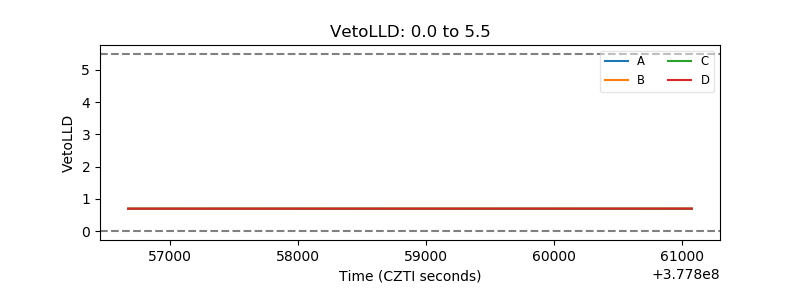 |
| Alpha Counter | 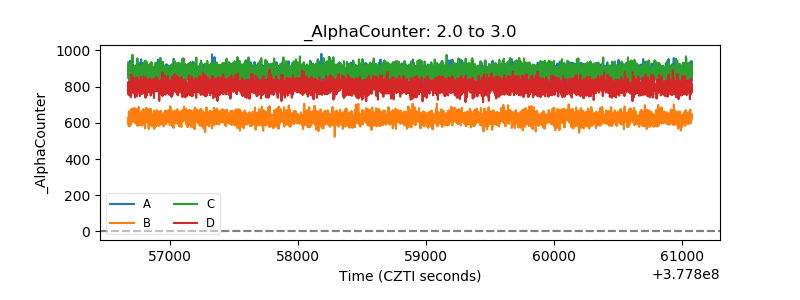 |
| _CPM_Rate | 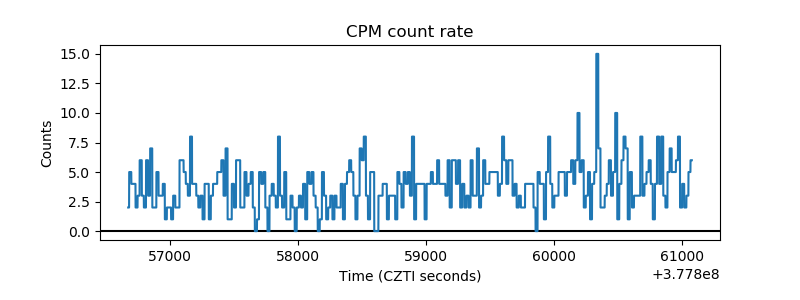 |
| CZT Counter |  |
| +2.5 Volts monitor |  |
| +5 Volts monitor |  |
| _ROLL_ROT | 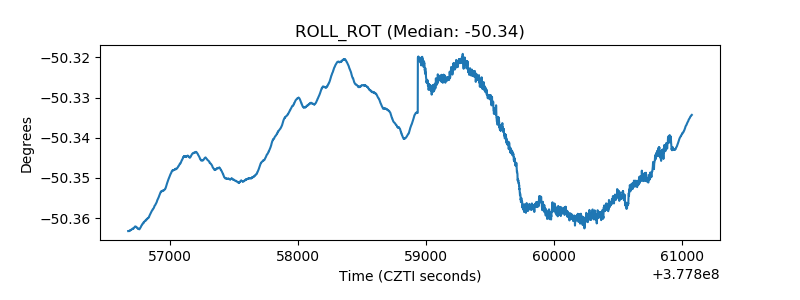 |
| _Roll_DEC | 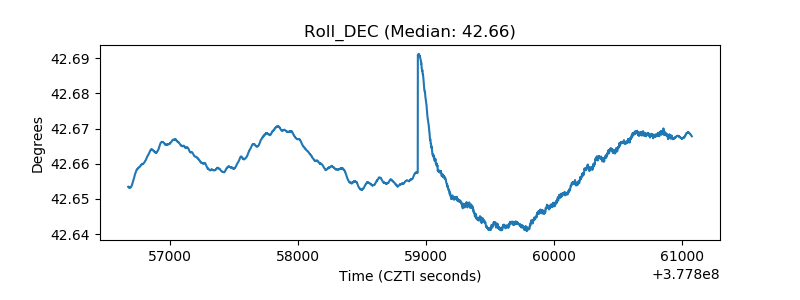 |
| _Roll_RA |  |
| Veto Counter | 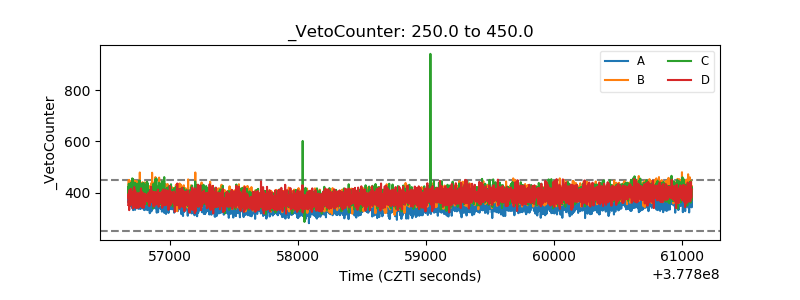 |