| Param | Original file | Final file |
|---|---|---|
| Filename | modeM0/AS1A11_086T01_9000004816_33718cztM0_level2.evt | modeM0/AS1A11_086T01_9000004816_33718cztM0_level2_quad_clean.evt |
| Size (bytes) | 117,532,800 | 18,048,960 |
| Size | 112.1 MB | 17.2 MB |
| Events in quadrant A | 873,813 | 113,099 |
| Events in quadrant B | 738,122 | 112,162 |
| Events in quadrant C | 765,581 | 112,699 |
| Events in quadrant D | 1,081,240 | 101,107 |
| Mode SS | |||
|---|---|---|---|
| Quadrant | BADHDUFLAG | Total packets | Discarded packets |
| A | 0 | 56 | 24 |
| B | 0 | 57 | 25 |
| C | 0 | 56 | 28 |
| D | 0 | 57 | 27 |
| Mode M9 | |||
|---|---|---|---|
| Quadrant | BADHDUFLAG | Total packets | Discarded packets |
| A | 0 | 13 | 10 |
| B | 0 | 14 | 14 |
| C | 0 | 13 | 11 |
| D | 0 | 13 | 13 |
| Mode M0 | |||
|---|---|---|---|
| Quadrant | BADHDUFLAG | Total packets | Discarded packets |
| A | 0 | 7656 | 4062 |
| B | 0 | 6055 | 2918 |
| C | 0 | 6344 | 3209 |
| D | 0 | 10996 | 6789 |
| Quadrant | Total seconds | Saturated seconds | Saturation percentage |
|---|---|---|---|
| A | 1428 | 110 | 7.703081% |
| B | 1475 | 8 | 0.542373% |
| C | 1467 | 4 | 0.272665% |
| D | 1354 | 112 | 8.271787% |
Noise dominated data is calculated using 1-second bins in cleaned event files. If a bin has >2000 counts, and if more than 50% of those come from <1% of pixels, then it is considered to be noise-dominated and hence unusable.
| Quadrant | # 1 sec bins | Bins with >0 counts | Bins with >2000 counts | High rate bins dominated by noise | Noise dominated (total time) | Noise dominated (detector-on time) | Marked lightcurve |
|---|---|---|---|---|---|---|---|
| A | 4021 | 1549 | 77 | 77 | 1.91% | 4.97% | 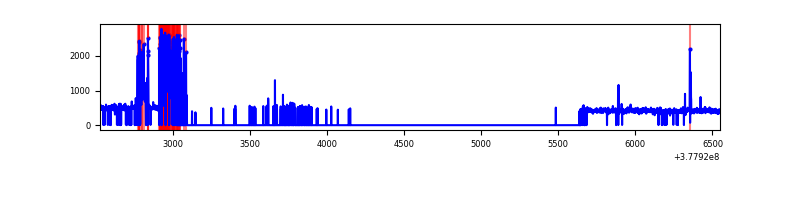 |
| B | 4021 | 1624 | 2 | 2 | 0.05% | 0.12% | 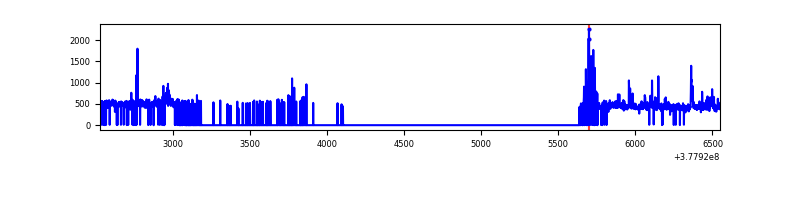 |
| C | 4021 | 1634 | 0 | 0 | 0.00% | 0.00% | 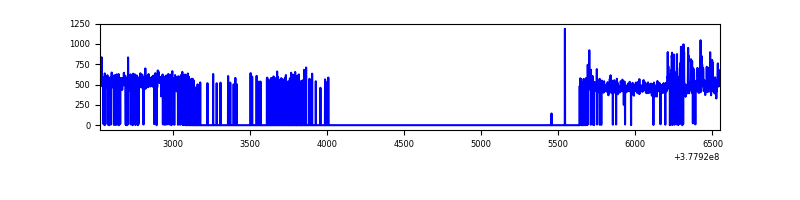 |
| D | 4021 | 1463 | 91 | 91 | 2.26% | 6.22% | 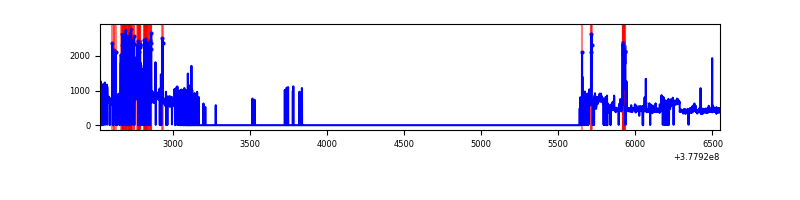 |
Top three noisy pixels from each quadrant. If the there are fewer than three noisy pixels in the level2.evt file, extra rows are filled as -1
| Pixel properties | Quadrant properties | ||||||
|---|---|---|---|---|---|---|---|
| Quadrant | DetID | PixID | Counts | Sigma | Mean | Median | Sigma |
| A | 15 | 169 | 243713 | 7255.34 | 157 | 154 | 33.6 |
| A | 15 | 237 | 16937 | 499.95 | 157 | 154 | 33.6 |
| A | 13 | 6 | 3807 | 108.82 | 157 | 154 | 33.6 |
| B | 5 | 172 | 39088 | 1115.66 | 168 | 164 | 34.9 |
| B | 0 | 213 | 16959 | 481.39 | 168 | 164 | 34.9 |
| B | 0 | 229 | 6349 | 177.28 | 168 | 164 | 34.9 |
| C | 15 | 214 | 68121 | 1713.66 | 163 | 164 | 39.7 |
| C | 9 | 54 | 30504 | 765.08 | 163 | 164 | 39.7 |
| C | 0 | 10 | 10746 | 266.84 | 163 | 164 | 39.7 |
| D | 2 | 250 | 244573 | 6037.88 | 143 | 139 | 40.5 |
| D | 8 | 195 | 147138 | 3631.09 | 143 | 139 | 40.5 |
| D | 1 | 52 | 59572 | 1468.07 | 143 | 139 | 40.5 |
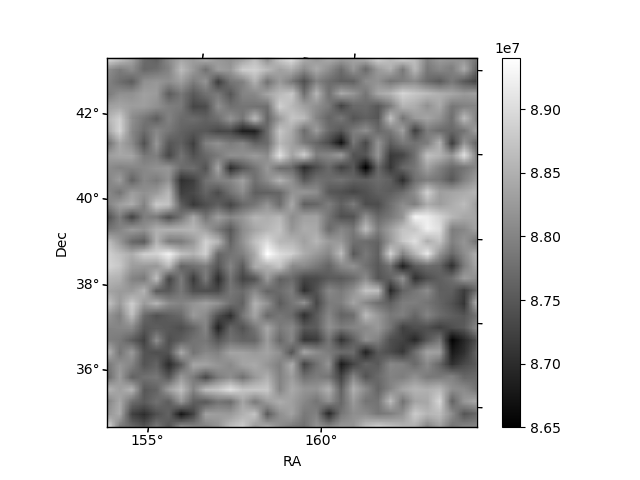
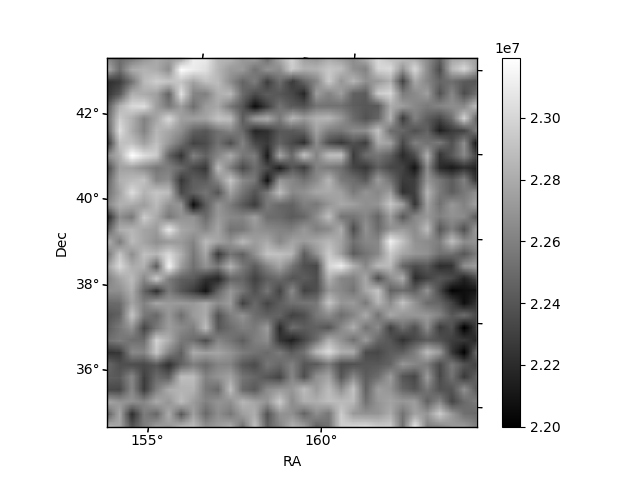
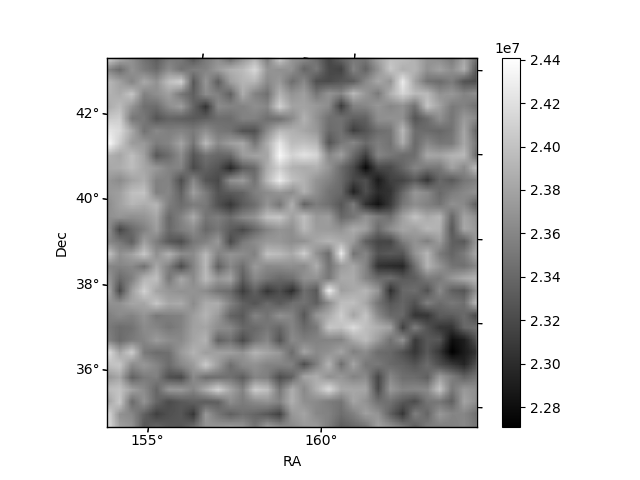
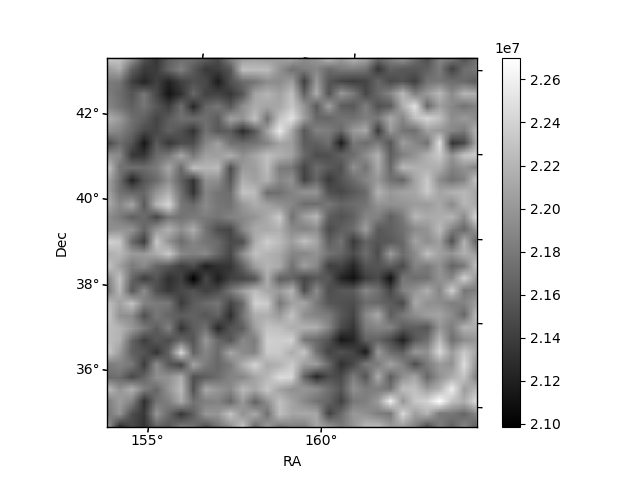
Histogram calculated using DETX and DETY for each event in the final _common_clean file
| Quadrant A | 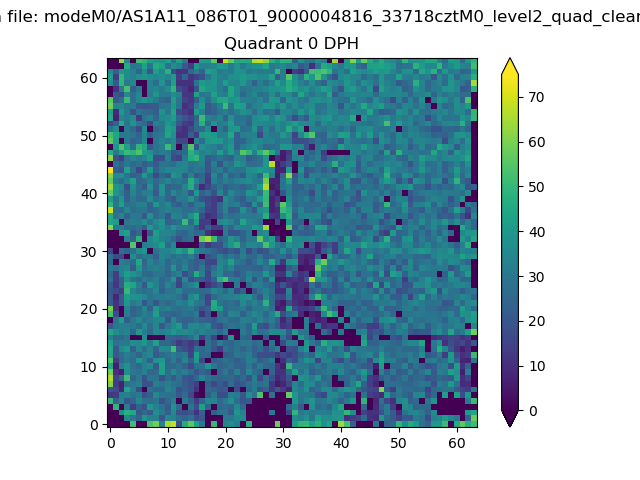 |
 |
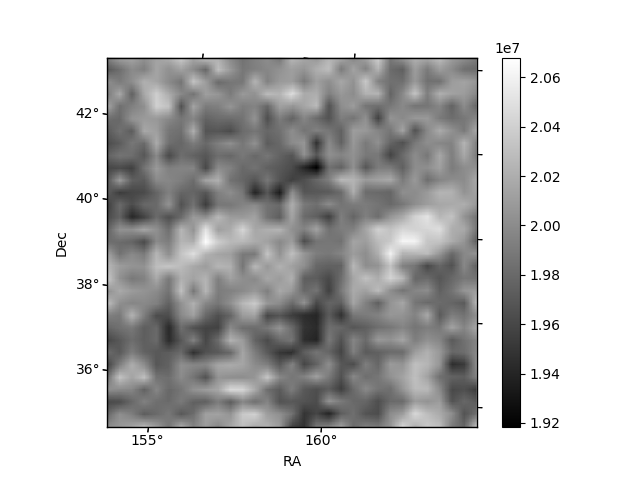
Quadrant B |
|---|---|---|---|
| Quadrant D | 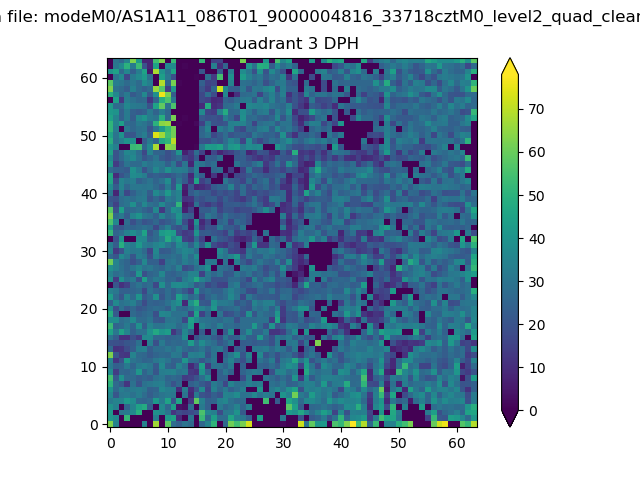 |
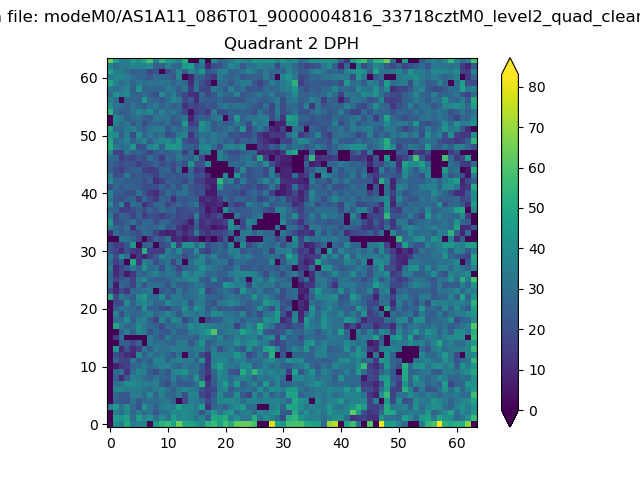 |
Quadrant C |
| Plot type | Count rate plots | Images |
|---|---|---|
| Comparison with Poisson distribution Blue bars denote a histogram of data divided into 1 sec bins. Red curve is a Poisson curve with rate = median count rate of data. |
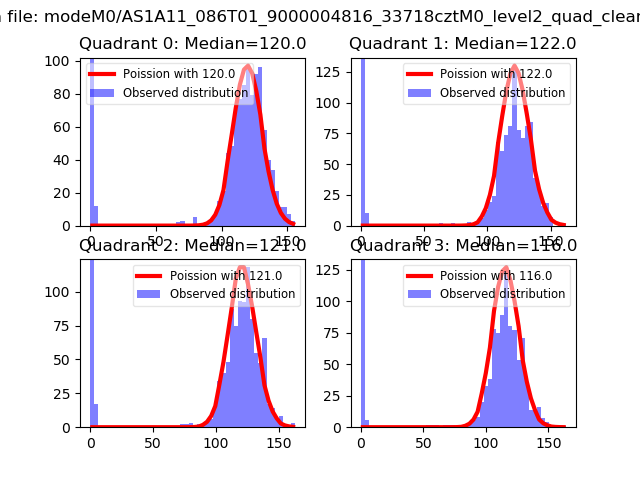 |
 |
| Quadrant-wise count rates Data is divided into 100 sec bins |
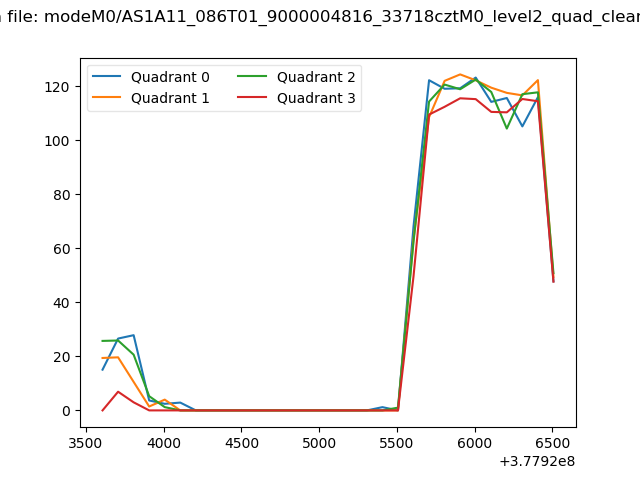 |
|
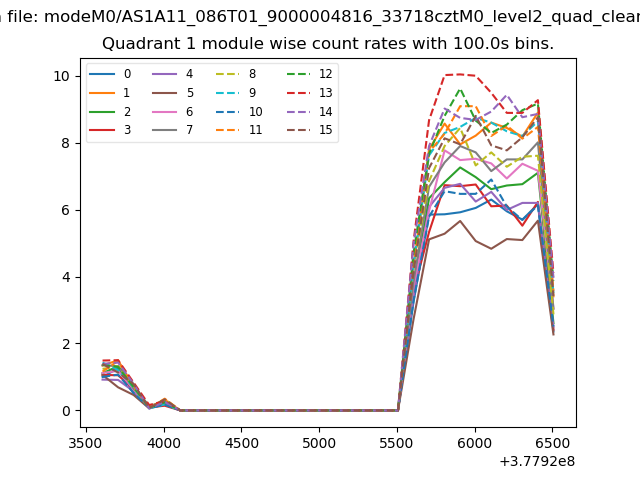
| Module-wise count rates for Quadrant A Data is divided into 100 sec bins |
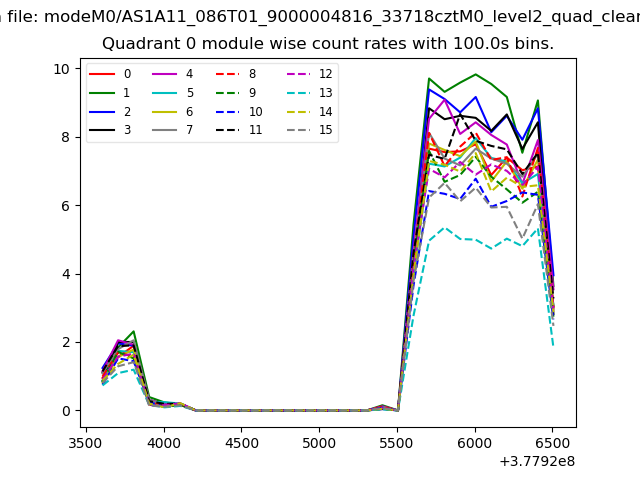 |
 |
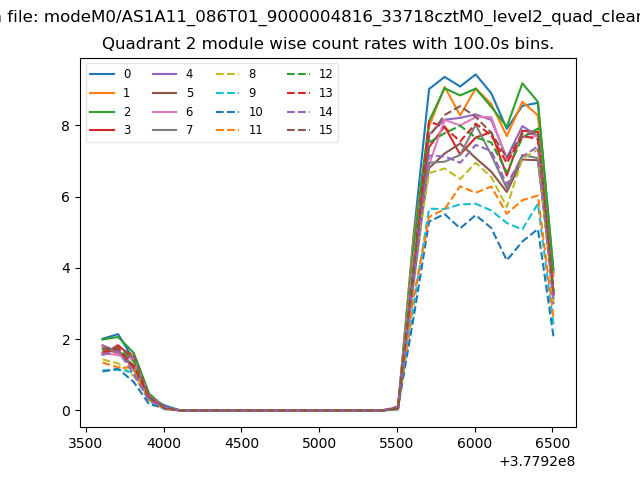
| Module-wise count rates for Quadrant B Data is divided into 100 sec bins |
 |
 |
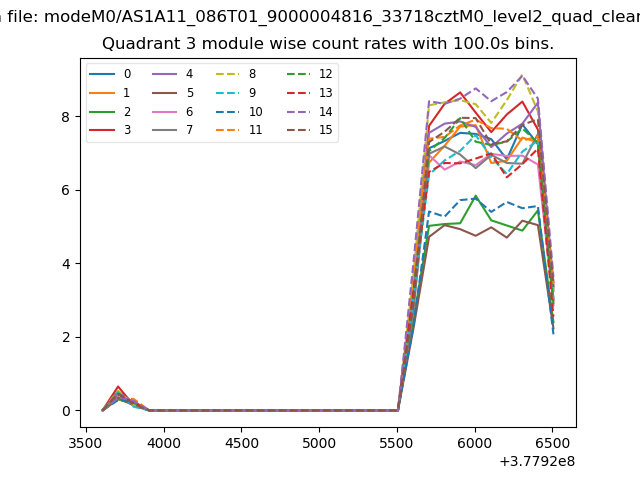
| Module-wise count rates for Quadrant C Data is divided into 100 sec bins |
 |
 |
| Module-wise count rates for Quadrant D Data is divided into 100 sec bins |
 |
 |
| Parameter | Plot |
|---|---|
| CZT HV Monitor |  |
| D_VDD | 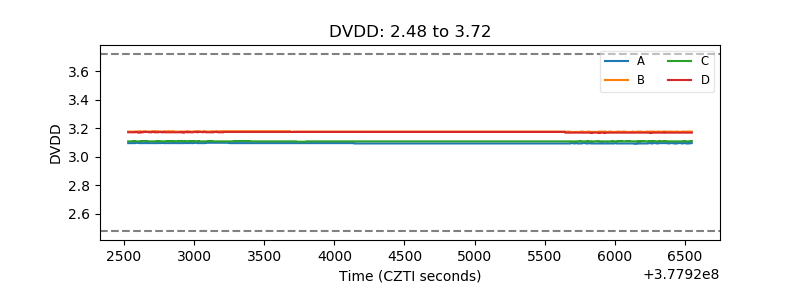 |
| Temperature 1 | 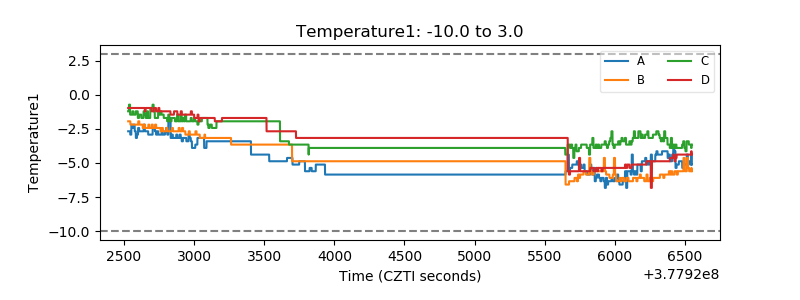 |
| Veto HV Monitor | 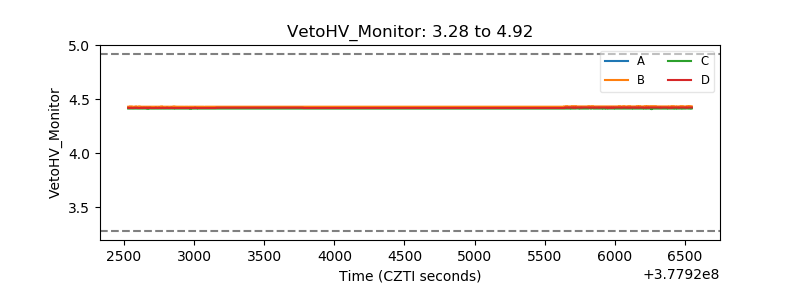 |
| Veto LLD | 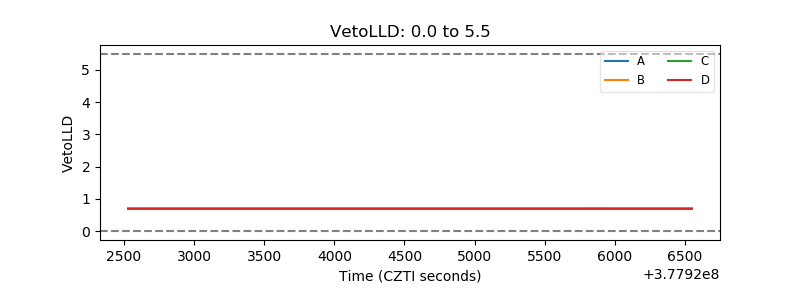 |
| Alpha Counter | 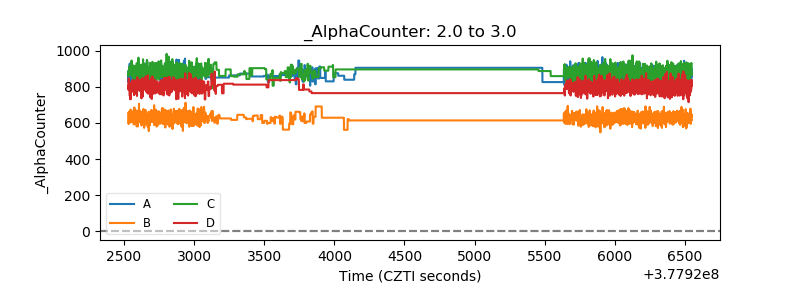 |
| _CPM_Rate | 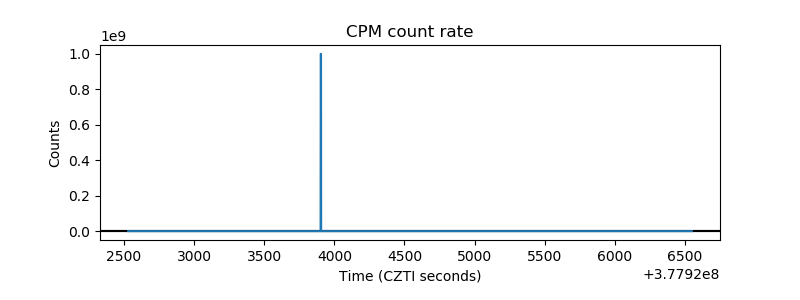 |
| CZT Counter | 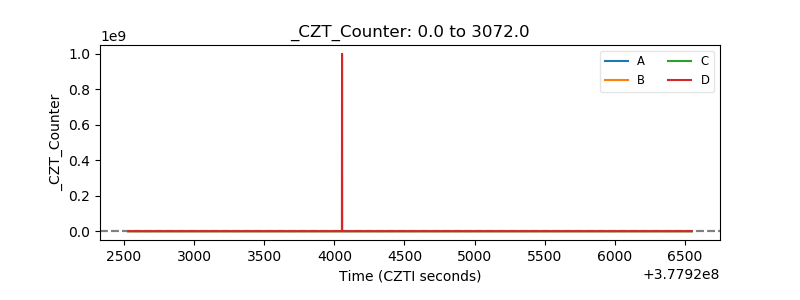 |
| +2.5 Volts monitor |  |
| +5 Volts monitor | 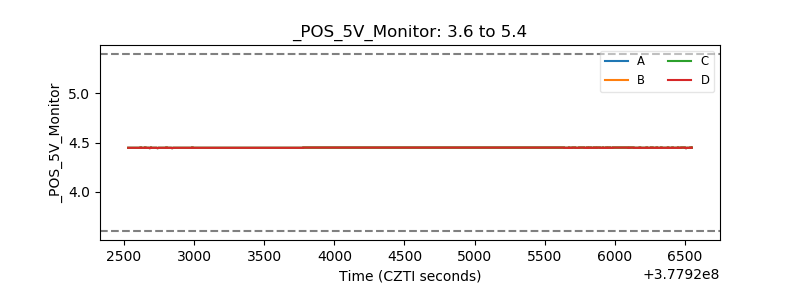 |
| _ROLL_ROT | 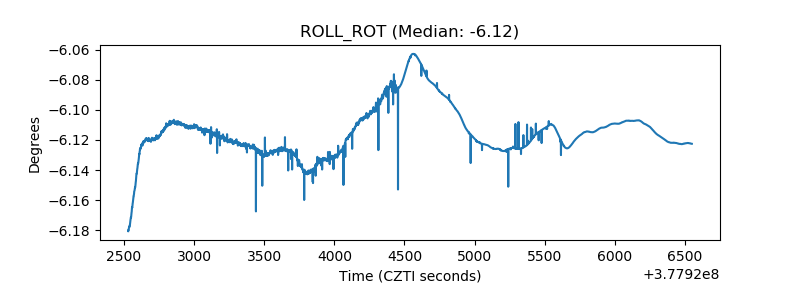 |
| _Roll_DEC | 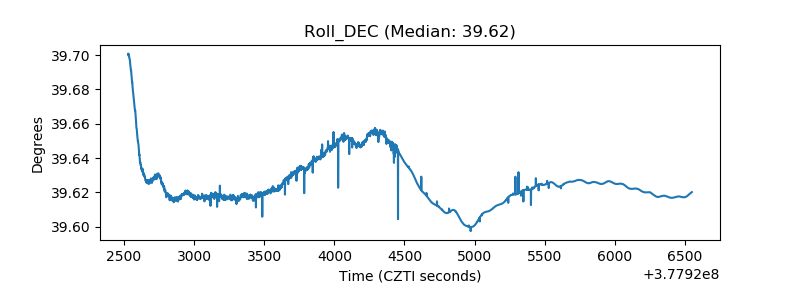 |
| _Roll_RA | 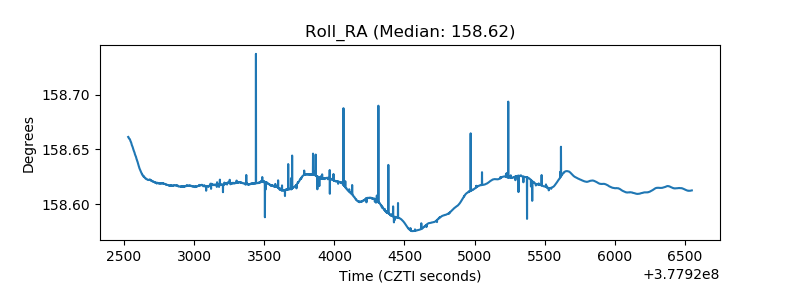 |
| Veto Counter | 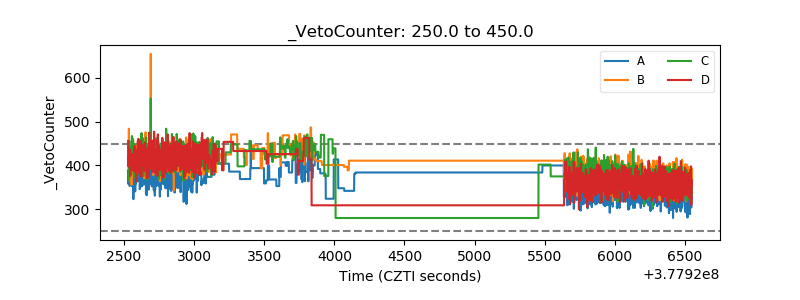 |