| Param | Original file | Final file |
|---|---|---|
| Filename | modeM0/AS1A11_086T01_9000004816_33721cztM0_level2.evt | modeM0/AS1A11_086T01_9000004816_33721cztM0_level2_quad_clean.evt |
| Size (bytes) | 1,319,616,000 | 192,936,960 |
| Size | 1.2 GB | 184.0 MB |
| Events in quadrant A | 7,843,680 | 1,200,852 |
| Events in quadrant B | 9,347,865 | 1,206,718 |
| Events in quadrant C | 8,820,922 | 1,207,542 |
| Events in quadrant D | 12,858,805 | 1,109,941 |
| Mode SS | |||
|---|---|---|---|
| Quadrant | BADHDUFLAG | Total packets | Discarded packets |
| A | 0 | 330 | 0 |
| B | 0 | 330 | 0 |
| C | 0 | 330 | 0 |
| D | 0 | 330 | 0 |
| Mode M9 | |||
|---|---|---|---|
| Quadrant | BADHDUFLAG | Total packets | Discarded packets |
| A | 0 | 55 | 0 |
| B | 0 | 55 | 0 |
| C | 0 | 55 | 0 |
| D | 0 | 55 | 0 |
| Mode M0 | |||
|---|---|---|---|
| Quadrant | BADHDUFLAG | Total packets | Discarded packets |
| A | 0 | 33694 | 4 |
| B | 0 | 37871 | 3 |
| C | 0 | 35636 | 3 |
| D | 0 | 49601 | 3 |
| Quadrant | Total seconds | Saturated seconds | Saturation percentage |
|---|---|---|---|
| A | 16217 | 93 | 0.573472% |
| B | 16217 | 360 | 2.219893% |
| C | 16217 | 92 | 0.567306% |
| D | 16217 | 865 | 5.333909% |
Noise dominated data is calculated using 1-second bins in cleaned event files. If a bin has >2000 counts, and if more than 50% of those come from <1% of pixels, then it is considered to be noise-dominated and hence unusable.
| Quadrant | # 1 sec bins | Bins with >0 counts | Bins with >2000 counts | High rate bins dominated by noise | Noise dominated (total time) | Noise dominated (detector-on time) | Marked lightcurve |
|---|---|---|---|---|---|---|---|
| A | 21618 | 16217 | 54 | 54 | 0.25% | 0.33% | 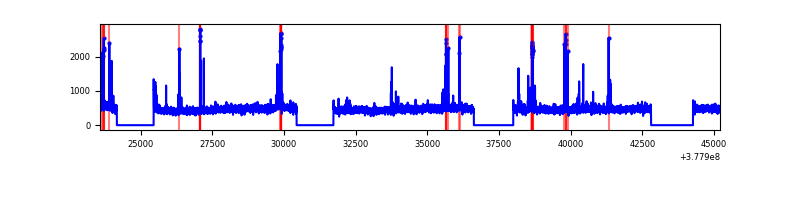 |
| B | 21619 | 16217 | 237 | 237 | 1.10% | 1.46% | 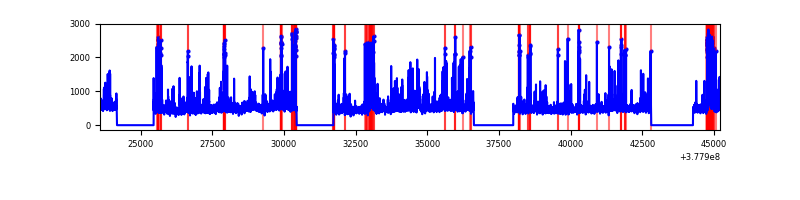 |
| C | 21619 | 16218 | 87 | 87 | 0.40% | 0.54% | 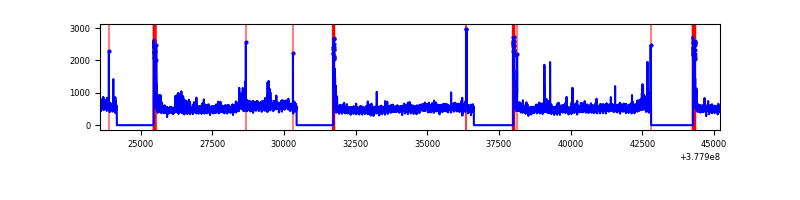 |
| D | 21619 | 16219 | 781 | 781 | 3.61% | 4.82% | 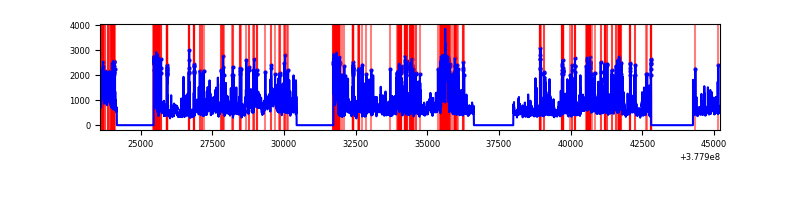 |
Top three noisy pixels from each quadrant. If the there are fewer than three noisy pixels in the level2.evt file, extra rows are filled as -1
| Pixel properties | Quadrant properties | ||||||
|---|---|---|---|---|---|---|---|
| Quadrant | DetID | PixID | Counts | Sigma | Mean | Median | Sigma |
| A | 15 | 237 | 248029 | 645.86 | 1914 | 1877 | 381.1 |
| A | 15 | 169 | 141989 | 367.63 | 1914 | 1877 | 381.1 |
| A | 13 | 6 | 41440 | 103.81 | 1914 | 1877 | 381.1 |
| B | 5 | 172 | 1078861 | 2970.76 | 1897 | 1846 | 362.5 |
| B | 4 | 170 | 140618 | 382.78 | 1897 | 1846 | 362.5 |
| B | 0 | 213 | 103786 | 281.18 | 1897 | 1846 | 362.5 |
| C | 15 | 214 | 746773 | 1740.26 | 1865 | 1879 | 428.0 |
| C | 0 | 10 | 391559 | 910.39 | 1865 | 1879 | 428.0 |
| C | 14 | 67 | 153613 | 354.49 | 1865 | 1879 | 428.0 |
| D | 8 | 195 | 2111132 | 4415.41 | 1816 | 1777 | 477.7 |
| D | 2 | 250 | 2052523 | 4292.72 | 1816 | 1777 | 477.7 |
| D | 2 | 120 | 298405 | 620.92 | 1816 | 1777 | 477.7 |
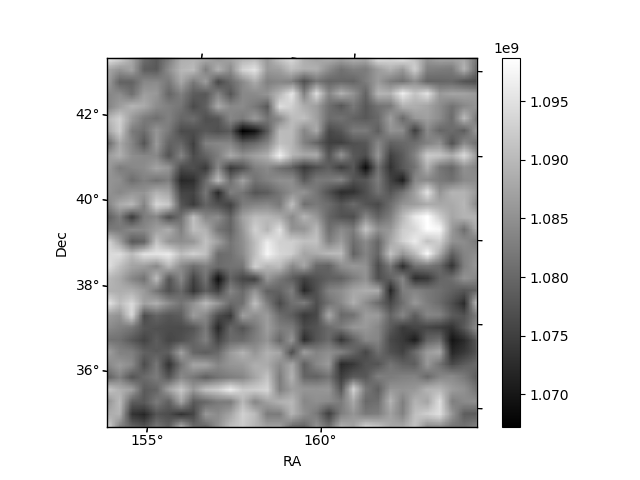
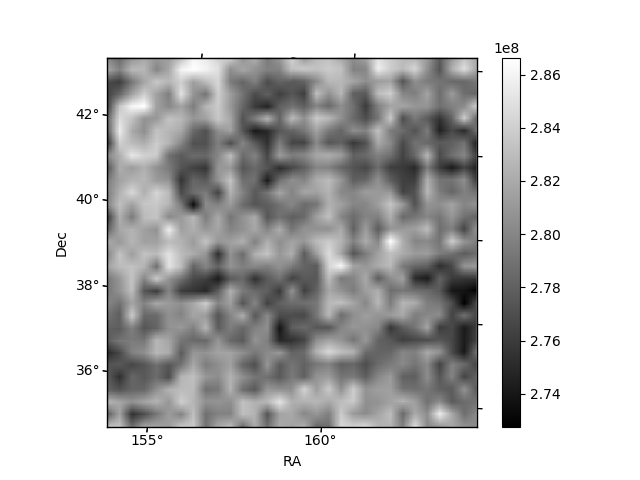
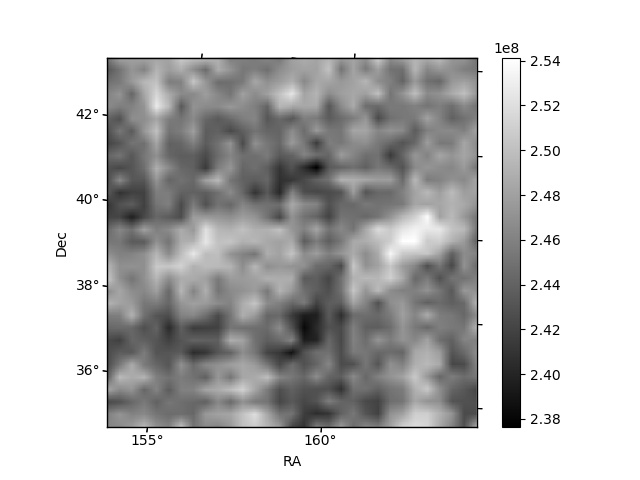
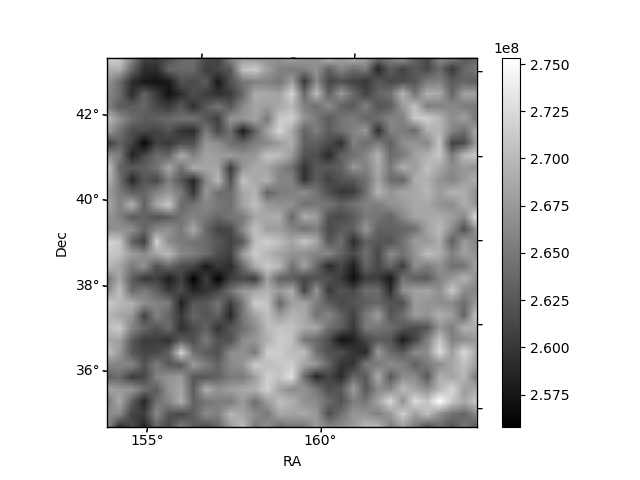
Histogram calculated using DETX and DETY for each event in the final _common_clean file
| Quadrant A | 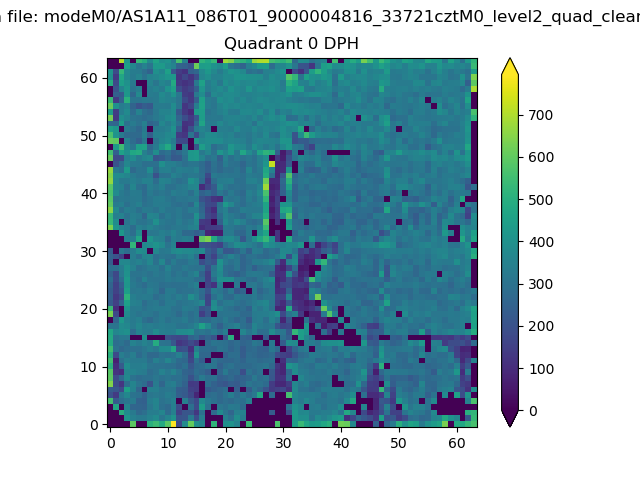 |
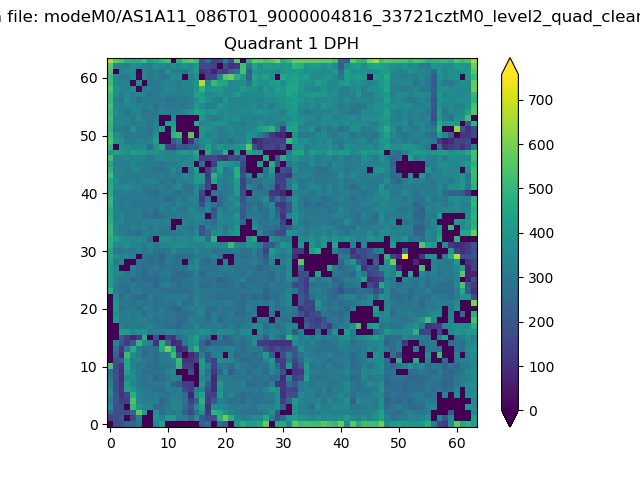 |
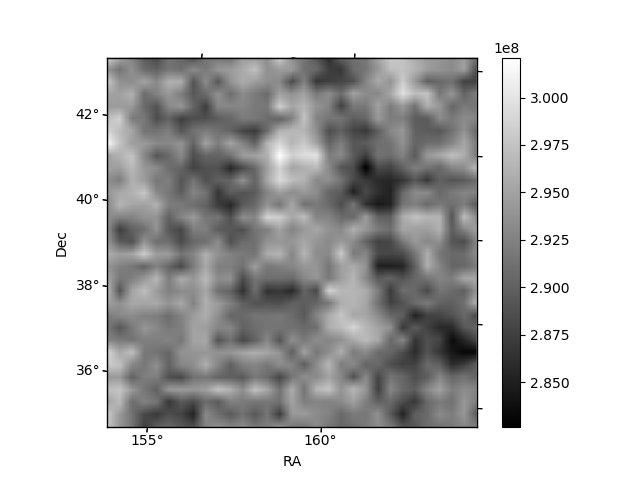
Quadrant B |
|---|---|---|---|
| Quadrant D | 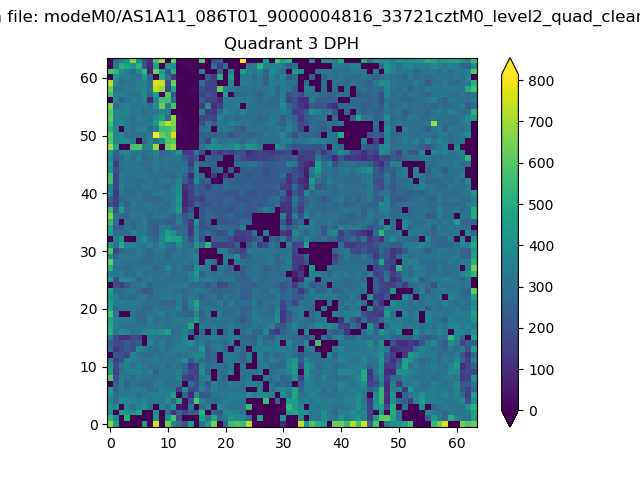 |
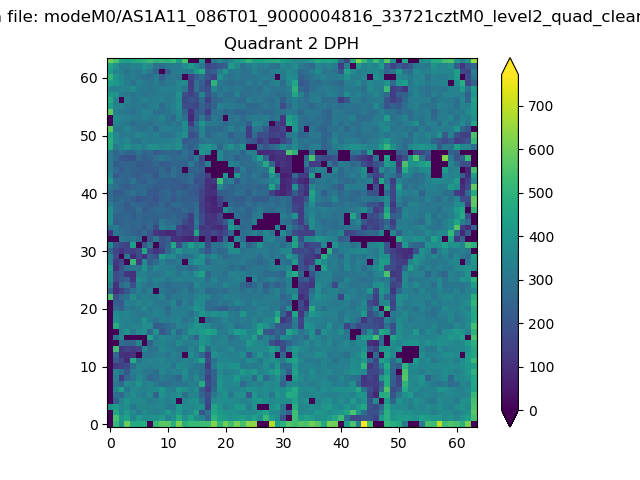 |
Quadrant C |
| Plot type | Count rate plots | Images |
|---|---|---|
| Comparison with Poisson distribution Blue bars denote a histogram of data divided into 1 sec bins. Red curve is a Poisson curve with rate = median count rate of data. |
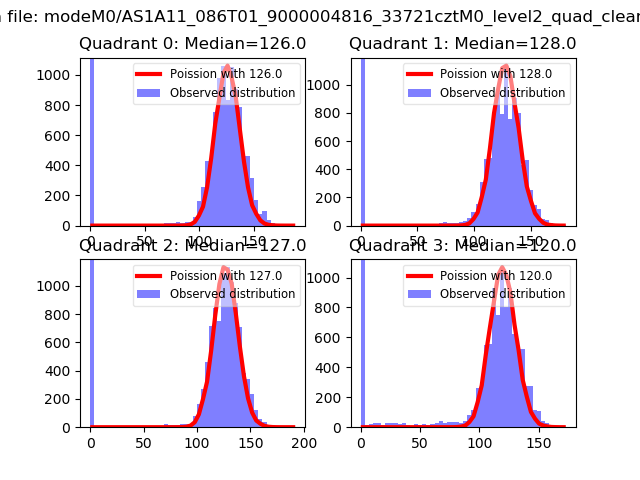 |
 |
| Quadrant-wise count rates Data is divided into 100 sec bins |
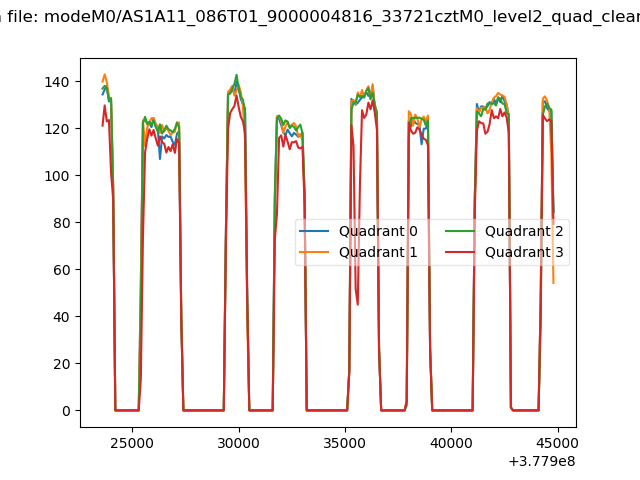 |
|
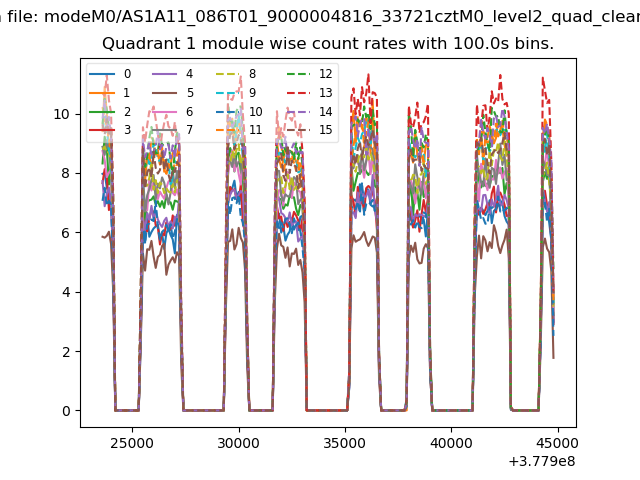
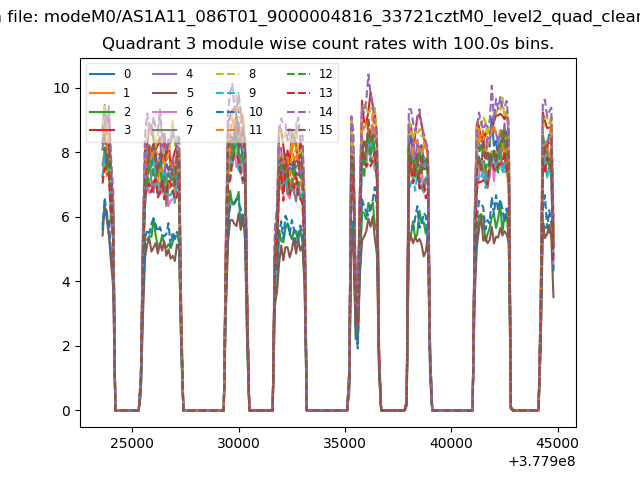
| Module-wise count rates for Quadrant A Data is divided into 100 sec bins |
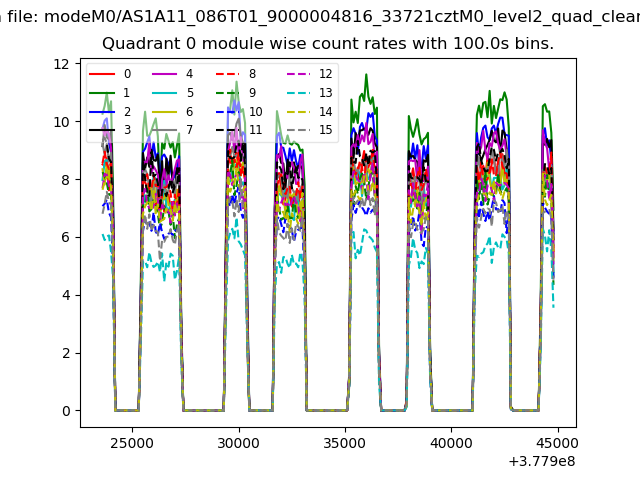 |
 |
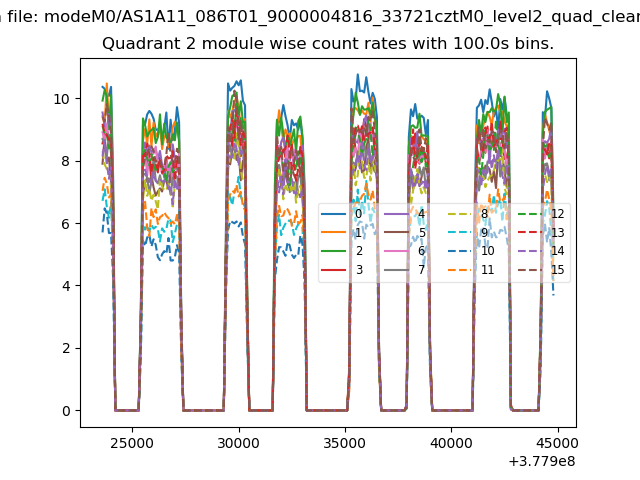
| Module-wise count rates for Quadrant B Data is divided into 100 sec bins |
 |
 |
| Module-wise count rates for Quadrant C Data is divided into 100 sec bins |
 |
 |
| Module-wise count rates for Quadrant D Data is divided into 100 sec bins |
 |
 |
| Parameter | Plot |
|---|---|
| CZT HV Monitor | 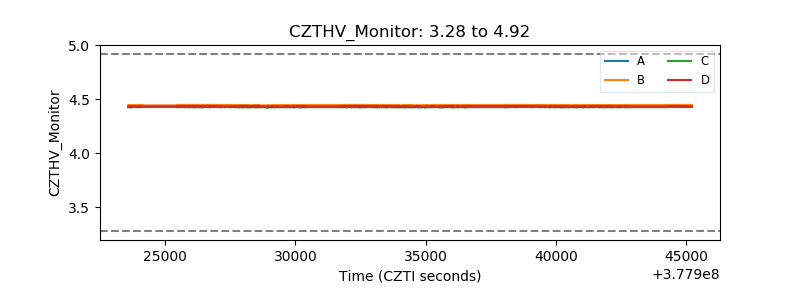 |
| D_VDD | 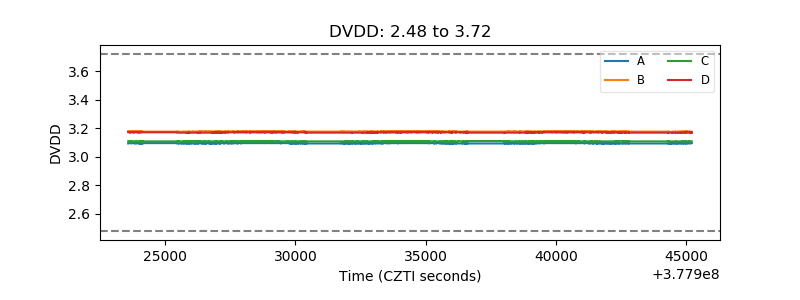 |
| Temperature 1 | 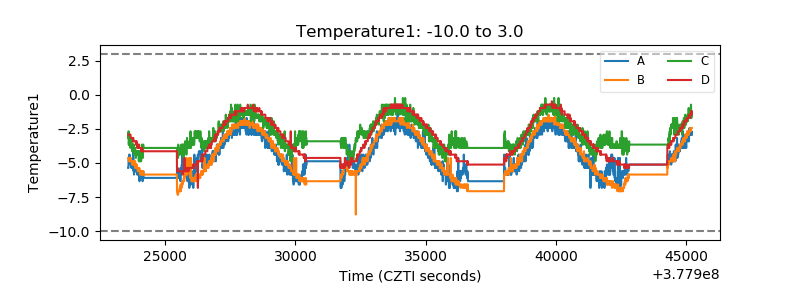 |
| Veto HV Monitor | 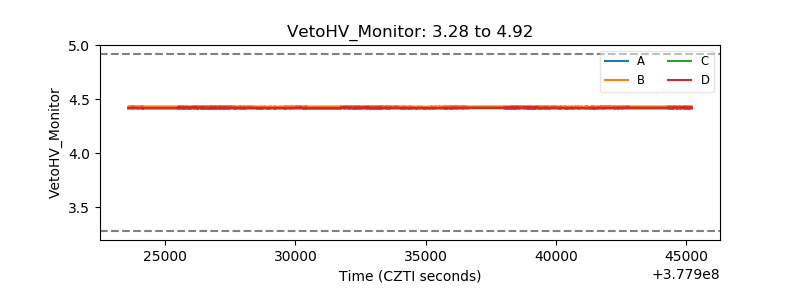 |
| Veto LLD | 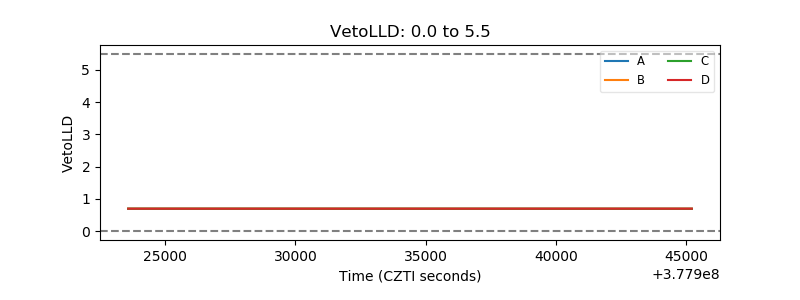 |
| Alpha Counter | 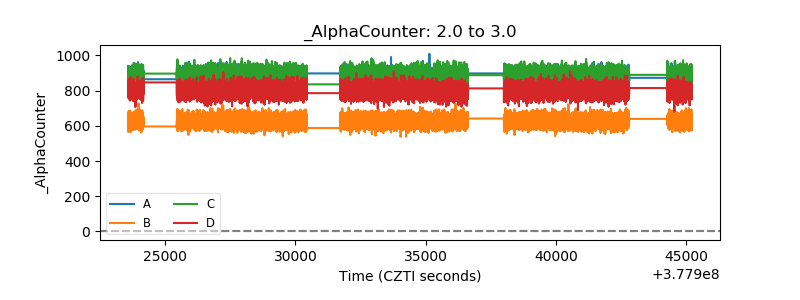 |
| _CPM_Rate | 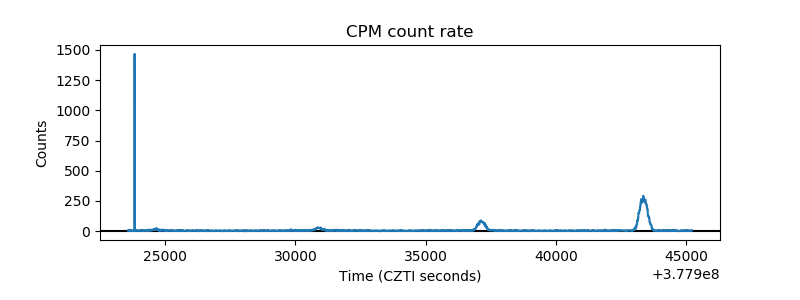 |
| CZT Counter | 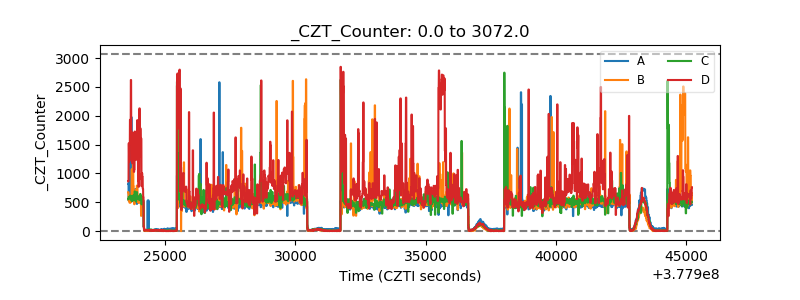 |
| +2.5 Volts monitor |  |
| +5 Volts monitor |  |
| _ROLL_ROT | 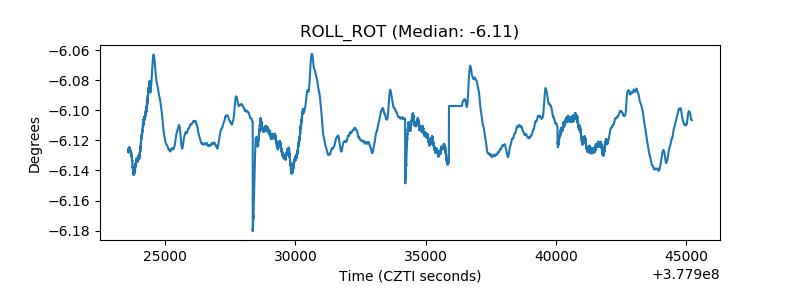 |
| _Roll_DEC | 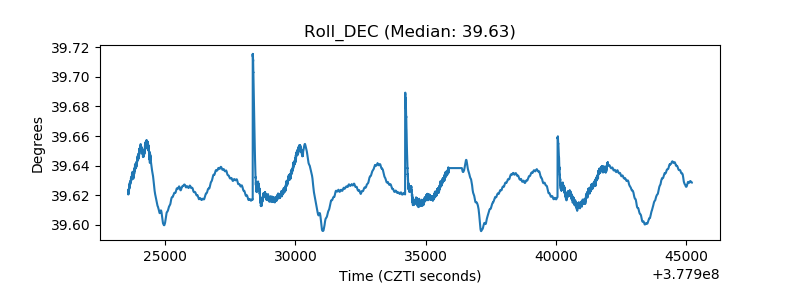 |
| _Roll_RA | 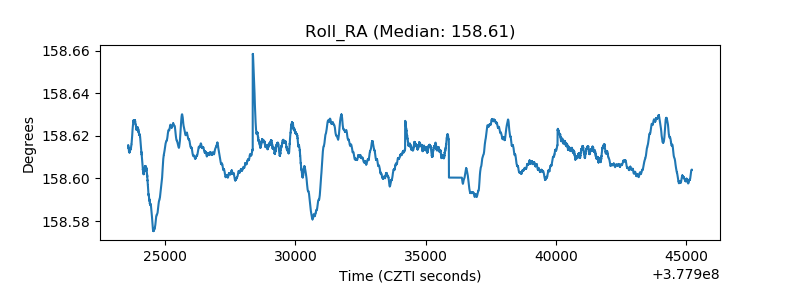 |
| Veto Counter | 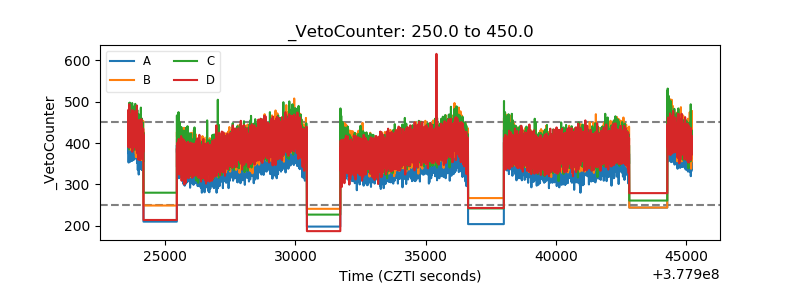 |