| Param | Original file | Final file |
|---|---|---|
| Filename | modeM0/AS1A11_086T01_9000004816_33722cztM0_level2.evt | modeM0/AS1A11_086T01_9000004816_33722cztM0_level2_quad_clean.evt |
| Size (bytes) | 348,333,120 | 55,575,360 |
| Size | 332.2 MB | 53.0 MB |
| Events in quadrant A | 1,941,969 | 358,509 |
| Events in quadrant B | 2,991,540 | 351,424 |
| Events in quadrant C | 2,244,011 | 353,894 |
| Events in quadrant D | 3,100,134 | 337,523 |
| Mode SS | |||
|---|---|---|---|
| Quadrant | BADHDUFLAG | Total packets | Discarded packets |
| A | 0 | 86 | 4 |
| B | 0 | 87 | 5 |
| C | 0 | 86 | 4 |
| D | 0 | 87 | 5 |
| Mode M9 | |||
|---|---|---|---|
| Quadrant | BADHDUFLAG | Total packets | Discarded packets |
| A | 0 | 17 | 0 |
| B | 0 | 17 | 0 |
| C | 0 | 17 | 0 |
| D | 0 | 18 | 1 |
| Mode M0 | |||
|---|---|---|---|
| Quadrant | BADHDUFLAG | Total packets | Discarded packets |
| A | 0 | 8660 | 448 |
| B | 0 | 11805 | 489 |
| C | 0 | 9286 | 471 |
| D | 0 | 12823 | 862 |
| Quadrant | Total seconds | Saturated seconds | Saturation percentage |
|---|---|---|---|
| A | 3989 | 19 | 0.476310% |
| B | 3984 | 397 | 9.964859% |
| C | 3984 | 47 | 1.179719% |
| D | 3983 | 234 | 5.874969% |
Noise dominated data is calculated using 1-second bins in cleaned event files. If a bin has >2000 counts, and if more than 50% of those come from <1% of pixels, then it is considered to be noise-dominated and hence unusable.
| Quadrant | # 1 sec bins | Bins with >0 counts | Bins with >2000 counts | High rate bins dominated by noise | Noise dominated (total time) | Noise dominated (detector-on time) | Marked lightcurve |
|---|---|---|---|---|---|---|---|
| A | 7115 | 4001 | 3 | 3 | 0.04% | 0.07% | 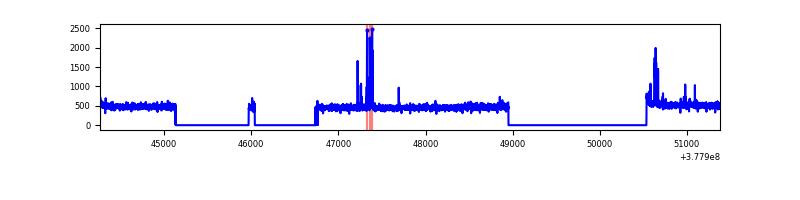 |
| B | 7115 | 3995 | 314 | 314 | 4.41% | 7.86% | 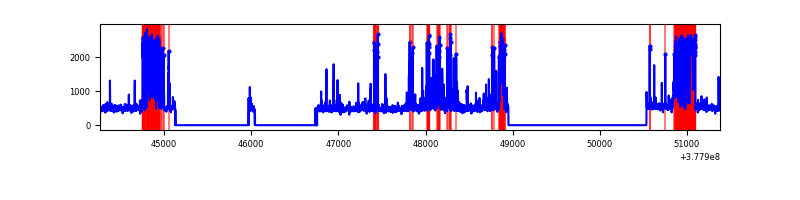 |
| C | 7114 | 3990 | 37 | 37 | 0.52% | 0.93% | 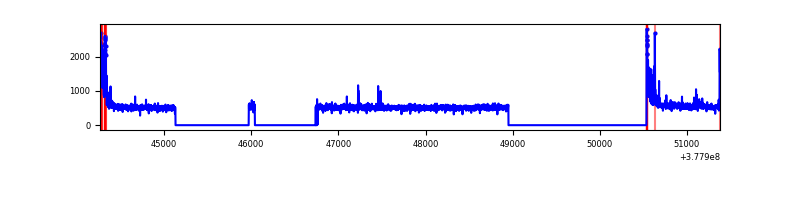 |
| D | 7115 | 3993 | 205 | 205 | 2.88% | 5.13% | 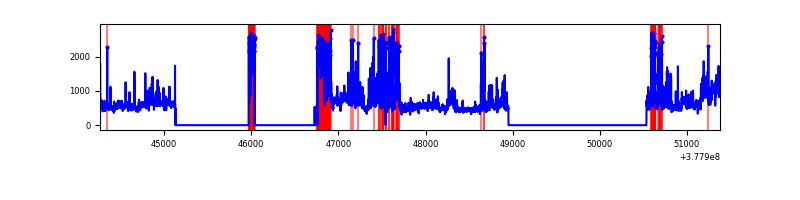 |
Top three noisy pixels from each quadrant. If the there are fewer than three noisy pixels in the level2.evt file, extra rows are filled as -1
| Pixel properties | Quadrant properties | ||||||
|---|---|---|---|---|---|---|---|
| Quadrant | DetID | PixID | Counts | Sigma | Mean | Median | Sigma |
| A | 15 | 169 | 34017 | 341.61 | 483 | 474 | 98.2 |
| A | 15 | 237 | 25712 | 257.03 | 483 | 474 | 98.2 |
| A | 10 | 83 | 8531 | 82.05 | 483 | 474 | 98.2 |
| B | 5 | 172 | 1104951 | 12289.73 | 461 | 449 | 89.9 |
| B | 5 | 255 | 20525 | 223.38 | 461 | 449 | 89.9 |
| B | 0 | 190 | 14447 | 155.75 | 461 | 449 | 89.9 |
| C | 15 | 214 | 189436 | 1721.23 | 468 | 471 | 109.8 |
| C | 0 | 10 | 188887 | 1716.23 | 468 | 471 | 109.8 |
| C | 14 | 67 | 19276 | 171.29 | 468 | 471 | 109.8 |
| D | 2 | 250 | 639987 | 5539.05 | 460 | 446 | 115.5 |
| D | 8 | 195 | 324833 | 2809.51 | 460 | 446 | 115.5 |
| D | 10 | 118 | 100953 | 870.49 | 460 | 446 | 115.5 |
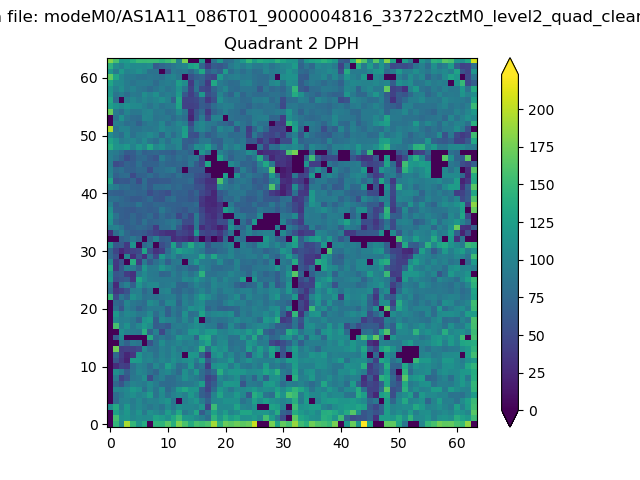
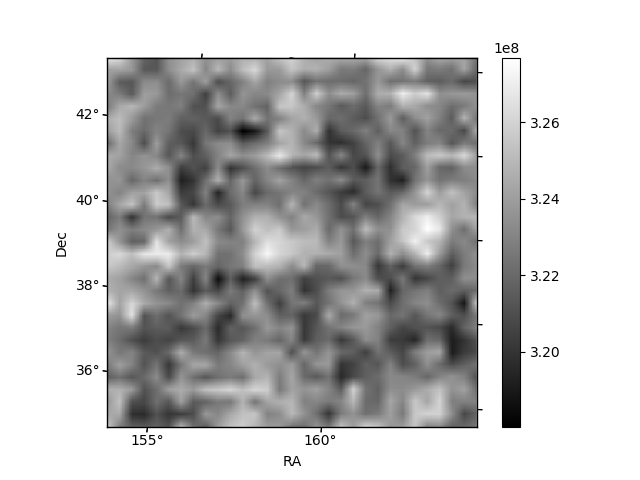
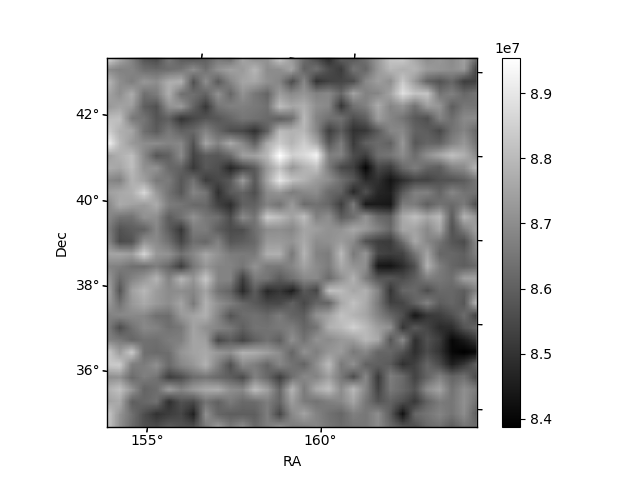
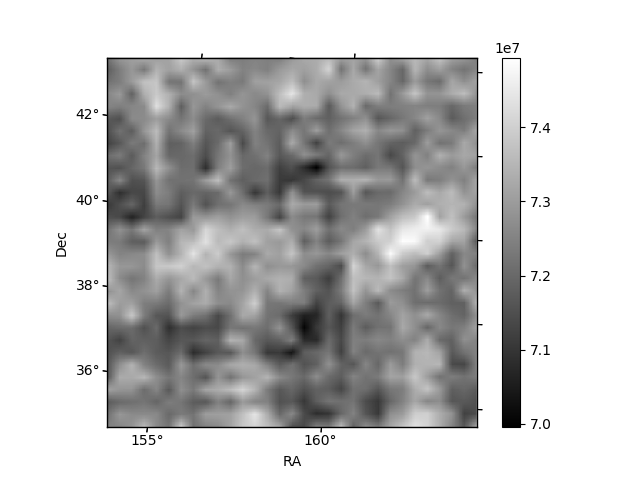
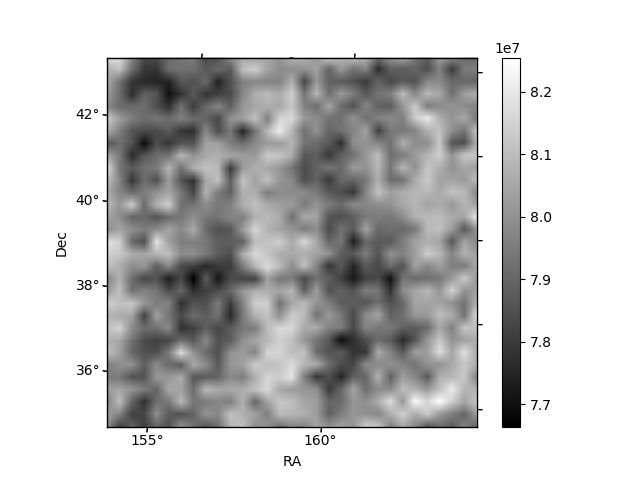
Histogram calculated using DETX and DETY for each event in the final _common_clean file
| Quadrant A | 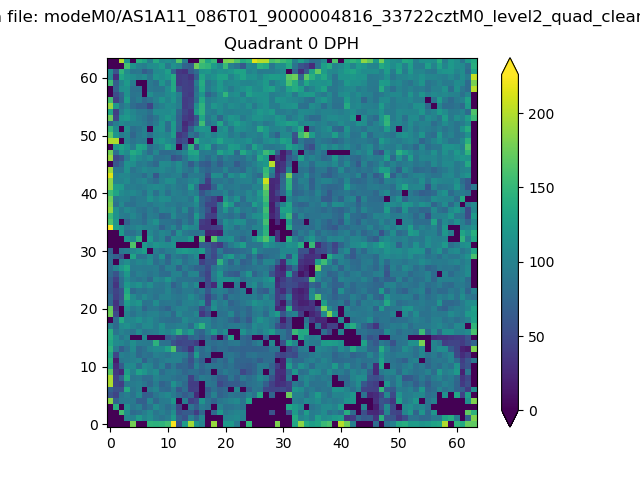 |
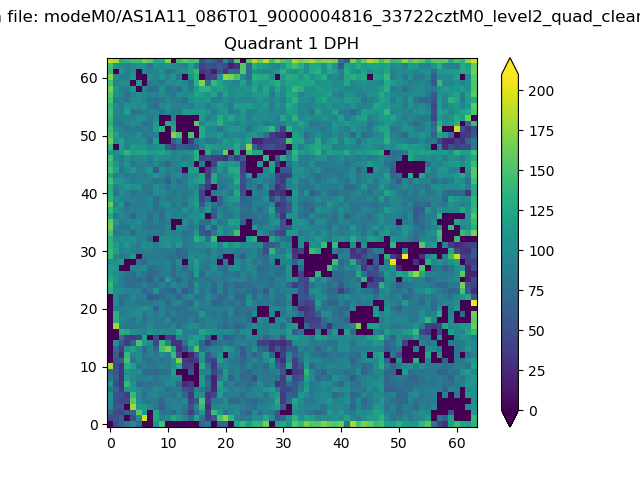 |
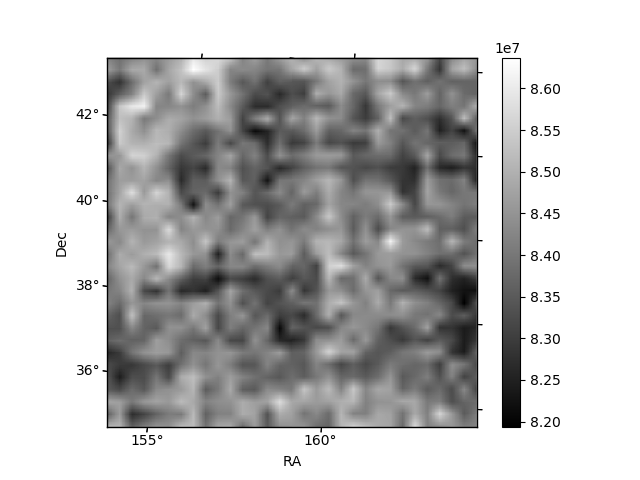
Quadrant B |
|---|---|---|---|
| Quadrant D | 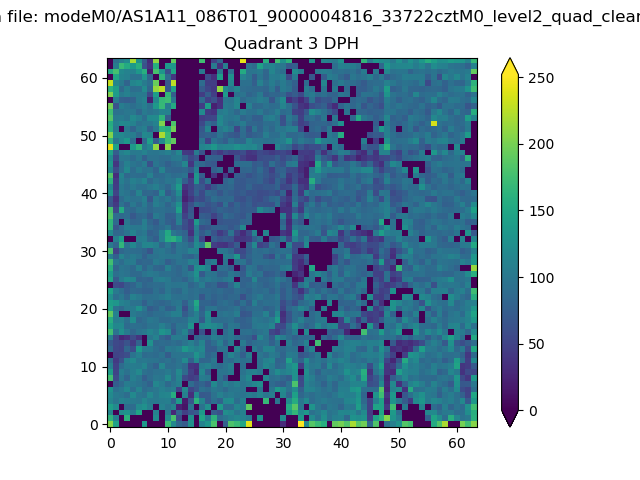 |
 |
Quadrant C |
| Plot type | Count rate plots | Images |
|---|---|---|
| Comparison with Poisson distribution Blue bars denote a histogram of data divided into 1 sec bins. Red curve is a Poisson curve with rate = median count rate of data. |
 |
 |
| Quadrant-wise count rates Data is divided into 100 sec bins |
 |
|
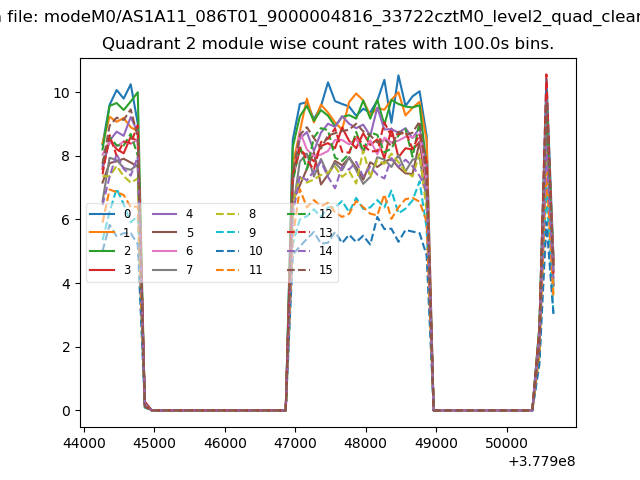
| Module-wise count rates for Quadrant A Data is divided into 100 sec bins |
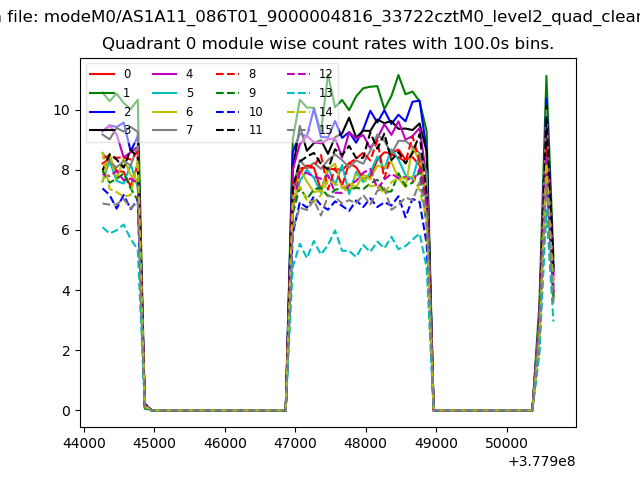 |
 |
| Module-wise count rates for Quadrant B Data is divided into 100 sec bins |
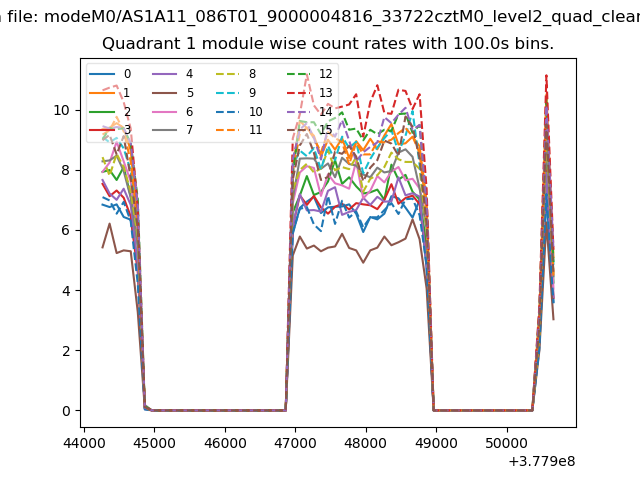 |
 |
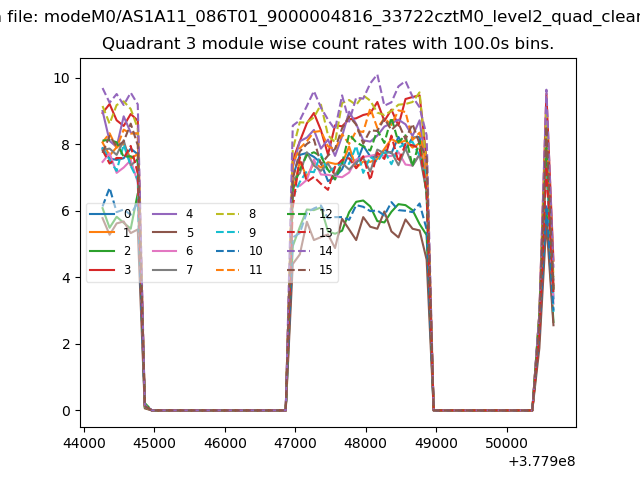
| Module-wise count rates for Quadrant C Data is divided into 100 sec bins |
 |
 |
| Module-wise count rates for Quadrant D Data is divided into 100 sec bins |
 |
 |
| Parameter | Plot |
|---|---|
| CZT HV Monitor | 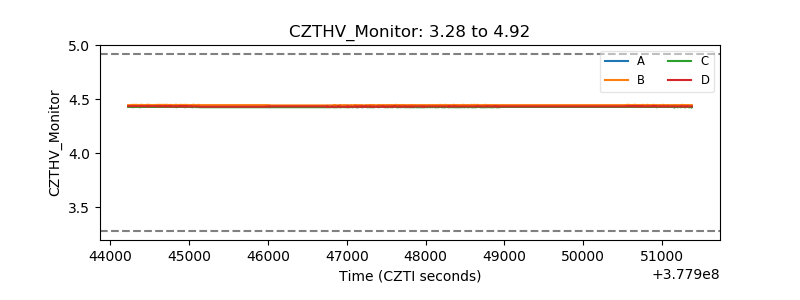 |
| D_VDD | 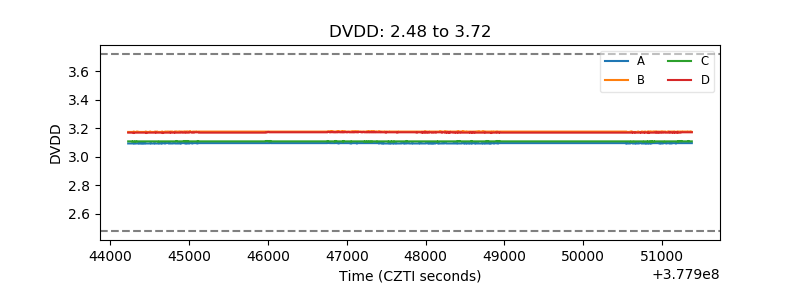 |
| Temperature 1 | 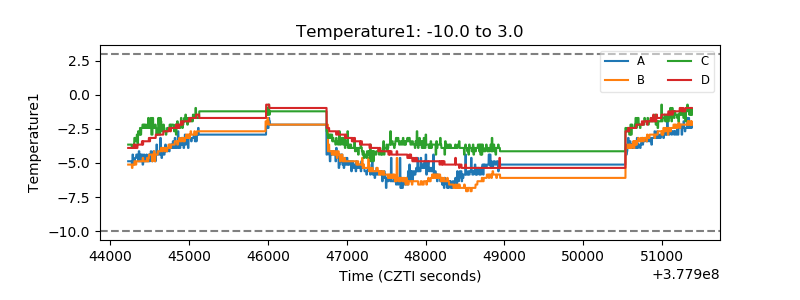 |
| Veto HV Monitor | 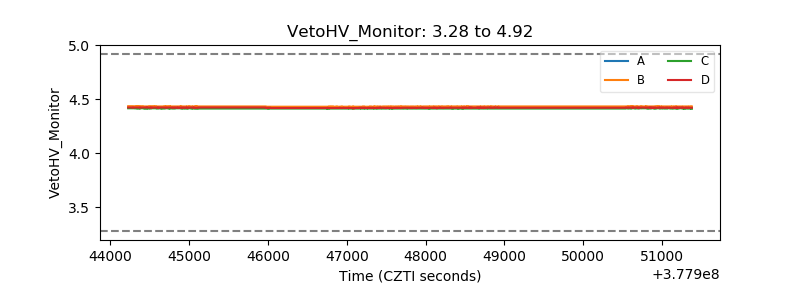 |
| Veto LLD | 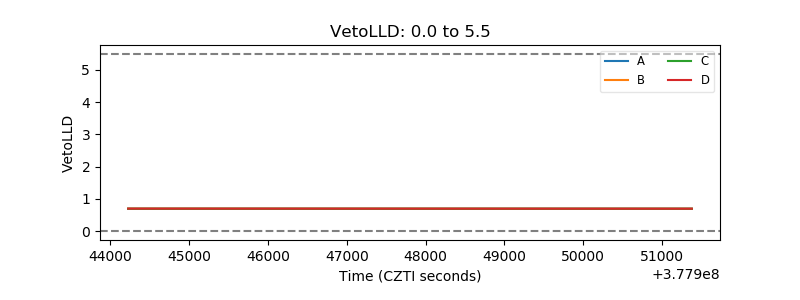 |
| Alpha Counter | 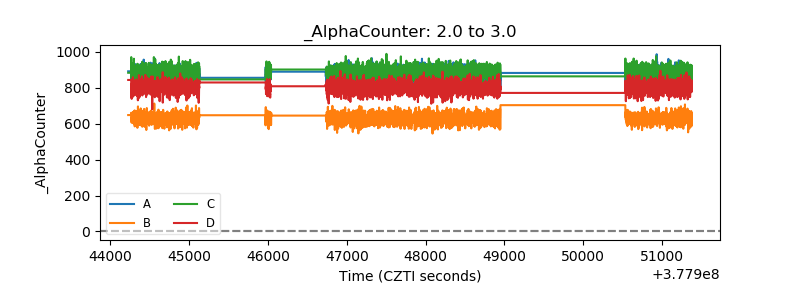 |
| _CPM_Rate |  |
| CZT Counter | 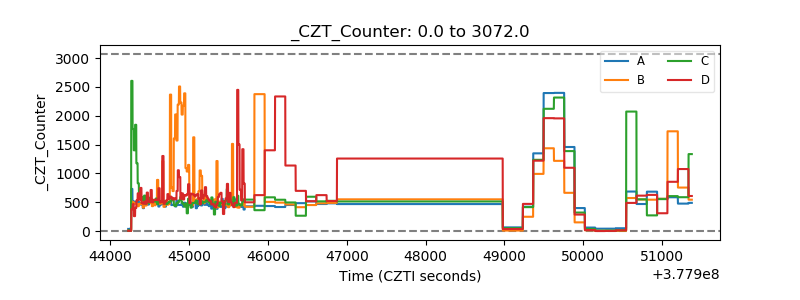 |
| +2.5 Volts monitor |  |
| +5 Volts monitor |  |
| _ROLL_ROT | 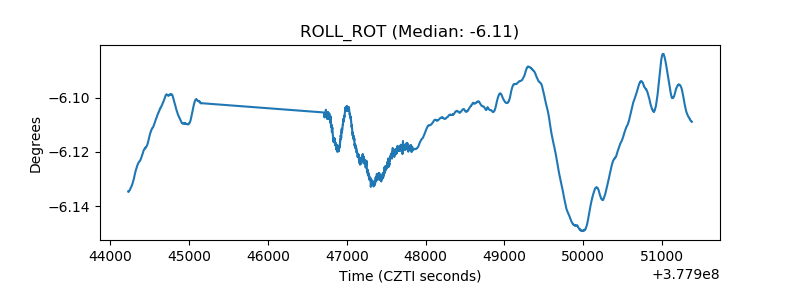 |
| _Roll_DEC | 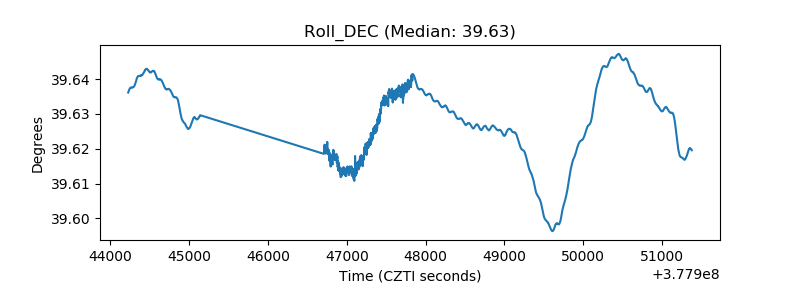 |
| _Roll_RA | 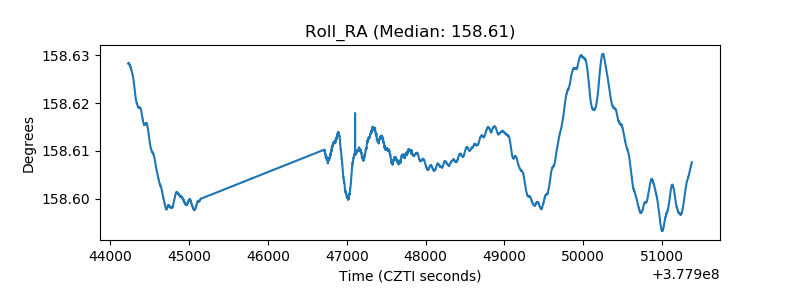 |
| Veto Counter | 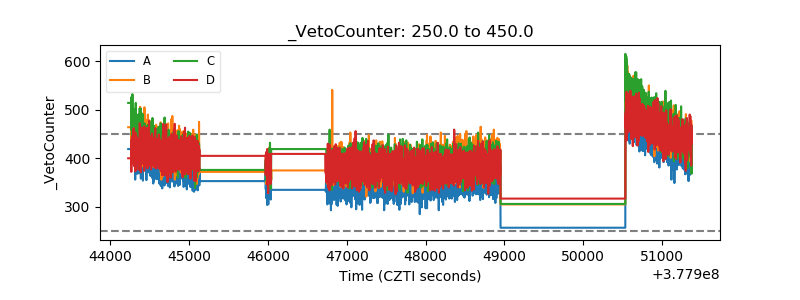 |