| Param | Original file | Final file |
|---|---|---|
| Filename | modeM0/AS1A11_086T01_9000004816_33724cztM0_level2.evt | modeM0/AS1A11_086T01_9000004816_33724cztM0_level2_quad_clean.evt |
| Size (bytes) | 815,880,960 | 96,629,760 |
| Size | 778.1 MB | 92.2 MB |
| Events in quadrant A | 4,775,959 | 573,208 |
| Events in quadrant B | 6,288,350 | 568,647 |
| Events in quadrant C | 5,378,054 | 567,889 |
| Events in quadrant D | 7,611,385 | 544,389 |
| Mode SS | |||
|---|---|---|---|
| Quadrant | BADHDUFLAG | Total packets | Discarded packets |
| A | 0 | 198 | 0 |
| B | 0 | 198 | 0 |
| C | 0 | 198 | 0 |
| D | 0 | 198 | 0 |
| Mode M9 | |||
|---|---|---|---|
| Quadrant | BADHDUFLAG | Total packets | Discarded packets |
| A | 0 | 33 | 0 |
| B | 0 | 33 | 0 |
| C | 0 | 33 | 0 |
| D | 0 | 33 | 0 |
| Mode M0 | |||
|---|---|---|---|
| Quadrant | BADHDUFLAG | Total packets | Discarded packets |
| A | 0 | 20384 | 3 |
| B | 0 | 24691 | 2 |
| C | 0 | 21434 | 2 |
| D | 0 | 29275 | 2 |
| Quadrant | Total seconds | Saturated seconds | Saturation percentage |
|---|---|---|---|
| A | 9692 | 53 | 0.546843% |
| B | 9692 | 483 | 4.983492% |
| C | 9692 | 87 | 0.897648% |
| D | 9692 | 642 | 6.624020% |
Noise dominated data is calculated using 1-second bins in cleaned event files. If a bin has >2000 counts, and if more than 50% of those come from <1% of pixels, then it is considered to be noise-dominated and hence unusable.
| Quadrant | # 1 sec bins | Bins with >0 counts | Bins with >2000 counts | High rate bins dominated by noise | Noise dominated (total time) | Noise dominated (detector-on time) | Marked lightcurve |
|---|---|---|---|---|---|---|---|
| A | 13009 | 9694 | 29 | 29 | 0.22% | 0.30% | 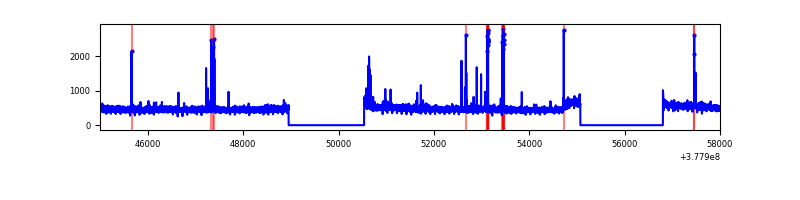 |
| B | 13009 | 9694 | 385 | 385 | 2.96% | 3.97% | 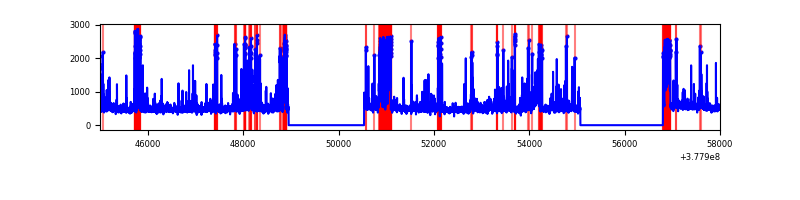 |
| C | 13009 | 9694 | 75 | 75 | 0.58% | 0.77% | 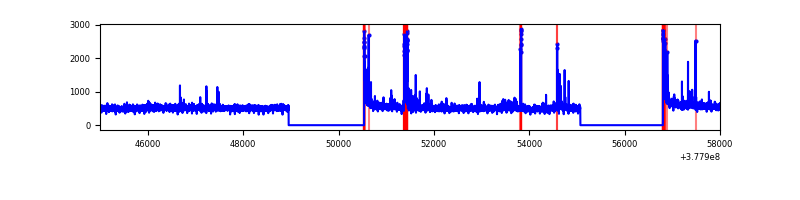 |
| D | 13009 | 9694 | 590 | 590 | 4.54% | 6.09% | 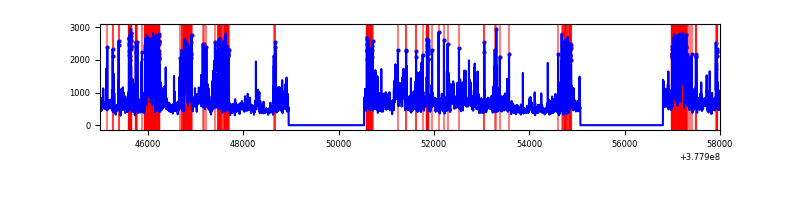 |
Top three noisy pixels from each quadrant. If the there are fewer than three noisy pixels in the level2.evt file, extra rows are filled as -1
| Pixel properties | Quadrant properties | ||||||
|---|---|---|---|---|---|---|---|
| Quadrant | DetID | PixID | Counts | Sigma | Mean | Median | Sigma |
| A | 15 | 169 | 137767 | 588.97 | 1170 | 1148 | 232.0 |
| A | 15 | 237 | 89212 | 379.65 | 1170 | 1148 | 232.0 |
| A | 13 | 254 | 18268 | 73.8 | 1170 | 1148 | 232.0 |
| B | 5 | 172 | 1437982 | 6613.25 | 1143 | 1114 | 217.3 |
| B | 15 | 85 | 80624 | 365.95 | 1143 | 1114 | 217.3 |
| B | 0 | 245 | 66802 | 302.33 | 1143 | 1114 | 217.3 |
| C | 15 | 214 | 430011 | 1635.44 | 1137 | 1145 | 262.2 |
| C | 0 | 10 | 223521 | 848.01 | 1137 | 1145 | 262.2 |
| C | 0 | 239 | 122439 | 462.54 | 1137 | 1145 | 262.2 |
| D | 2 | 250 | 1316131 | 4775.28 | 1117 | 1087 | 275.4 |
| D | 8 | 195 | 661734 | 2398.99 | 1117 | 1087 | 275.4 |
| D | 12 | 16 | 463116 | 1677.75 | 1117 | 1087 | 275.4 |
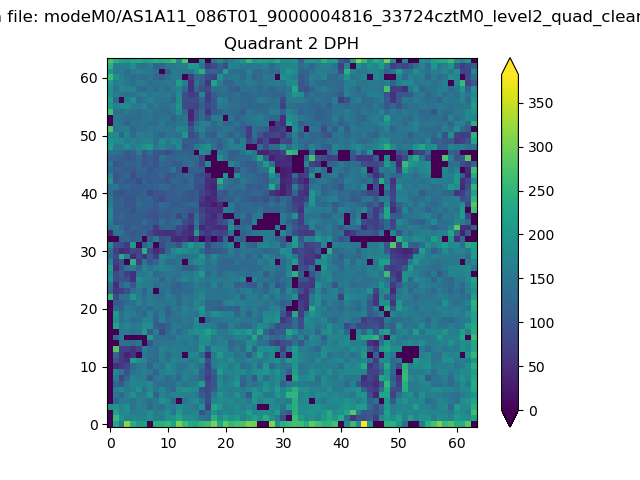
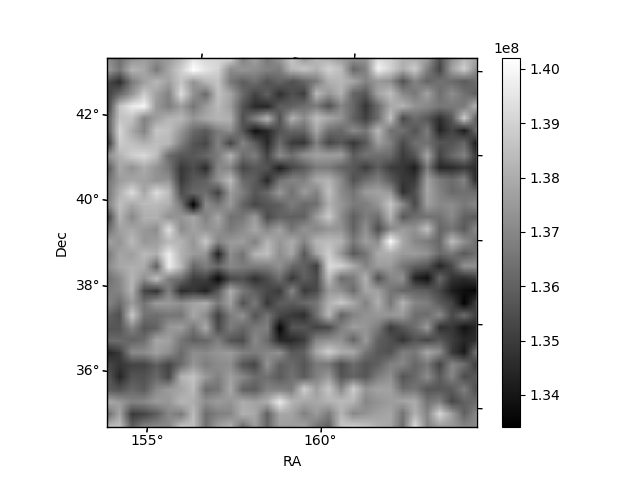
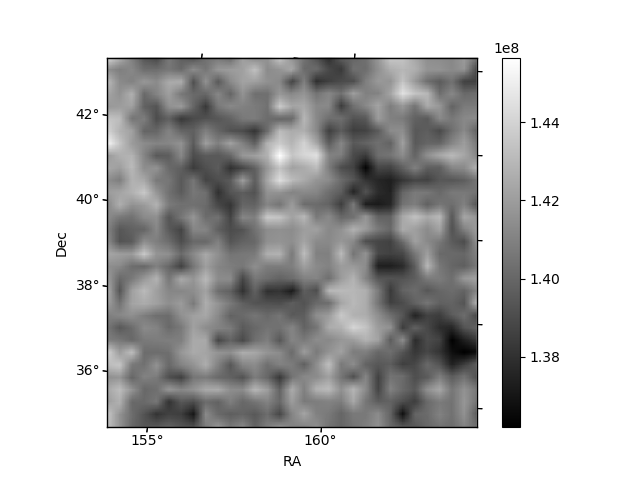
Histogram calculated using DETX and DETY for each event in the final _common_clean file
| Quadrant A |  |
 |
Quadrant B |
|---|---|---|---|
| Quadrant D | 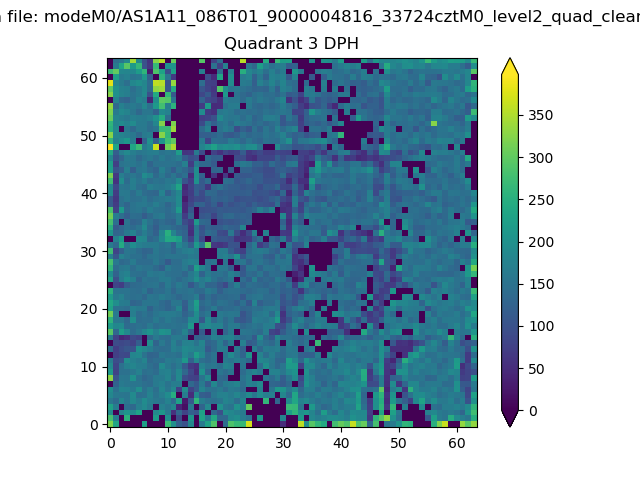 |
 |
Quadrant C |
| Plot type | Count rate plots | Images |
|---|---|---|
| Comparison with Poisson distribution Blue bars denote a histogram of data divided into 1 sec bins. Red curve is a Poisson curve with rate = median count rate of data. |
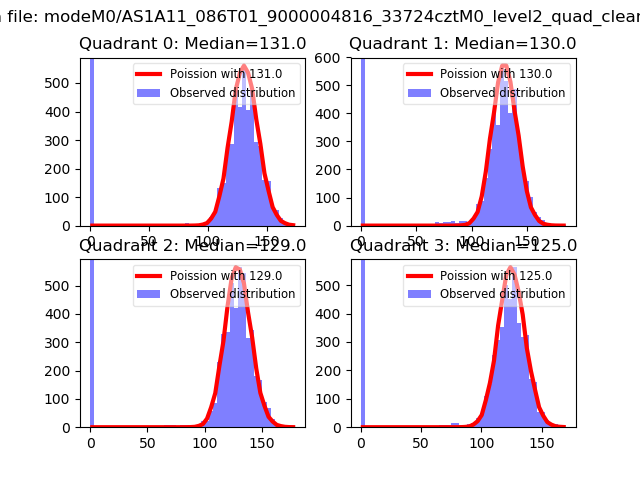 |
 |
| Quadrant-wise count rates Data is divided into 100 sec bins |
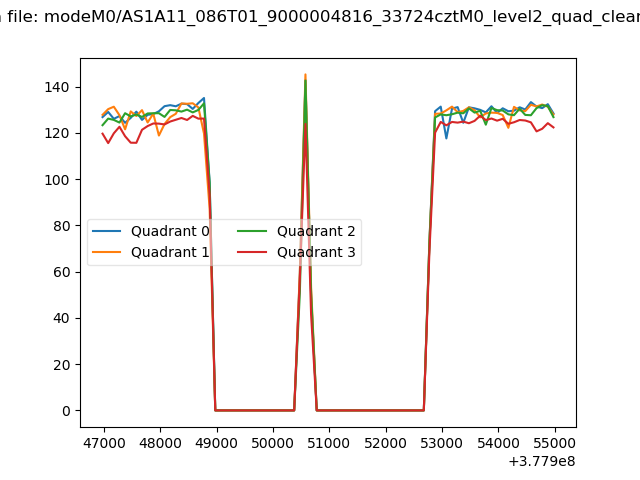 |
|
| Module-wise count rates for Quadrant A Data is divided into 100 sec bins |
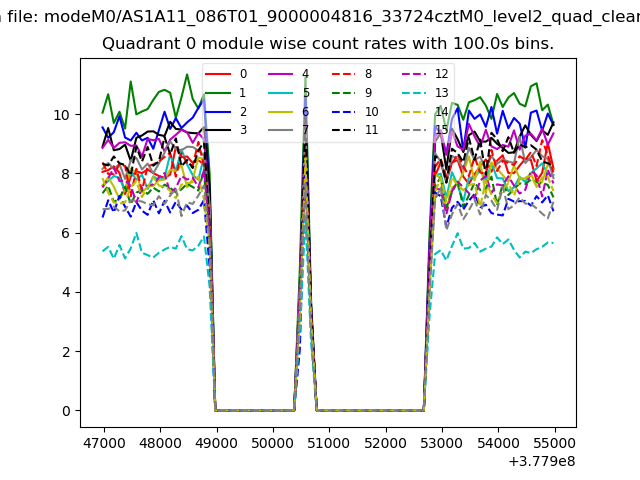 |
 |
| Module-wise count rates for Quadrant B Data is divided into 100 sec bins |
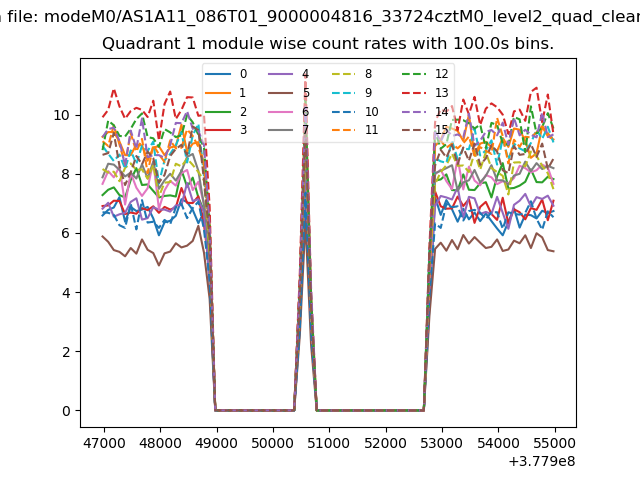 |
 |
| Module-wise count rates for Quadrant C Data is divided into 100 sec bins |
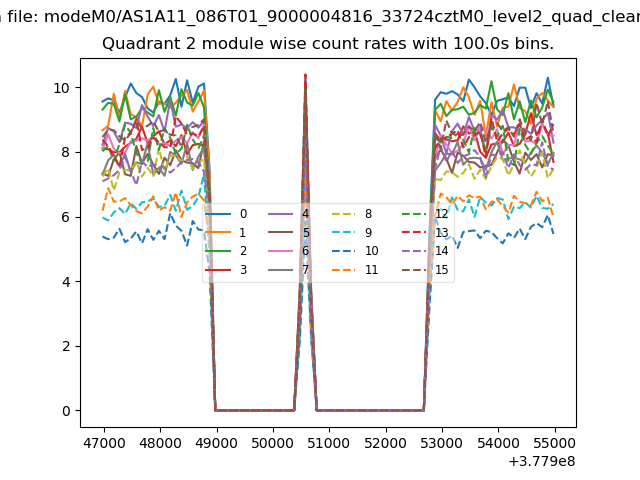 |
 |
| Module-wise count rates for Quadrant D Data is divided into 100 sec bins |
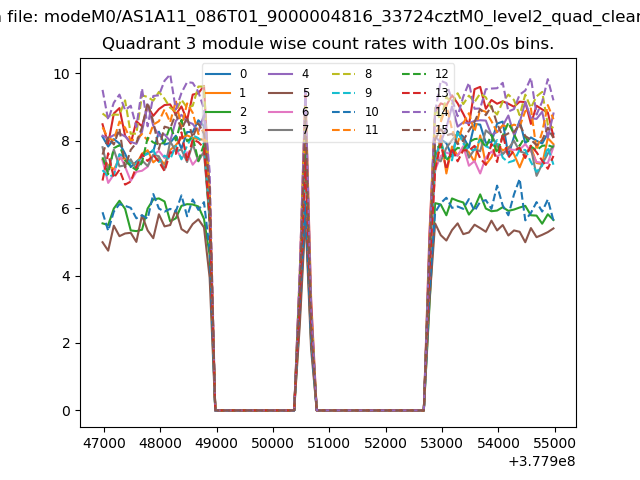 |
 |
| Parameter | Plot |
|---|---|
| CZT HV Monitor | 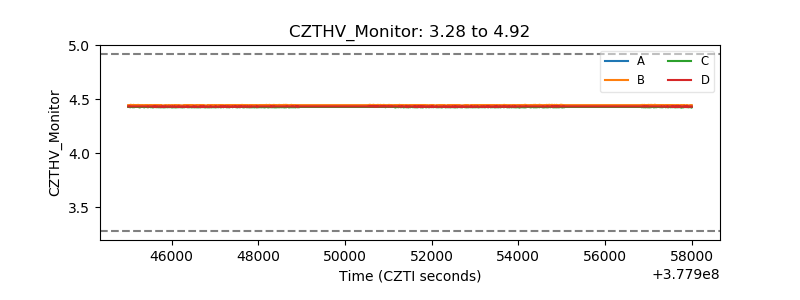 |
| D_VDD |  |
| Temperature 1 | 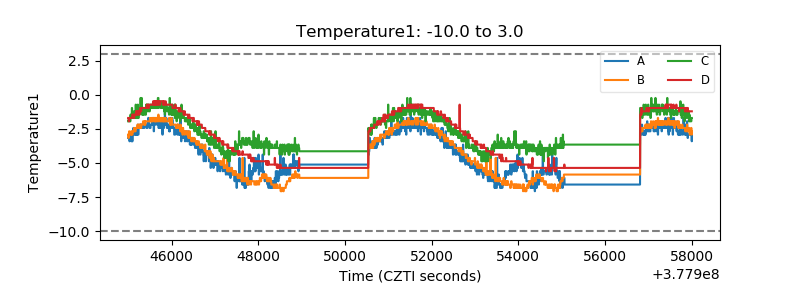 |
| Veto HV Monitor | 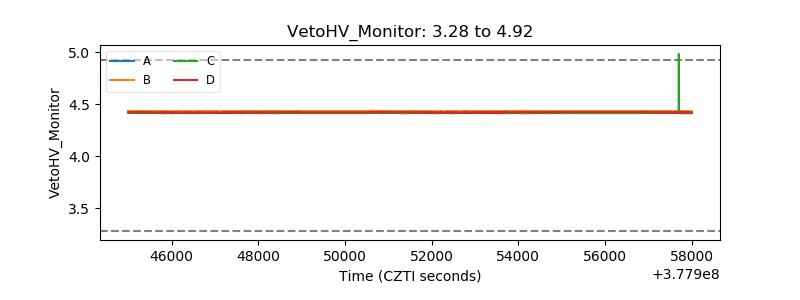 |
| Veto LLD | 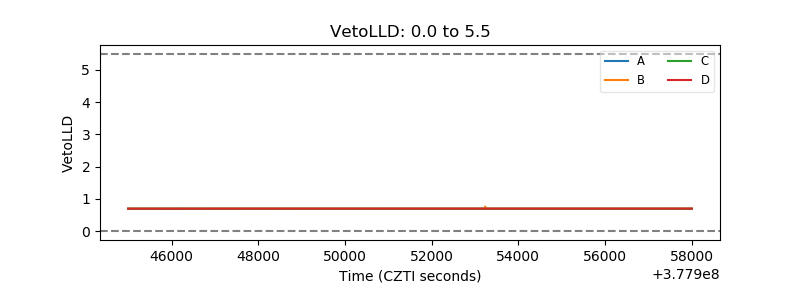 |
| Alpha Counter | 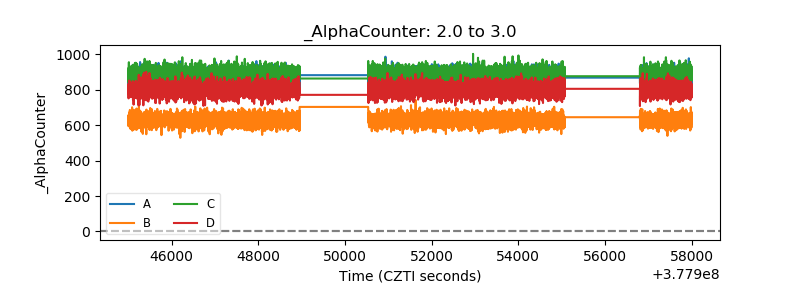 |
| _CPM_Rate | 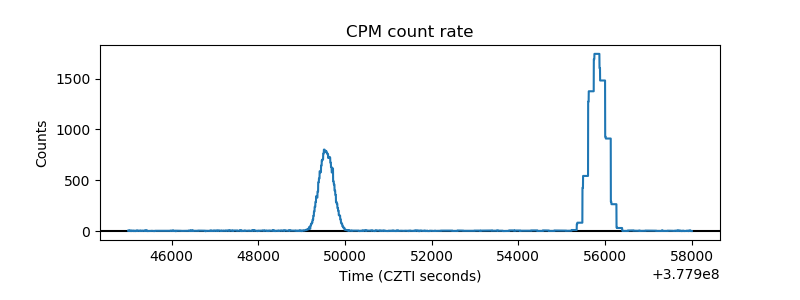 |
| CZT Counter | 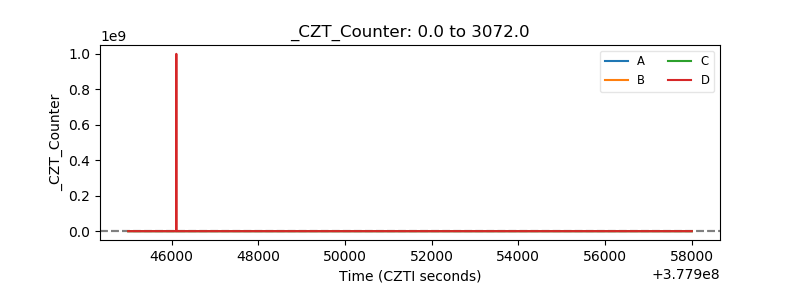 |
| +2.5 Volts monitor |  |
| +5 Volts monitor | 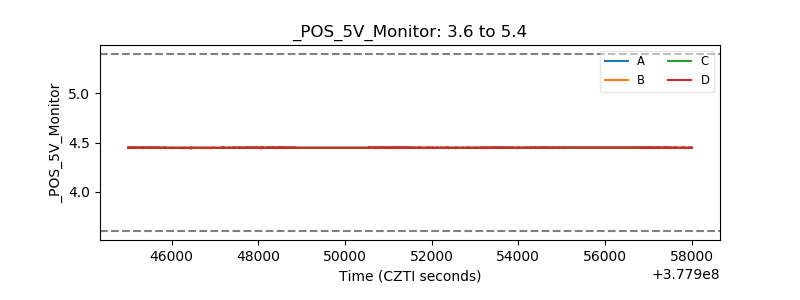 |
| _ROLL_ROT | 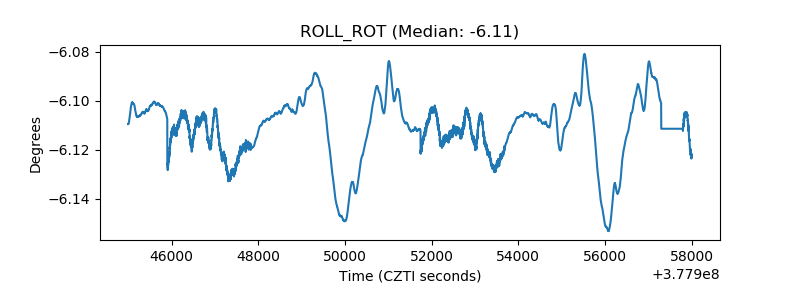 |
| _Roll_DEC | 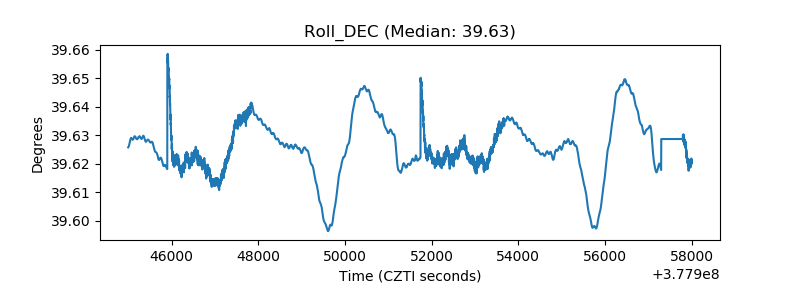 |
| _Roll_RA | 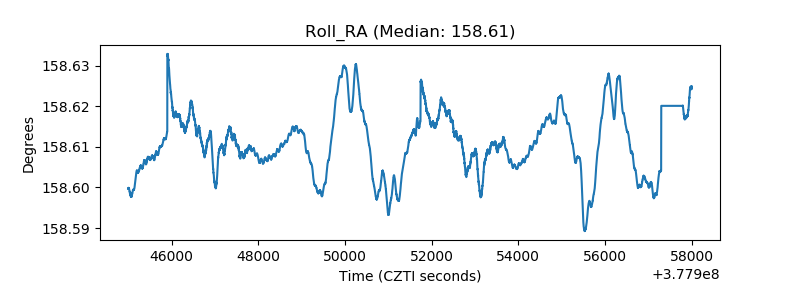 |
| Veto Counter | 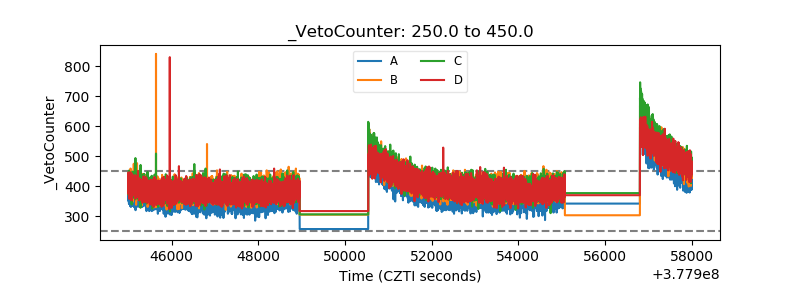 |