| Param | Original file | Final file |
|---|---|---|
| Filename | modeM0/AS1A11_086T01_9000004816_33725cztM0_level2.evt | modeM0/AS1A11_086T01_9000004816_33725cztM0_level2_quad_clean.evt |
| Size (bytes) | 487,759,680 | 58,150,080 |
| Size | 465.2 MB | 55.5 MB |
| Events in quadrant A | 3,107,290 | 348,331 |
| Events in quadrant B | 3,466,487 | 346,001 |
| Events in quadrant C | 3,276,466 | 347,920 |
| Events in quadrant D | 4,549,112 | 333,848 |
| Mode SS | |||
|---|---|---|---|
| Quadrant | BADHDUFLAG | Total packets | Discarded packets |
| A | 0 | 112 | 0 |
| B | 0 | 112 | 0 |
| C | 0 | 112 | 0 |
| D | 0 | 112 | 0 |
| Mode M9 | |||
|---|---|---|---|
| Quadrant | BADHDUFLAG | Total packets | Discarded packets |
| A | 0 | 29 | 0 |
| B | 0 | 29 | 0 |
| C | 0 | 29 | 0 |
| D | 0 | 30 | 0 |
| Mode M0 | |||
|---|---|---|---|
| Quadrant | BADHDUFLAG | Total packets | Discarded packets |
| A | 0 | 12672 | 3 |
| B | 0 | 13741 | 2 |
| C | 0 | 13106 | 2 |
| D | 0 | 17228 | 2 |
| Quadrant | Total seconds | Saturated seconds | Saturation percentage |
|---|---|---|---|
| A | 5491 | 85 | 1.547988% |
| B | 5491 | 208 | 3.788017% |
| C | 5491 | 69 | 1.256602% |
| D | 5491 | 364 | 6.629029% |
Noise dominated data is calculated using 1-second bins in cleaned event files. If a bin has >2000 counts, and if more than 50% of those come from <1% of pixels, then it is considered to be noise-dominated and hence unusable.
| Quadrant | # 1 sec bins | Bins with >0 counts | Bins with >2000 counts | High rate bins dominated by noise | Noise dominated (total time) | Noise dominated (detector-on time) | Marked lightcurve |
|---|---|---|---|---|---|---|---|
| A | 7344 | 5492 | 75 | 75 | 1.02% | 1.37% | 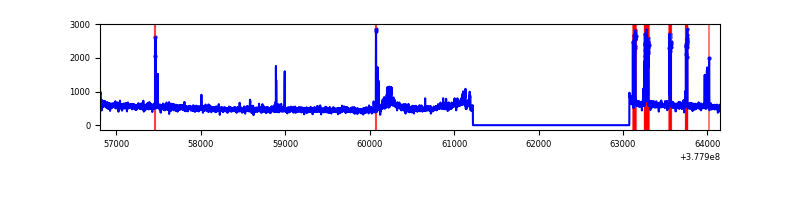 |
| B | 7344 | 5492 | 156 | 156 | 2.12% | 2.84% | 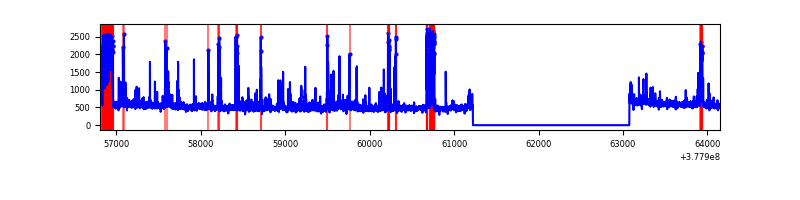 |
| C | 7344 | 5492 | 54 | 54 | 0.74% | 0.98% | 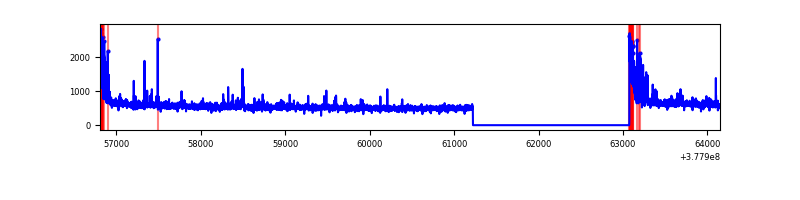 |
| D | 7344 | 5492 | 355 | 355 | 4.83% | 6.46% | 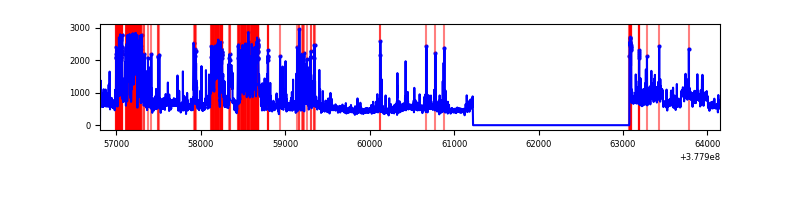 |
Top three noisy pixels from each quadrant. If the there are fewer than three noisy pixels in the level2.evt file, extra rows are filled as -1
| Pixel properties | Quadrant properties | ||||||
|---|---|---|---|---|---|---|---|
| Quadrant | DetID | PixID | Counts | Sigma | Mean | Median | Sigma |
| A | 14 | 4 | 196736 | 1417.52 | 704 | 691 | 138.3 |
| A | 15 | 169 | 156297 | 1125.13 | 704 | 691 | 138.3 |
| A | 15 | 237 | 21455 | 150.14 | 704 | 691 | 138.3 |
| B | 5 | 172 | 532621 | 4072.45 | 697 | 682 | 130.6 |
| B | 15 | 85 | 72013 | 546.1 | 697 | 682 | 130.6 |
| B | 5 | 255 | 40318 | 303.45 | 697 | 682 | 130.6 |
| C | 0 | 10 | 264389 | 1678.71 | 690 | 697 | 157.1 |
| C | 15 | 214 | 238118 | 1511.47 | 690 | 697 | 157.1 |
| C | 14 | 67 | 38528 | 240.84 | 690 | 697 | 157.1 |
| D | 13 | 249 | 487623 | 2923.19 | 680 | 663 | 166.6 |
| D | 12 | 16 | 454929 | 2726.93 | 680 | 663 | 166.6 |
| D | 8 | 195 | 422978 | 2535.13 | 680 | 663 | 166.6 |
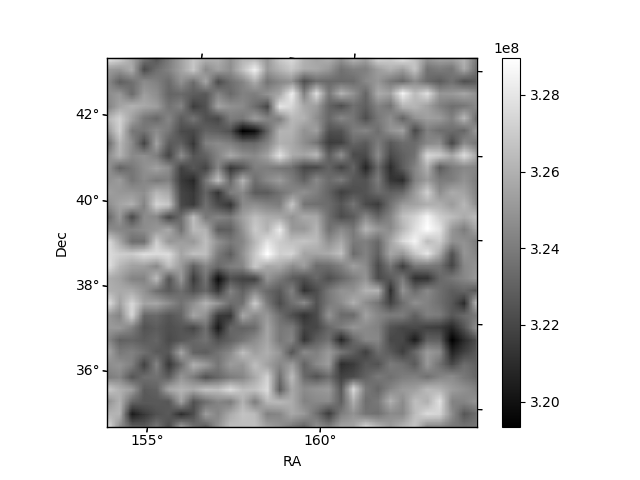
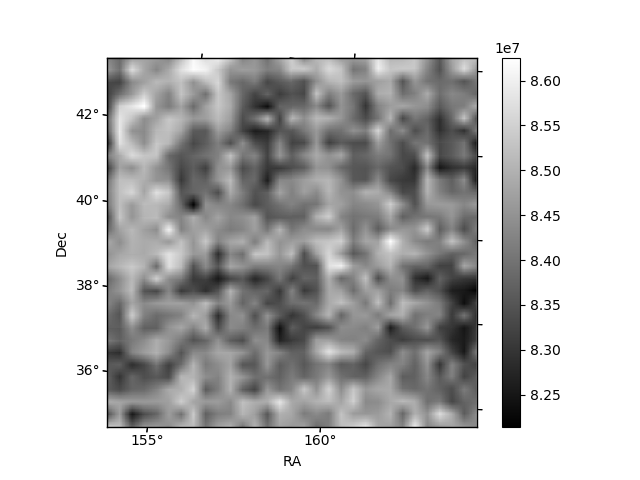
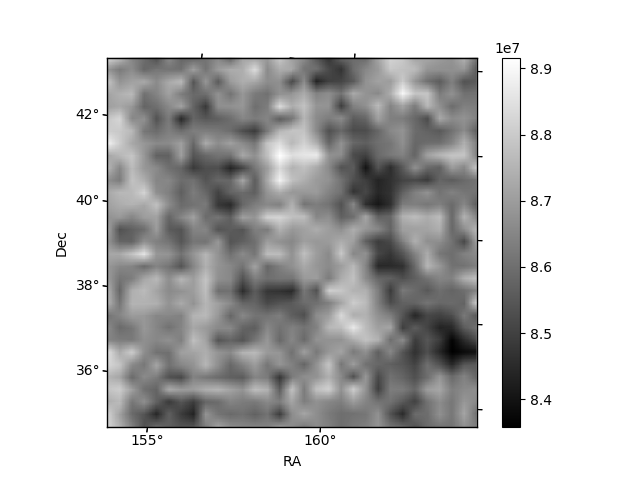
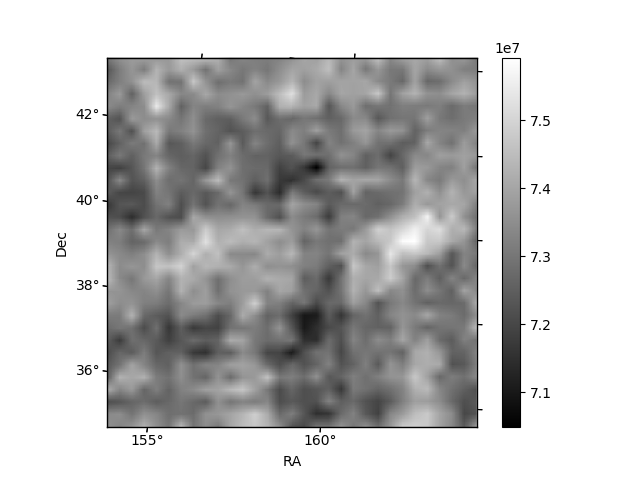
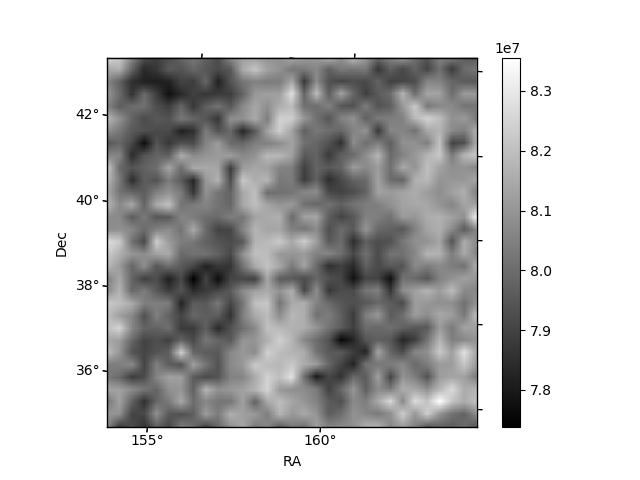
Histogram calculated using DETX and DETY for each event in the final _common_clean file
| Quadrant A | 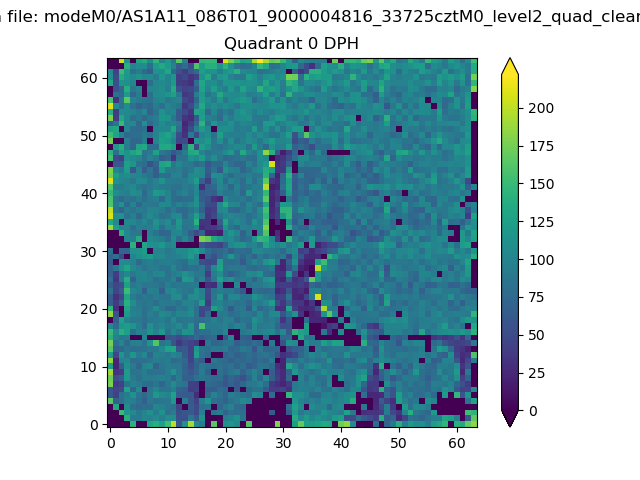 |
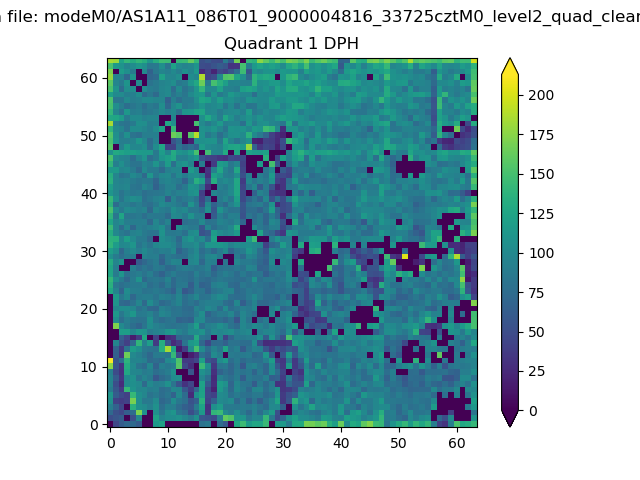 |
Quadrant B |
|---|---|---|---|
| Quadrant D | 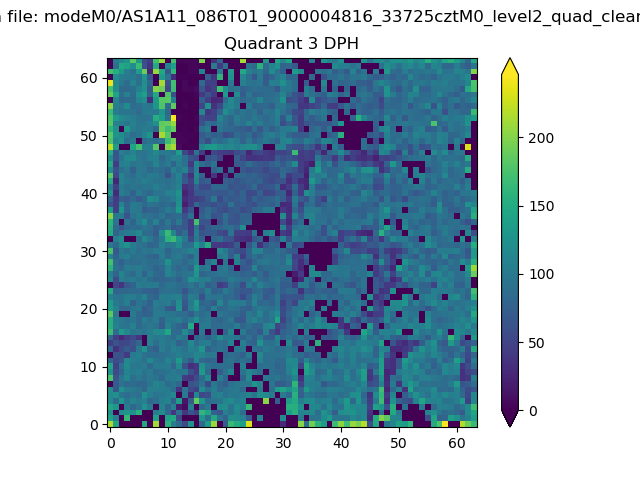 |
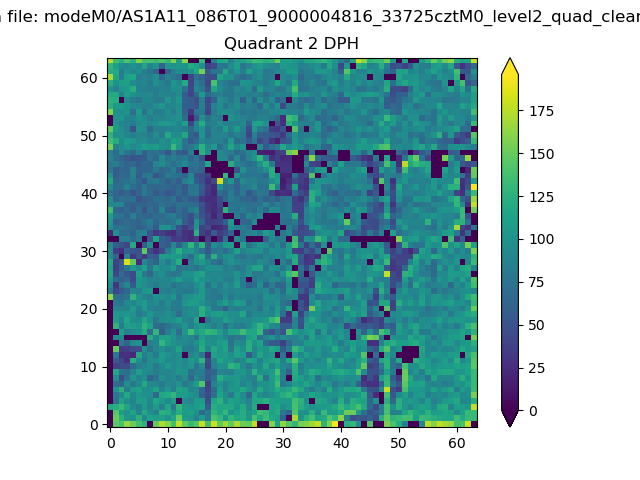 |
Quadrant C |
| Plot type | Count rate plots | Images |
|---|---|---|
| Comparison with Poisson distribution Blue bars denote a histogram of data divided into 1 sec bins. Red curve is a Poisson curve with rate = median count rate of data. |
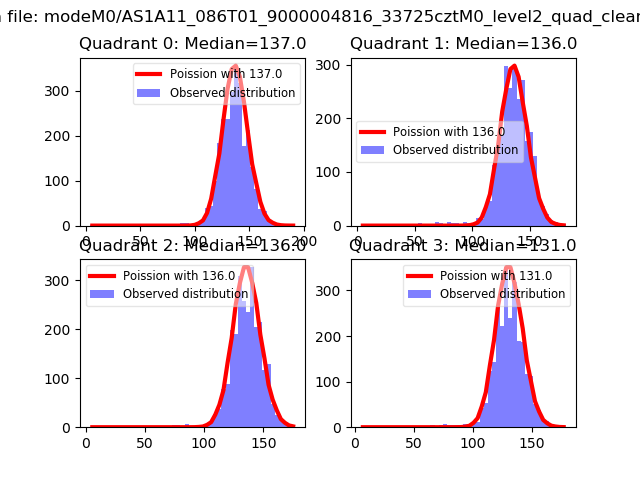 |
 |
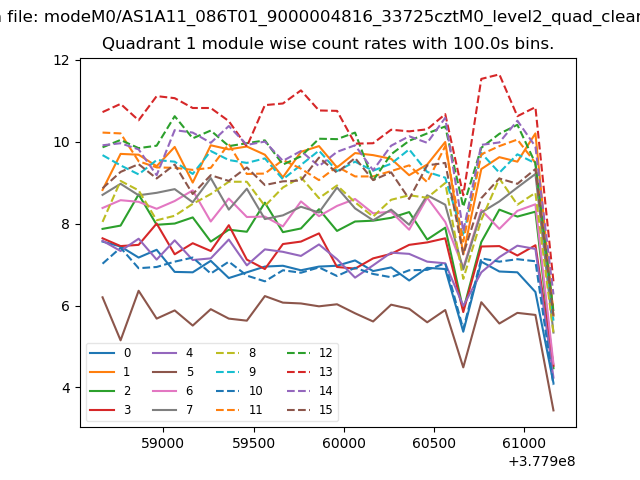
| Quadrant-wise count rates Data is divided into 100 sec bins |
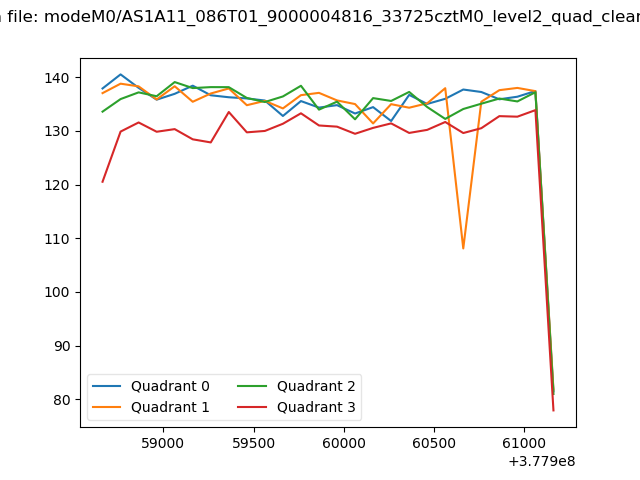 |
|
| Module-wise count rates for Quadrant A Data is divided into 100 sec bins |
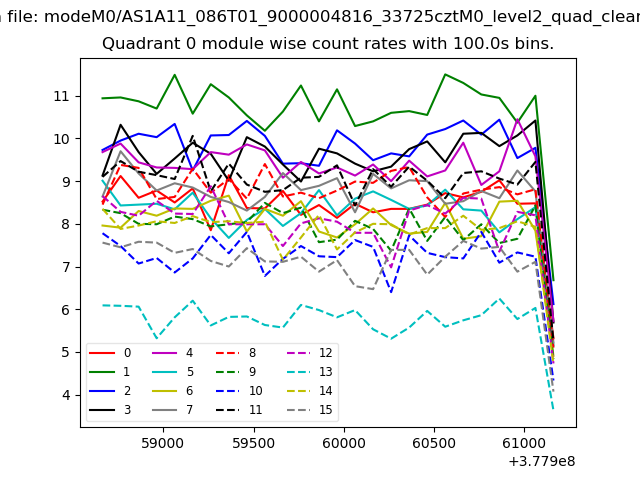 |
 |
| Module-wise count rates for Quadrant B Data is divided into 100 sec bins |
 |
 |
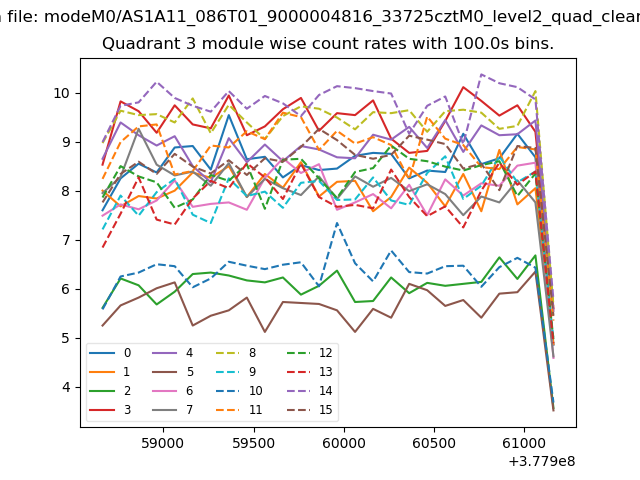
| Module-wise count rates for Quadrant C Data is divided into 100 sec bins |
 |
 |
| Module-wise count rates for Quadrant D Data is divided into 100 sec bins |
 |
 |
| Parameter | Plot |
|---|---|
| CZT HV Monitor | 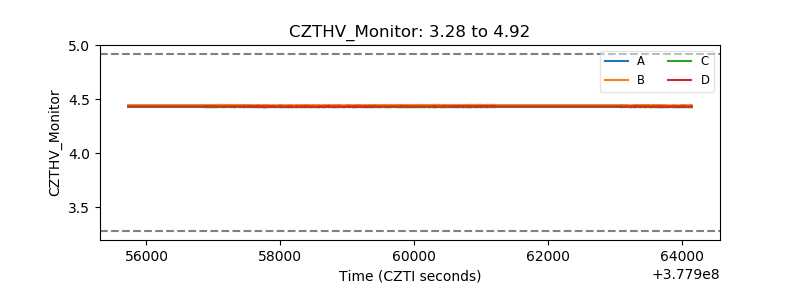 |
| D_VDD | 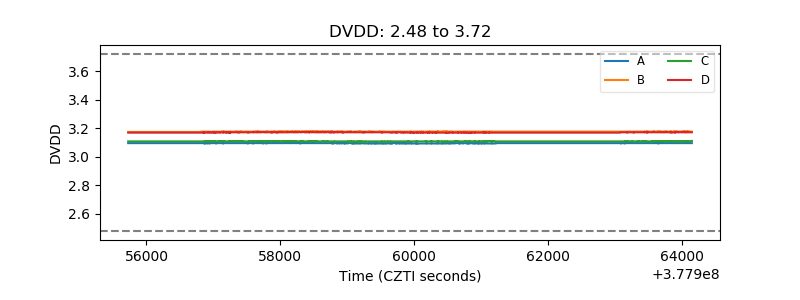 |
| Temperature 1 | 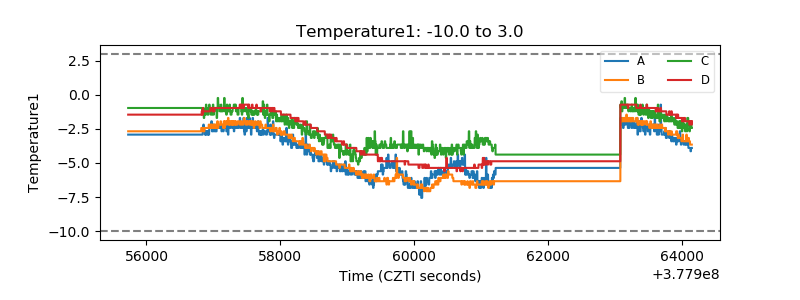 |
| Veto HV Monitor | 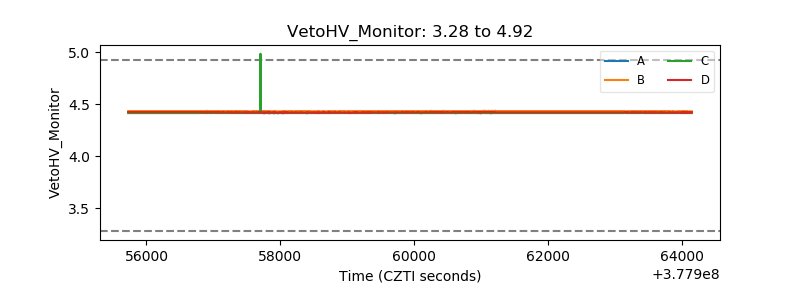 |
| Veto LLD | 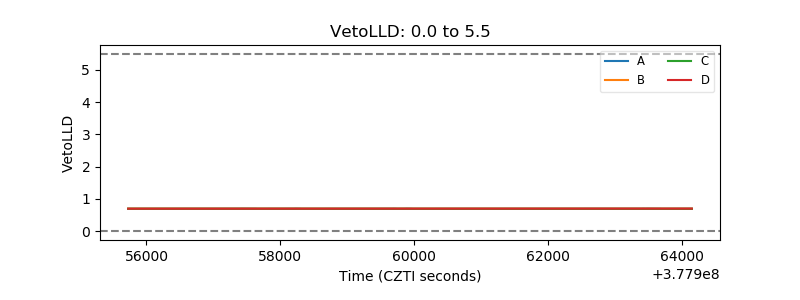 |
| Alpha Counter |  |
| _CPM_Rate |  |
| CZT Counter | 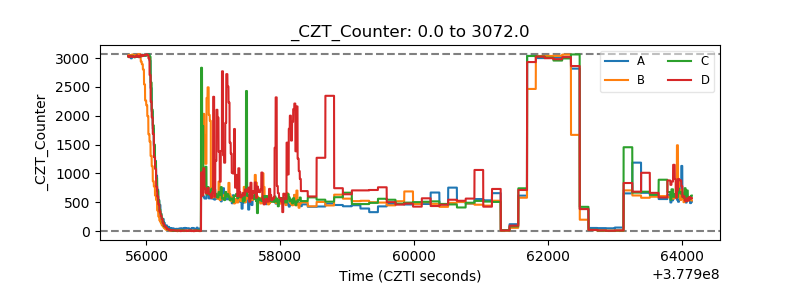 |
| +2.5 Volts monitor |  |
| +5 Volts monitor |  |
| _ROLL_ROT | 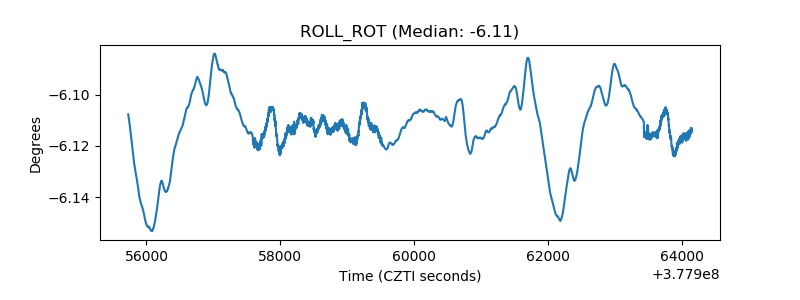 |
| _Roll_DEC | 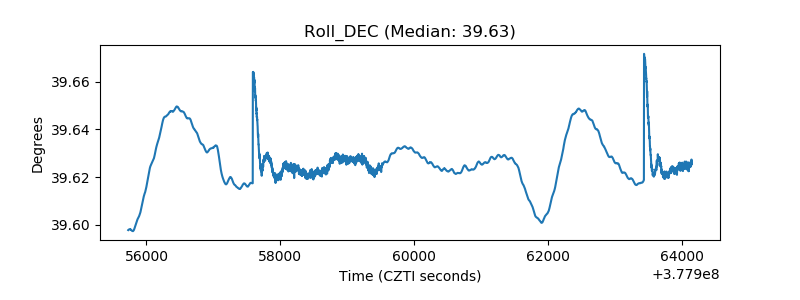 |
| _Roll_RA |  |
| Veto Counter | 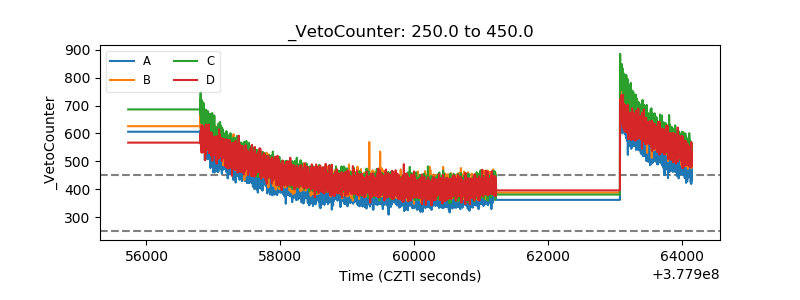 |