| Param | Original file | Final file |
|---|---|---|
| Filename | modeM0/AS1A11_086T01_9000004816_33726cztM0_level2.evt | modeM0/AS1A11_086T01_9000004816_33726cztM0_level2_quad_clean.evt |
| Size (bytes) | 470,393,280 | 65,675,520 |
| Size | 448.6 MB | 62.6 MB |
| Events in quadrant A | 2,934,566 | 412,882 |
| Events in quadrant B | 3,483,611 | 407,742 |
| Events in quadrant C | 3,235,101 | 414,825 |
| Events in quadrant D | 4,241,546 | 390,122 |
| Mode SS | |||
|---|---|---|---|
| Quadrant | BADHDUFLAG | Total packets | Discarded packets |
| A | 0 | 106 | 0 |
| B | 0 | 106 | 0 |
| C | 0 | 106 | 0 |
| D | 0 | 106 | 0 |
| Mode M9 | |||
|---|---|---|---|
| Quadrant | BADHDUFLAG | Total packets | Discarded packets |
| A | 0 | 31 | 0 |
| B | 0 | 31 | 0 |
| C | 0 | 31 | 0 |
| D | 0 | 32 | 0 |
| Mode M0 | |||
|---|---|---|---|
| Quadrant | BADHDUFLAG | Total packets | Discarded packets |
| A | 0 | 12024 | 3 |
| B | 0 | 13834 | 2 |
| C | 0 | 12965 | 2 |
| D | 0 | 16216 | 2 |
| Quadrant | Total seconds | Saturated seconds | Saturation percentage |
|---|---|---|---|
| A | 5178 | 107 | 2.066435% |
| B | 5178 | 159 | 3.070684% |
| C | 5178 | 69 | 1.332561% |
| D | 5178 | 166 | 3.205871% |
Noise dominated data is calculated using 1-second bins in cleaned event files. If a bin has >2000 counts, and if more than 50% of those come from <1% of pixels, then it is considered to be noise-dominated and hence unusable.
| Quadrant | # 1 sec bins | Bins with >0 counts | Bins with >2000 counts | High rate bins dominated by noise | Noise dominated (total time) | Noise dominated (detector-on time) | Marked lightcurve |
|---|---|---|---|---|---|---|---|
| A | 7150 | 5179 | 95 | 95 | 1.33% | 1.83% | 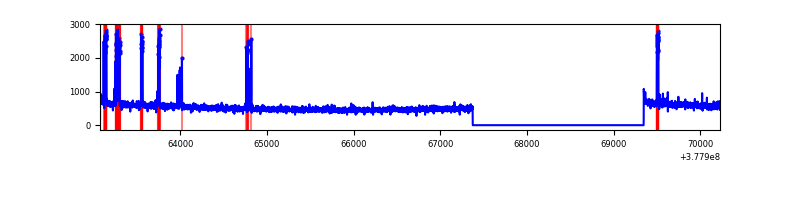 |
| B | 7150 | 5179 | 114 | 114 | 1.59% | 2.20% | 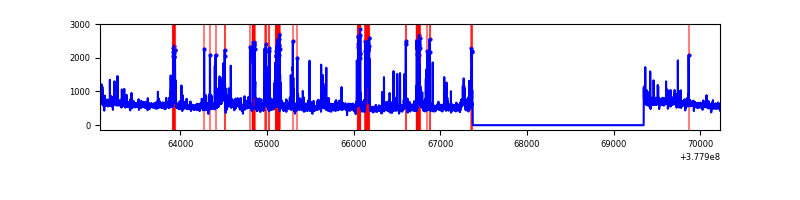 |
| C | 7150 | 5179 | 53 | 53 | 0.74% | 1.02% | 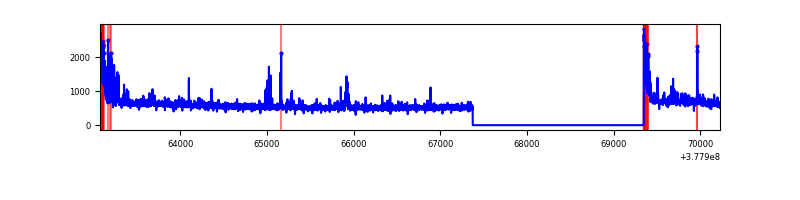 |
| D | 7150 | 5179 | 147 | 147 | 2.06% | 2.84% | 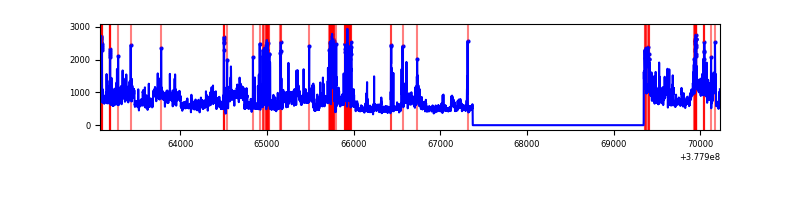 |
Top three noisy pixels from each quadrant. If the there are fewer than three noisy pixels in the level2.evt file, extra rows are filled as -1
| Pixel properties | Quadrant properties | ||||||
|---|---|---|---|---|---|---|---|
| Quadrant | DetID | PixID | Counts | Sigma | Mean | Median | Sigma |
| A | 14 | 4 | 242594 | 1803.16 | 685 | 674 | 134.2 |
| A | 15 | 237 | 27300 | 198.46 | 685 | 674 | 134.2 |
| A | 10 | 83 | 9579 | 66.37 | 685 | 674 | 134.2 |
| B | 5 | 172 | 493380 | 3868.8 | 687 | 672 | 127.4 |
| B | 0 | 245 | 134517 | 1050.97 | 687 | 672 | 127.4 |
| B | 15 | 85 | 49947 | 386.91 | 687 | 672 | 127.4 |
| C | 0 | 10 | 243184 | 1583.75 | 678 | 684 | 153.1 |
| C | 15 | 214 | 224732 | 1463.24 | 678 | 684 | 153.1 |
| C | 9 | 54 | 58018 | 374.44 | 678 | 684 | 153.1 |
| D | 8 | 195 | 868642 | 5314.79 | 672 | 654 | 163.3 |
| D | 2 | 250 | 220013 | 1343.16 | 672 | 654 | 163.3 |
| D | 13 | 249 | 192443 | 1174.35 | 672 | 654 | 163.3 |
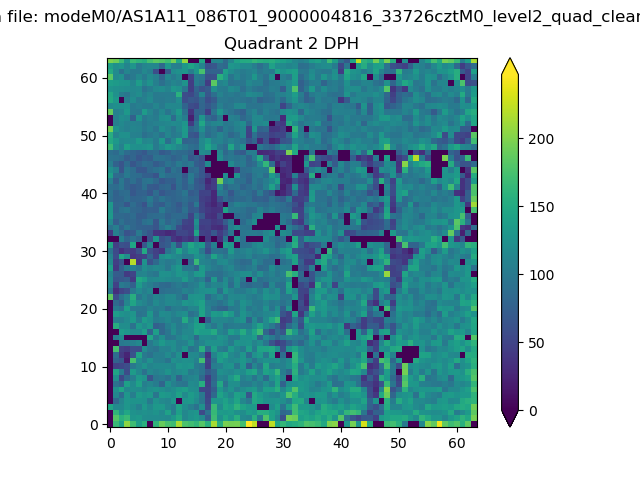
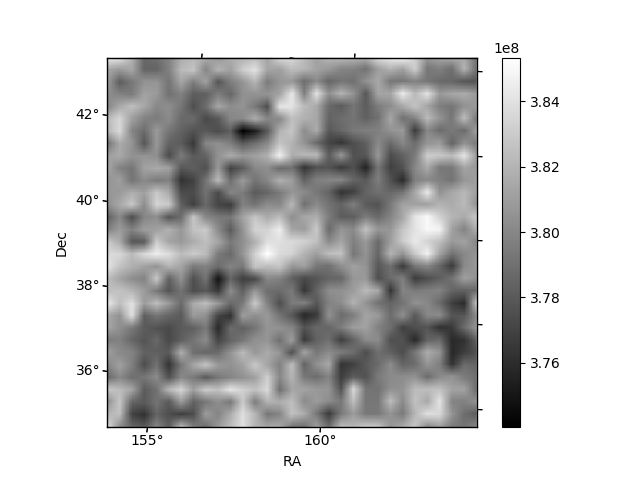
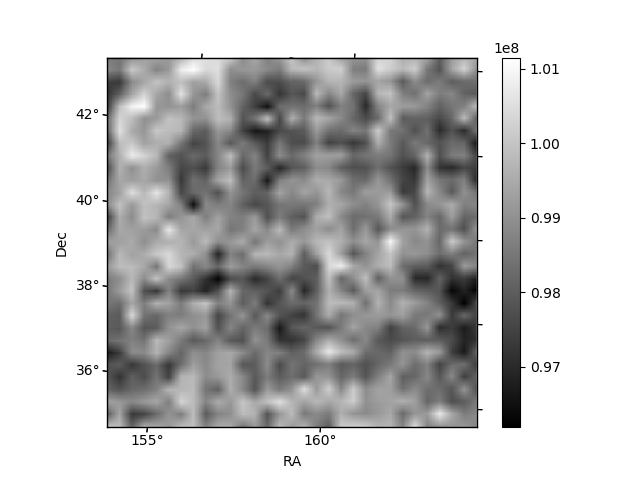
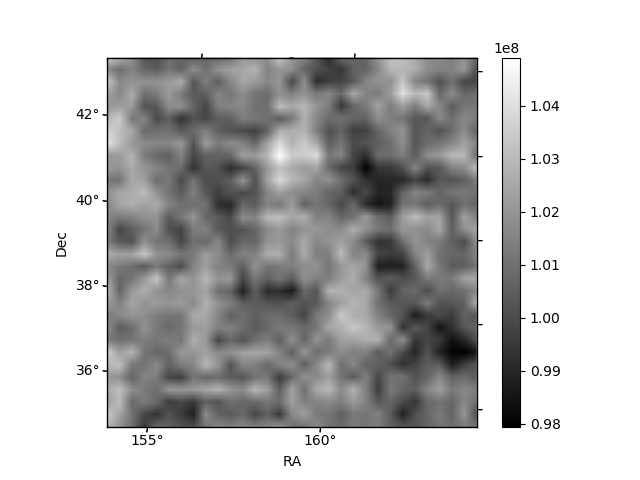
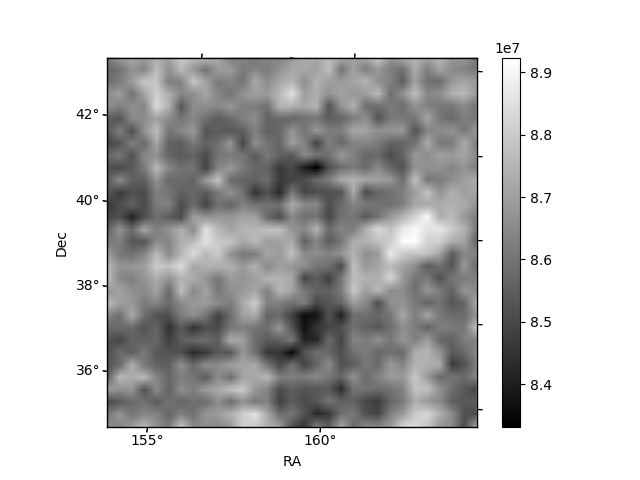
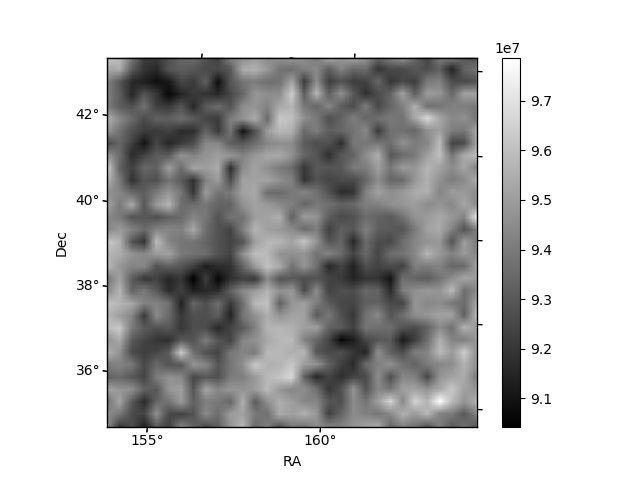
Histogram calculated using DETX and DETY for each event in the final _common_clean file
| Quadrant A | 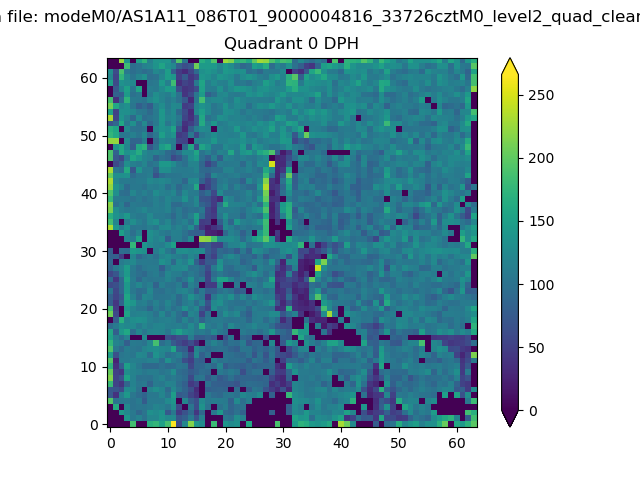 |
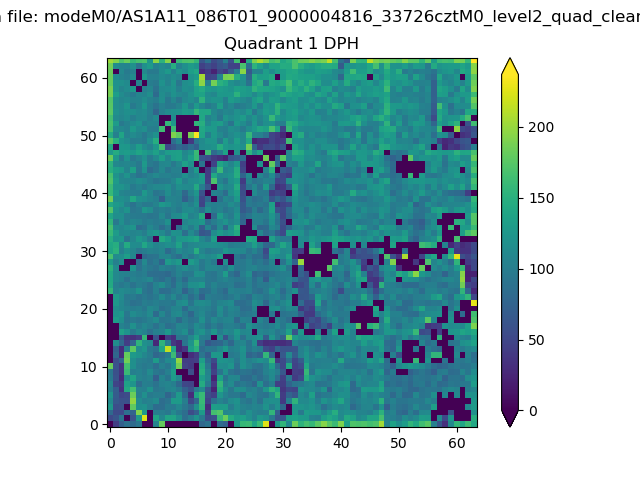 |
Quadrant B |
|---|---|---|---|
| Quadrant D | 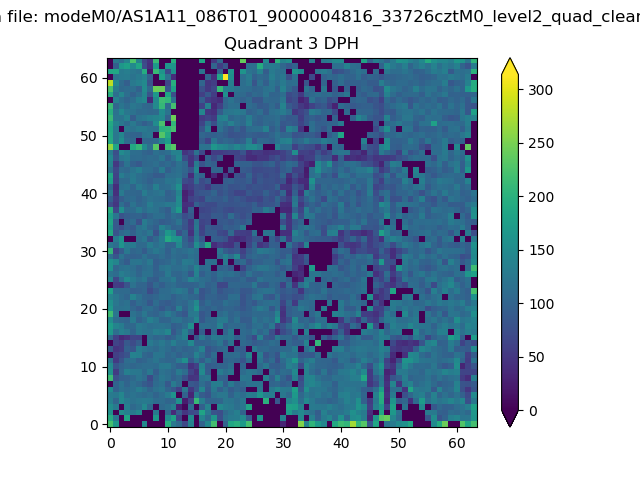 |
 |
Quadrant C |
| Plot type | Count rate plots | Images |
|---|---|---|
| Comparison with Poisson distribution Blue bars denote a histogram of data divided into 1 sec bins. Red curve is a Poisson curve with rate = median count rate of data. |
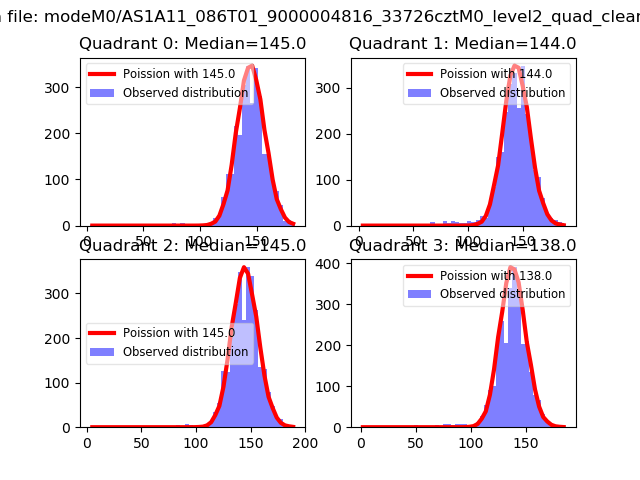 |
 |
| Quadrant-wise count rates Data is divided into 100 sec bins |
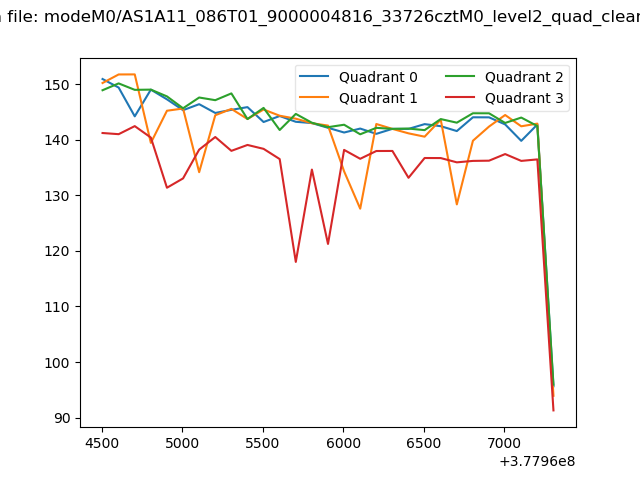 |
|
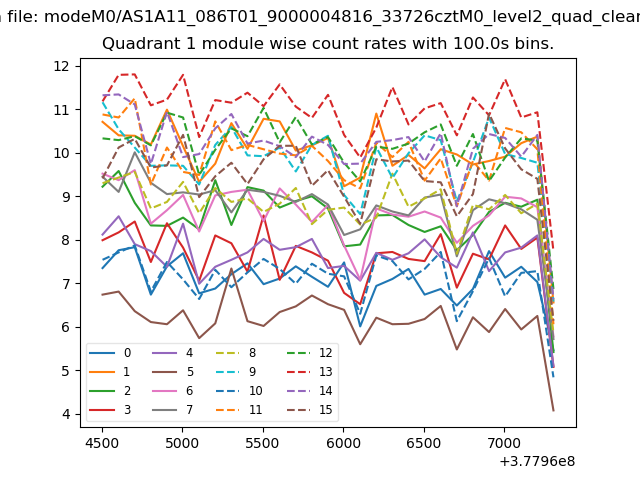
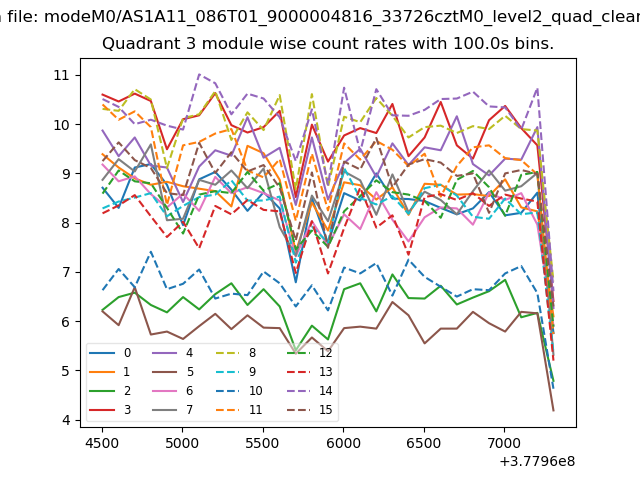
| Module-wise count rates for Quadrant A Data is divided into 100 sec bins |
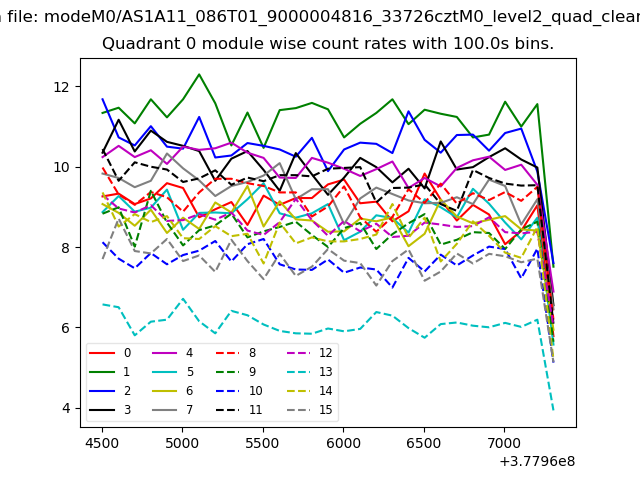 |
 |
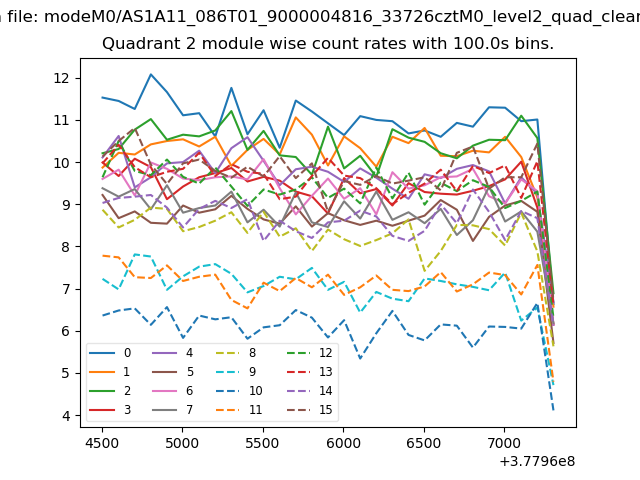
| Module-wise count rates for Quadrant B Data is divided into 100 sec bins |
 |
 |
| Module-wise count rates for Quadrant C Data is divided into 100 sec bins |
 |
 |
| Module-wise count rates for Quadrant D Data is divided into 100 sec bins |
 |
 |
| Parameter | Plot |
|---|---|
| CZT HV Monitor | 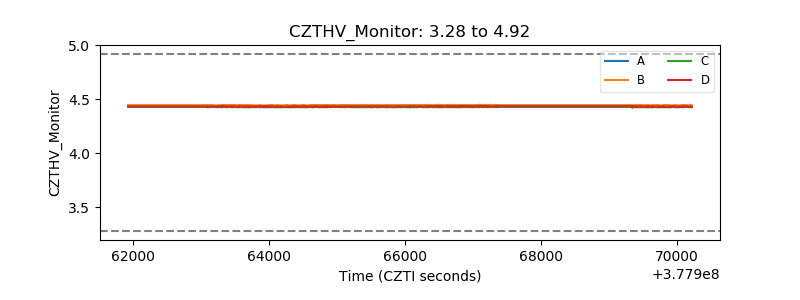 |
| D_VDD | 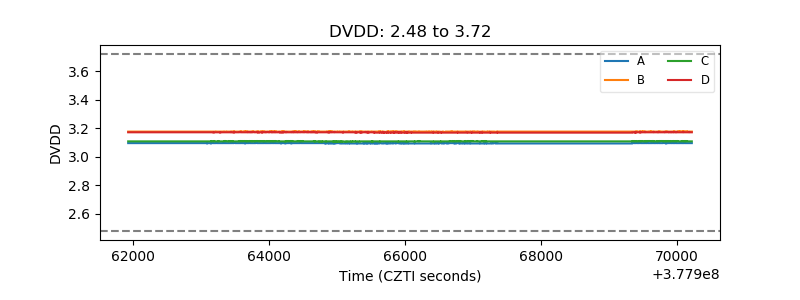 |
| Temperature 1 | 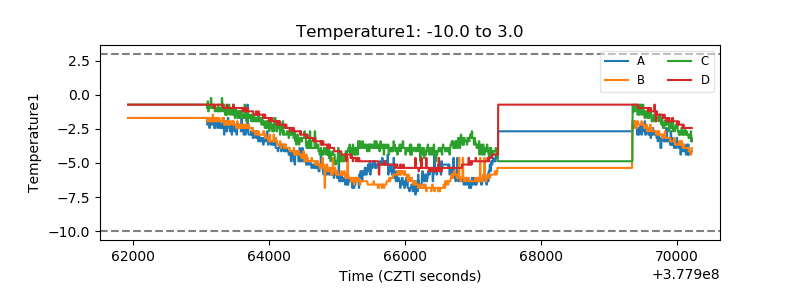 |
| Veto HV Monitor |  |
| Veto LLD | 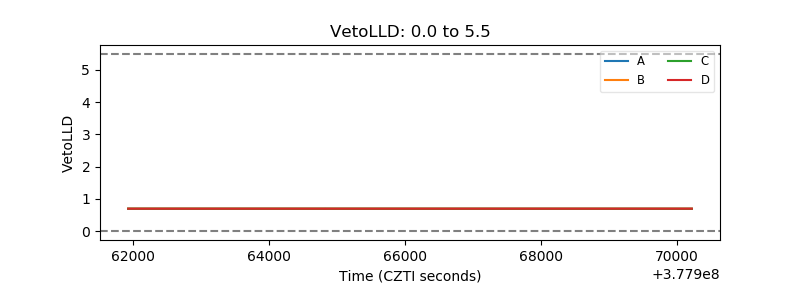 |
| Alpha Counter | 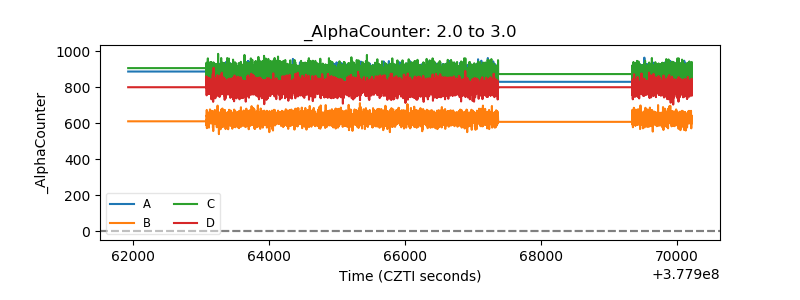 |
| _CPM_Rate | 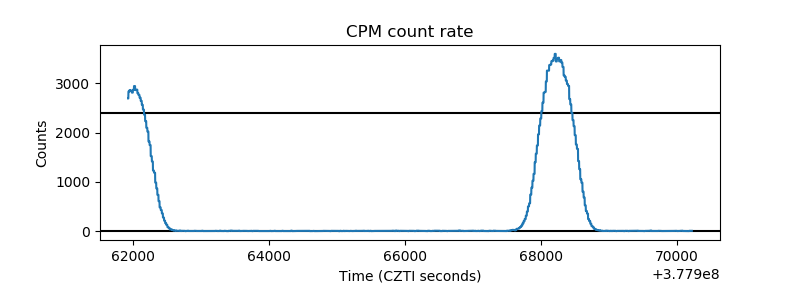 |
| CZT Counter | 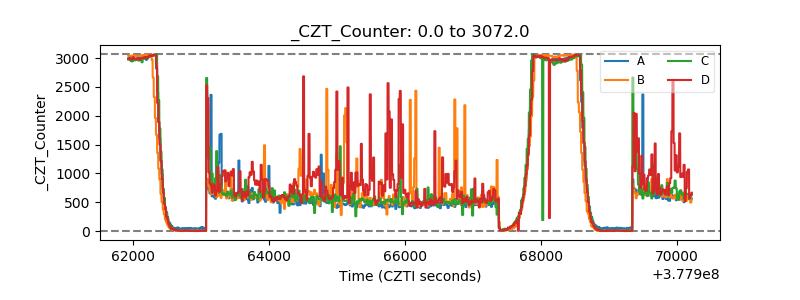 |
| +2.5 Volts monitor |  |
| +5 Volts monitor |  |
| _ROLL_ROT | 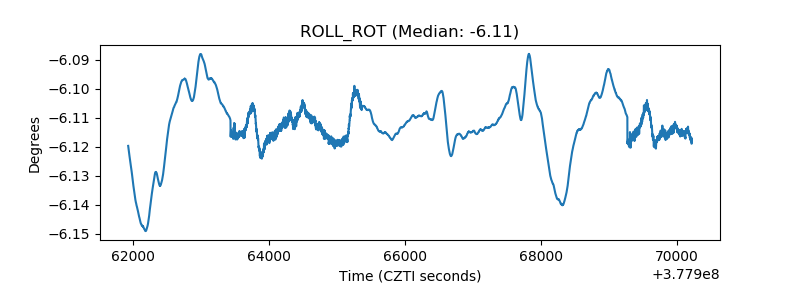 |
| _Roll_DEC | 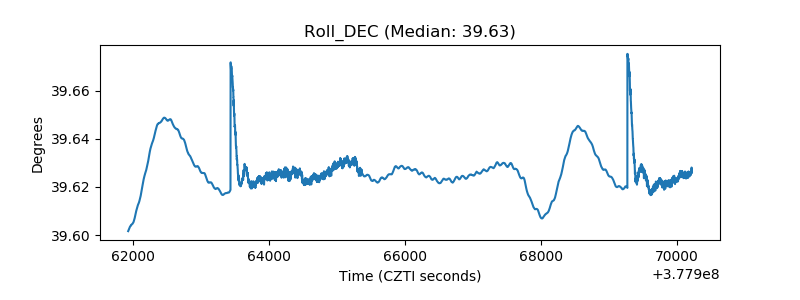 |
| _Roll_RA | 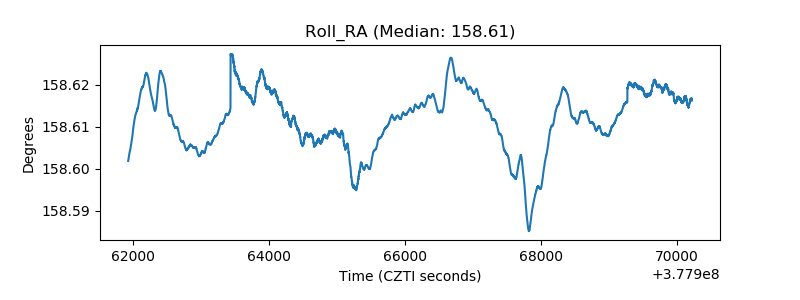 |
| Veto Counter | 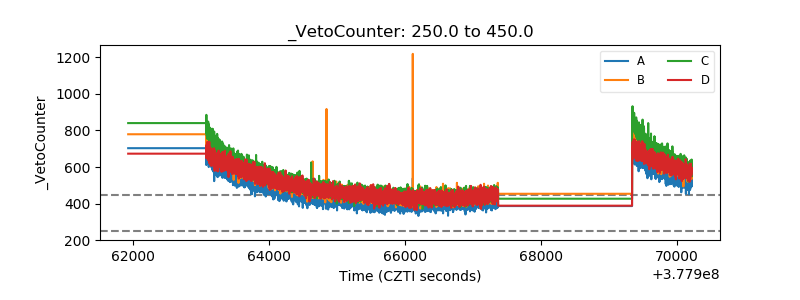 |