| Param | Original file | Final file |
|---|---|---|
| Filename | modeM0/AS1A11_086T01_9000004816_33727cztM0_level2.evt | modeM0/AS1A11_086T01_9000004816_33727cztM0_level2_quad_clean.evt |
| Size (bytes) | 457,182,720 | 79,430,400 |
| Size | 436.0 MB | 75.8 MB |
| Events in quadrant A | 2,696,315 | 518,822 |
| Events in quadrant B | 3,262,284 | 518,964 |
| Events in quadrant C | 3,144,645 | 525,869 |
| Events in quadrant D | 4,401,565 | 488,911 |
| Mode SS | |||
|---|---|---|---|
| Quadrant | BADHDUFLAG | Total packets | Discarded packets |
| A | 0 | 102 | 0 |
| B | 0 | 102 | 0 |
| C | 0 | 102 | 0 |
| D | 0 | 102 | 0 |
| Mode M9 | |||
|---|---|---|---|
| Quadrant | BADHDUFLAG | Total packets | Discarded packets |
| A | 0 | 33 | 0 |
| B | 0 | 33 | 0 |
| C | 0 | 33 | 0 |
| D | 0 | 34 | 0 |
| Mode M0 | |||
|---|---|---|---|
| Quadrant | BADHDUFLAG | Total packets | Discarded packets |
| A | 0 | 11153 | 3 |
| B | 0 | 13012 | 2 |
| C | 0 | 12586 | 2 |
| D | 0 | 16585 | 2 |
| Quadrant | Total seconds | Saturated seconds | Saturation percentage |
|---|---|---|---|
| A | 5033 | 26 | 0.516591% |
| B | 5033 | 105 | 2.086231% |
| C | 5033 | 74 | 1.470296% |
| D | 5033 | 213 | 4.232068% |
Noise dominated data is calculated using 1-second bins in cleaned event files. If a bin has >2000 counts, and if more than 50% of those come from <1% of pixels, then it is considered to be noise-dominated and hence unusable.
| Quadrant | # 1 sec bins | Bins with >0 counts | Bins with >2000 counts | High rate bins dominated by noise | Noise dominated (total time) | Noise dominated (detector-on time) | Marked lightcurve |
|---|---|---|---|---|---|---|---|
| A | 7126 | 5034 | 22 | 22 | 0.31% | 0.44% | 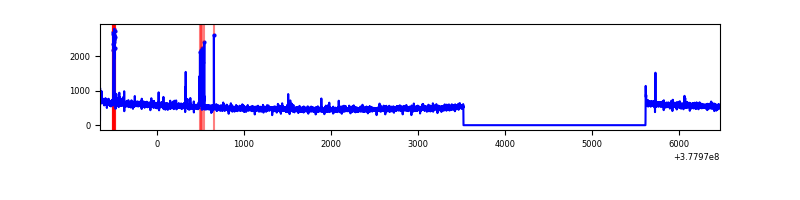 |
| B | 7126 | 5034 | 80 | 80 | 1.12% | 1.59% | 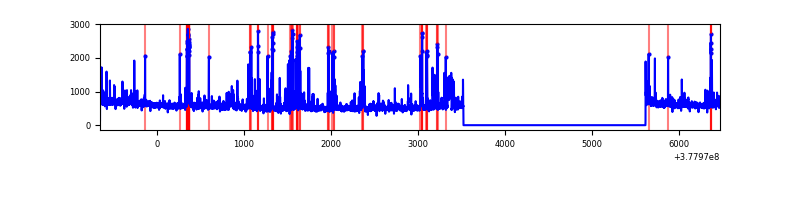 |
| C | 7126 | 5034 | 52 | 52 | 0.73% | 1.03% | 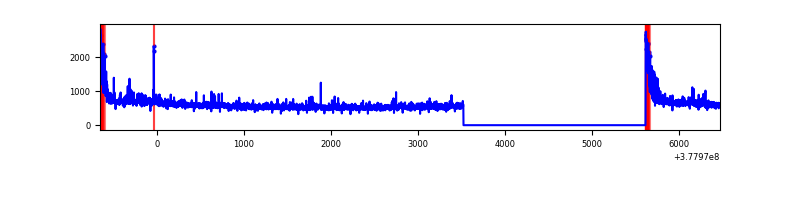 |
| D | 7126 | 5034 | 207 | 207 | 2.90% | 4.11% | 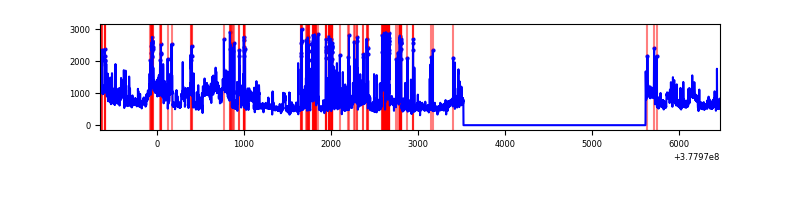 |
Top three noisy pixels from each quadrant. If the there are fewer than three noisy pixels in the level2.evt file, extra rows are filled as -1
| Pixel properties | Quadrant properties | ||||||
|---|---|---|---|---|---|---|---|
| Quadrant | DetID | PixID | Counts | Sigma | Mean | Median | Sigma |
| A | 14 | 4 | 84868 | 638.37 | 670 | 660 | 131.9 |
| A | 13 | 254 | 9605 | 67.81 | 670 | 660 | 131.9 |
| A | 10 | 83 | 9533 | 67.27 | 670 | 660 | 131.9 |
| B | 5 | 172 | 359238 | 2876.32 | 672 | 659 | 124.7 |
| B | 5 | 184 | 55973 | 443.7 | 672 | 659 | 124.7 |
| B | 0 | 245 | 55679 | 441.34 | 672 | 659 | 124.7 |
| C | 0 | 10 | 221457 | 1470.43 | 666 | 674 | 150.1 |
| C | 15 | 214 | 218939 | 1453.66 | 666 | 674 | 150.1 |
| C | 14 | 67 | 33959 | 221.68 | 666 | 674 | 150.1 |
| D | 8 | 195 | 873901 | 5508.96 | 655 | 639 | 158.5 |
| D | 12 | 16 | 358420 | 2257.06 | 655 | 639 | 158.5 |
| D | 2 | 250 | 225742 | 1420.06 | 655 | 639 | 158.5 |
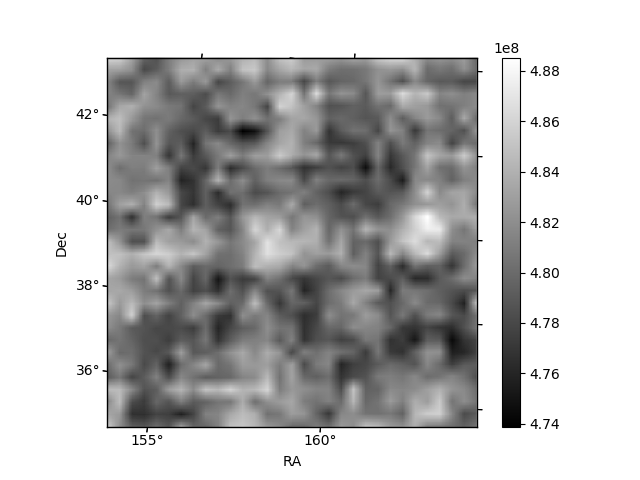
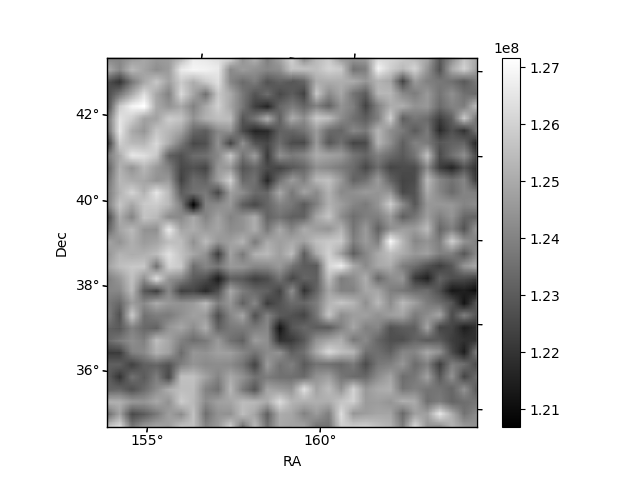
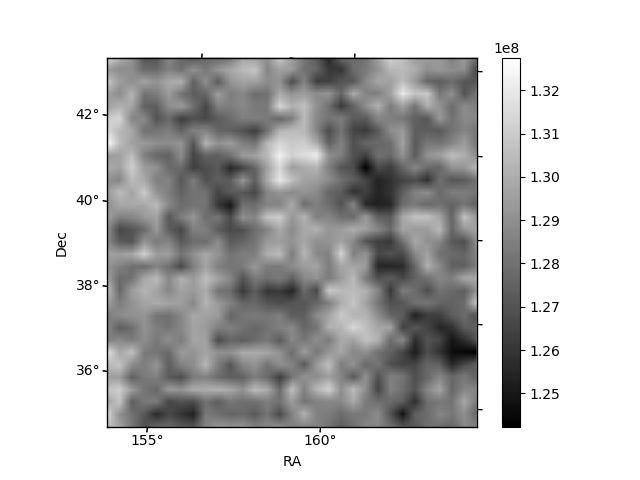
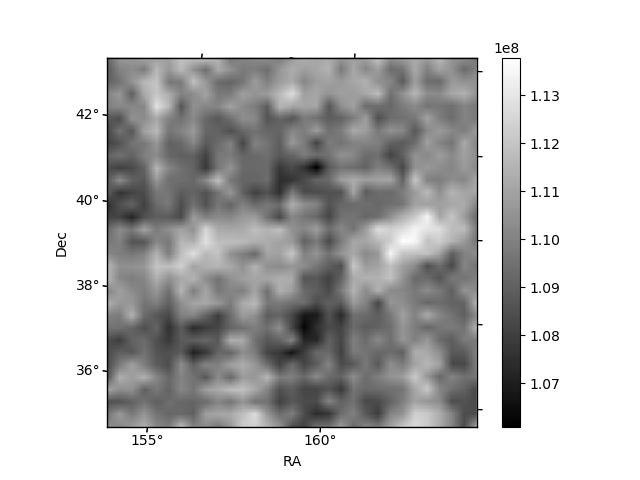
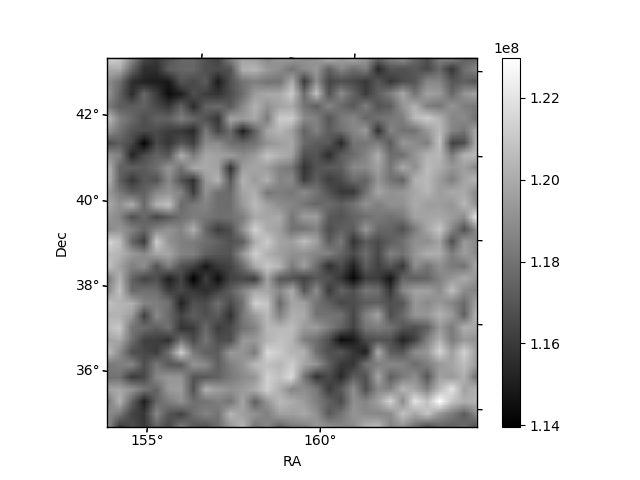
Histogram calculated using DETX and DETY for each event in the final _common_clean file
| Quadrant A | 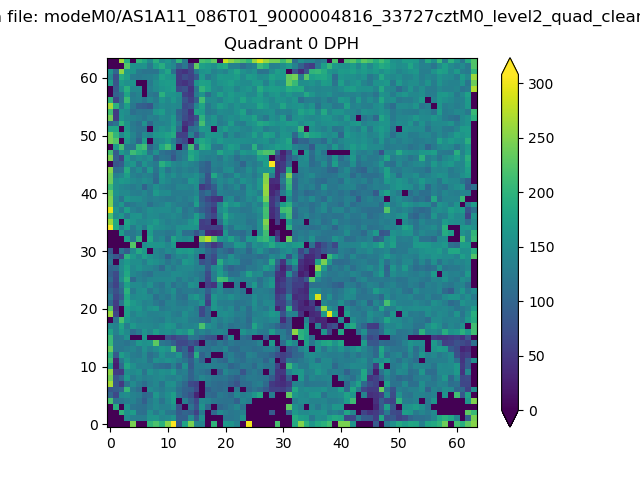 |
 |
Quadrant B |
|---|---|---|---|
| Quadrant D | 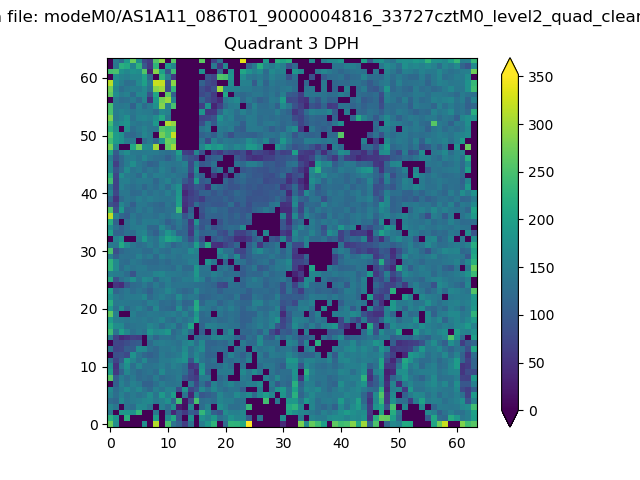 |
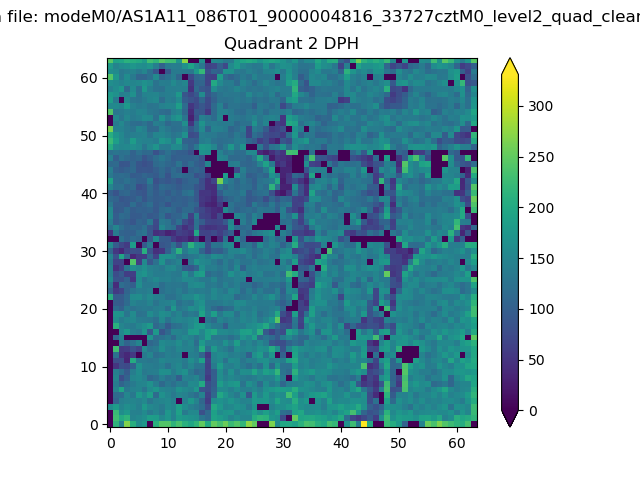 |
Quadrant C |
| Plot type | Count rate plots | Images |
|---|---|---|
| Comparison with Poisson distribution Blue bars denote a histogram of data divided into 1 sec bins. Red curve is a Poisson curve with rate = median count rate of data. |
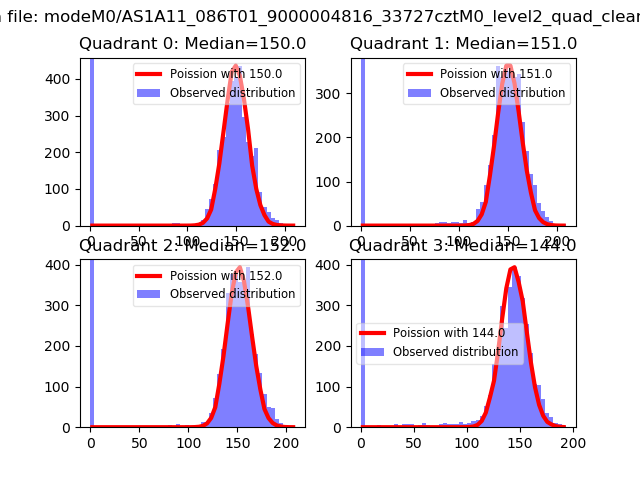 |
 |
| Quadrant-wise count rates Data is divided into 100 sec bins |
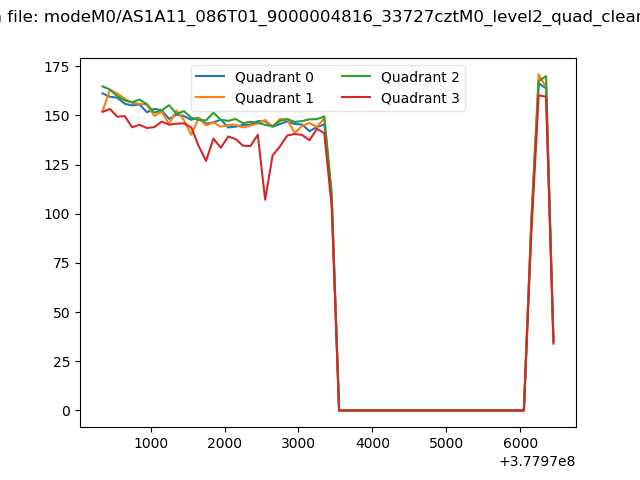 |
|
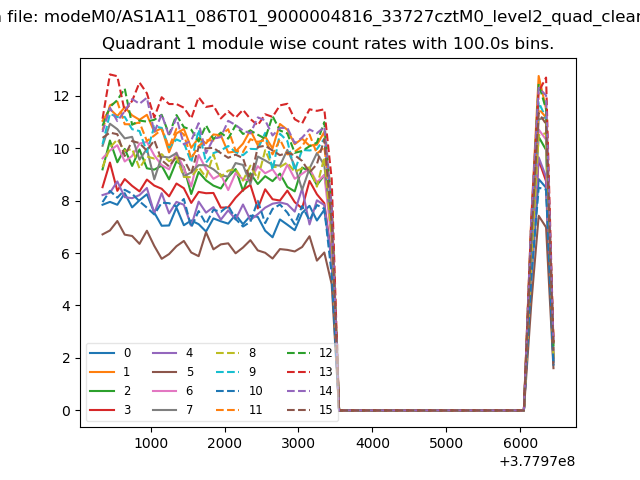
| Module-wise count rates for Quadrant A Data is divided into 100 sec bins |
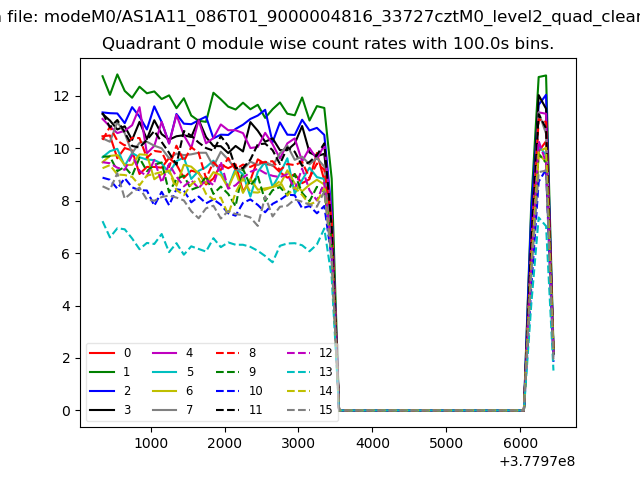 |
 |
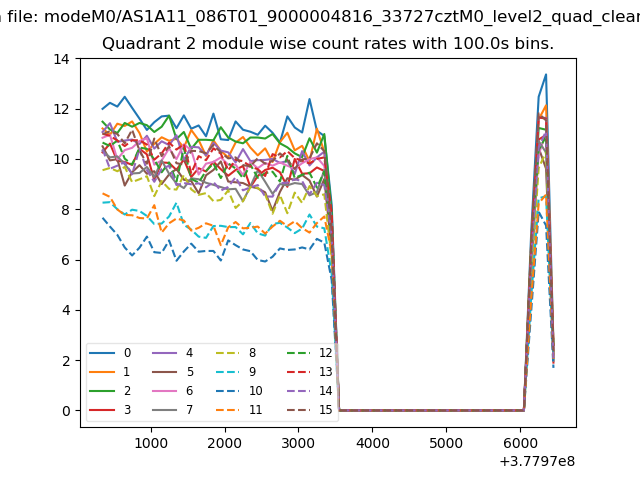
| Module-wise count rates for Quadrant B Data is divided into 100 sec bins |
 |
 |
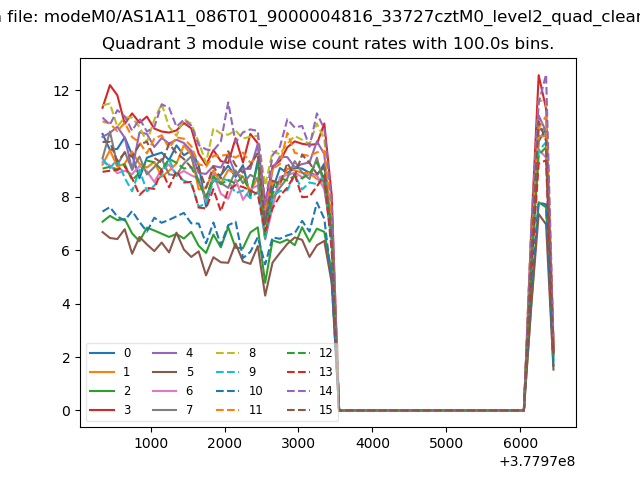
| Module-wise count rates for Quadrant C Data is divided into 100 sec bins |
 |
 |
| Module-wise count rates for Quadrant D Data is divided into 100 sec bins |
 |
 |
| Parameter | Plot |
|---|---|
| CZT HV Monitor | 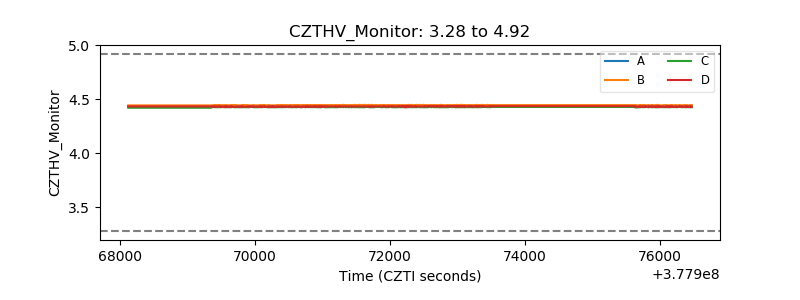 |
| D_VDD | 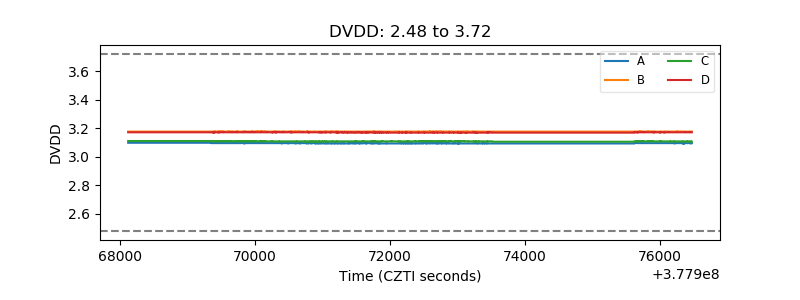 |
| Temperature 1 | 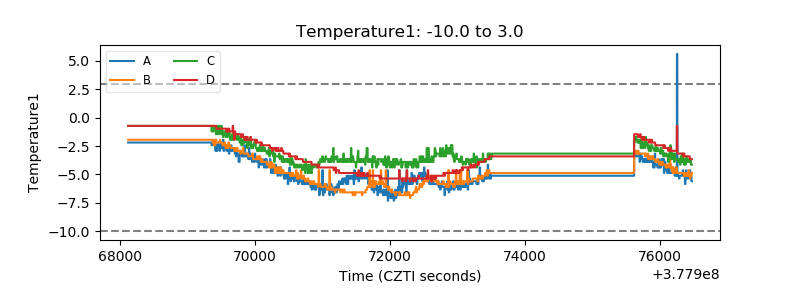 |
| Veto HV Monitor | 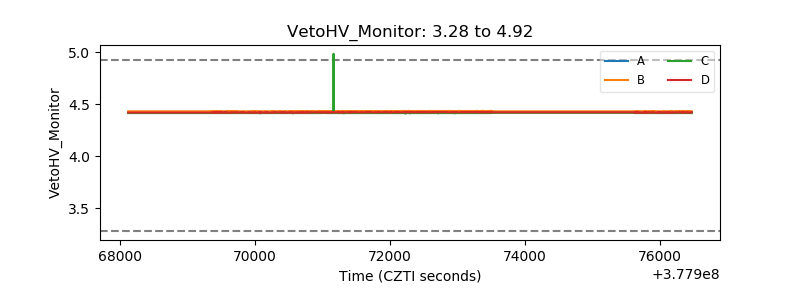 |
| Veto LLD | 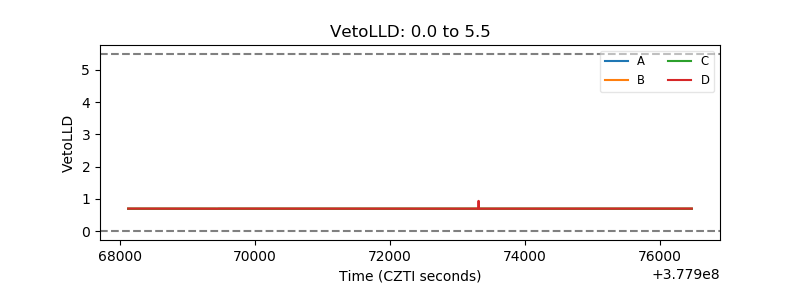 |
| Alpha Counter | 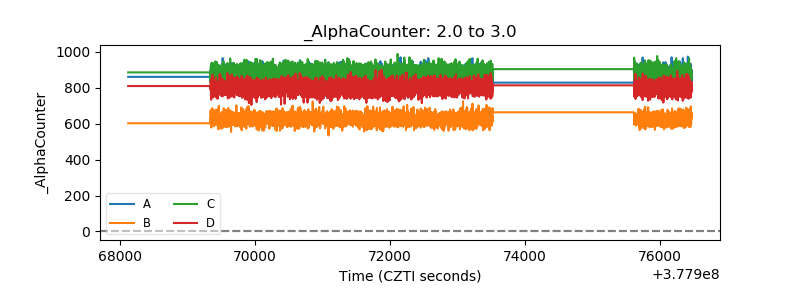 |
| _CPM_Rate |  |
| CZT Counter | 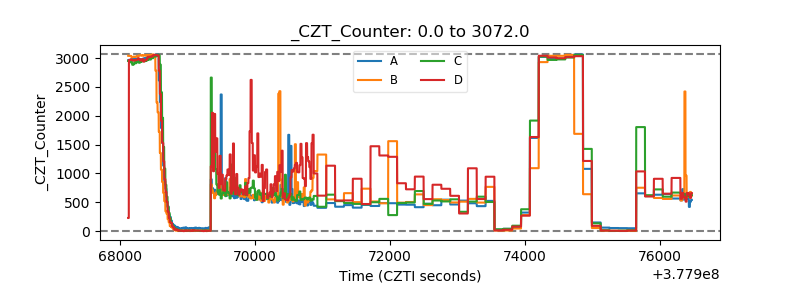 |
| +2.5 Volts monitor | 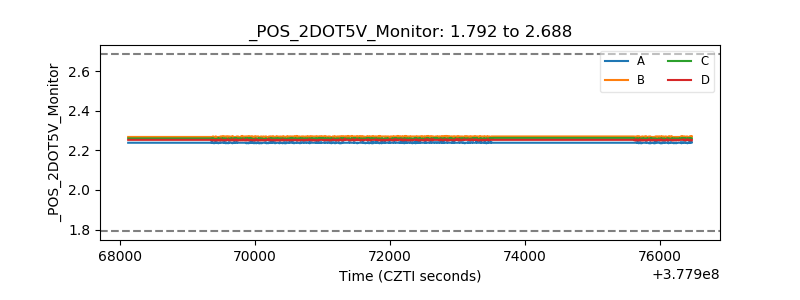 |
| +5 Volts monitor |  |
| _ROLL_ROT | 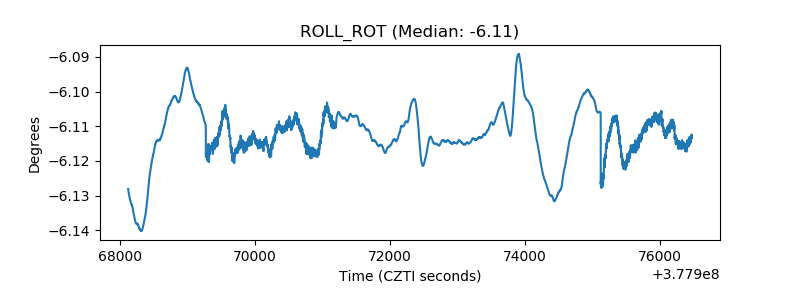 |
| _Roll_DEC |  |
| _Roll_RA | 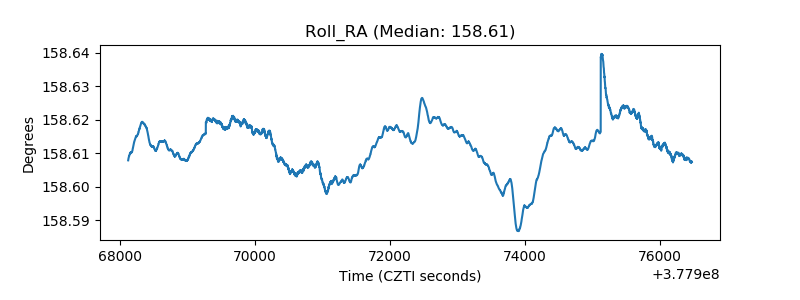 |
| Veto Counter | 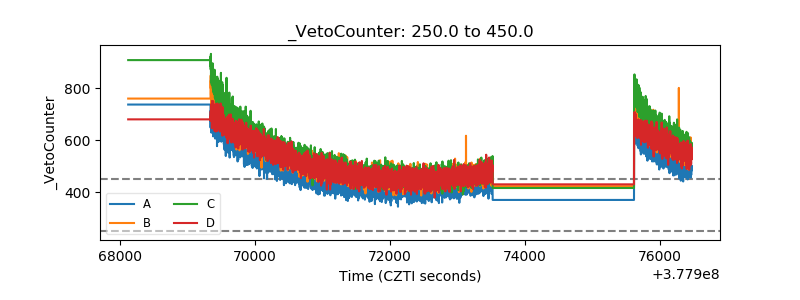 |