| Param | Original file | Final file |
|---|---|---|
| Filename | modeM0/AS1A11_086T01_9000004816_33728cztM0_level2.evt | modeM0/AS1A11_086T01_9000004816_33728cztM0_level2_quad_clean.evt |
| Size (bytes) | 435,038,400 | 93,916,800 |
| Size | 414.9 MB | 89.6 MB |
| Events in quadrant A | 2,496,354 | 627,782 |
| Events in quadrant B | 3,172,972 | 631,656 |
| Events in quadrant C | 3,041,837 | 641,994 |
| Events in quadrant D | 4,129,217 | 596,721 |
| Mode SS | |||
|---|---|---|---|
| Quadrant | BADHDUFLAG | Total packets | Discarded packets |
| A | 0 | 102 | 0 |
| B | 0 | 102 | 0 |
| C | 0 | 102 | 0 |
| D | 0 | 102 | 0 |
| Mode M9 | |||
|---|---|---|---|
| Quadrant | BADHDUFLAG | Total packets | Discarded packets |
| A | 0 | 27 | 0 |
| B | 0 | 27 | 0 |
| C | 0 | 27 | 0 |
| D | 0 | 28 | 0 |
| Mode M0 | |||
|---|---|---|---|
| Quadrant | BADHDUFLAG | Total packets | Discarded packets |
| A | 0 | 10413 | 3 |
| B | 0 | 12678 | 2 |
| C | 0 | 12150 | 2 |
| D | 0 | 15662 | 2 |
| Quadrant | Total seconds | Saturated seconds | Saturation percentage |
|---|---|---|---|
| A | 4930 | 4 | 0.081136% |
| B | 4930 | 115 | 2.332657% |
| C | 4930 | 88 | 1.784990% |
| D | 4930 | 174 | 3.529412% |
Noise dominated data is calculated using 1-second bins in cleaned event files. If a bin has >2000 counts, and if more than 50% of those come from <1% of pixels, then it is considered to be noise-dominated and hence unusable.
| Quadrant | # 1 sec bins | Bins with >0 counts | Bins with >2000 counts | High rate bins dominated by noise | Noise dominated (total time) | Noise dominated (detector-on time) | Marked lightcurve |
|---|---|---|---|---|---|---|---|
| A | 7053 | 4931 | 0 | 0 | 0.00% | 0.00% | 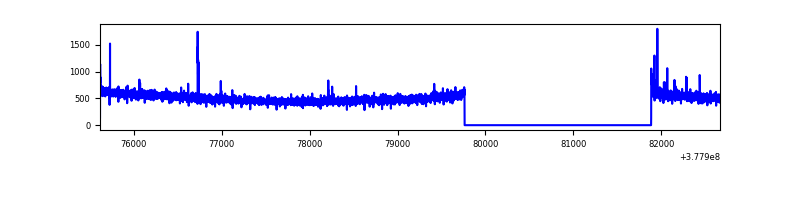 |
| B | 7053 | 4931 | 90 | 90 | 1.28% | 1.83% | 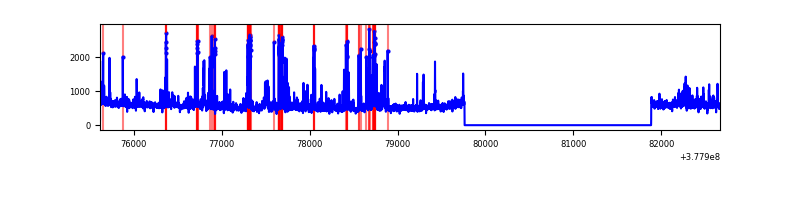 |
| C | 7053 | 4931 | 60 | 60 | 0.85% | 1.22% | 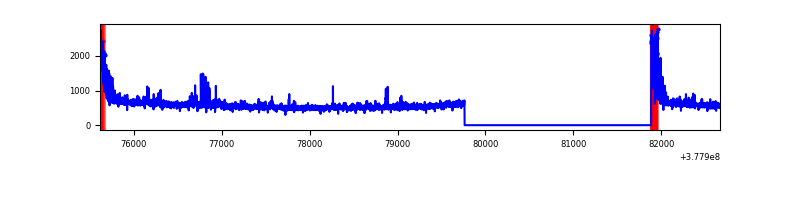 |
| D | 7053 | 4931 | 169 | 169 | 2.40% | 3.43% | 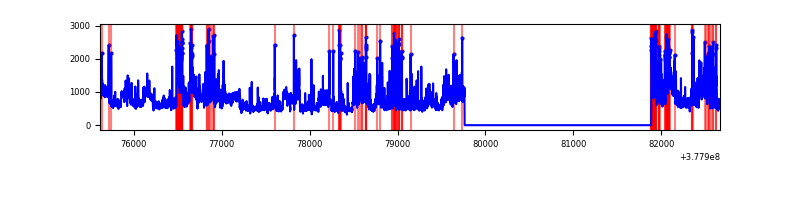 |
Top three noisy pixels from each quadrant. If the there are fewer than three noisy pixels in the level2.evt file, extra rows are filled as -1
| Pixel properties | Quadrant properties | ||||||
|---|---|---|---|---|---|---|---|
| Quadrant | DetID | PixID | Counts | Sigma | Mean | Median | Sigma |
| A | 15 | 169 | 18140 | 138.7 | 635 | 625 | 126.3 |
| A | 14 | 4 | 14883 | 112.91 | 635 | 625 | 126.3 |
| A | 10 | 83 | 9194 | 67.86 | 635 | 625 | 126.3 |
| B | 5 | 172 | 443252 | 3737.84 | 635 | 621 | 118.4 |
| B | 0 | 245 | 84028 | 704.34 | 635 | 621 | 118.4 |
| B | 0 | 219 | 41047 | 341.38 | 635 | 621 | 118.4 |
| C | 0 | 10 | 264644 | 1848.74 | 630 | 640 | 142.8 |
| C | 15 | 214 | 216966 | 1514.86 | 630 | 640 | 142.8 |
| C | 9 | 54 | 51400 | 355.46 | 630 | 640 | 142.8 |
| D | 8 | 195 | 758053 | 4600.13 | 614 | 604 | 164.7 |
| D | 2 | 250 | 304953 | 1848.37 | 614 | 604 | 164.7 |
| D | 13 | 249 | 217988 | 1320.21 | 614 | 604 | 164.7 |
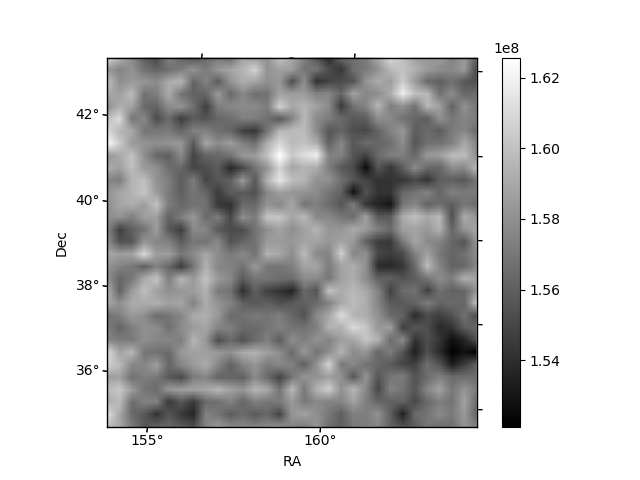
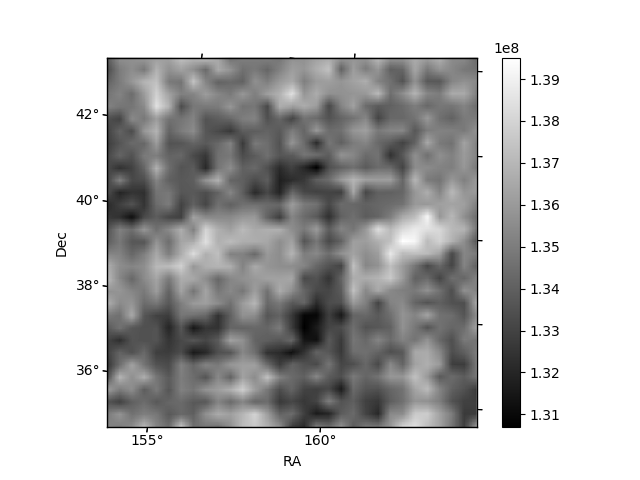
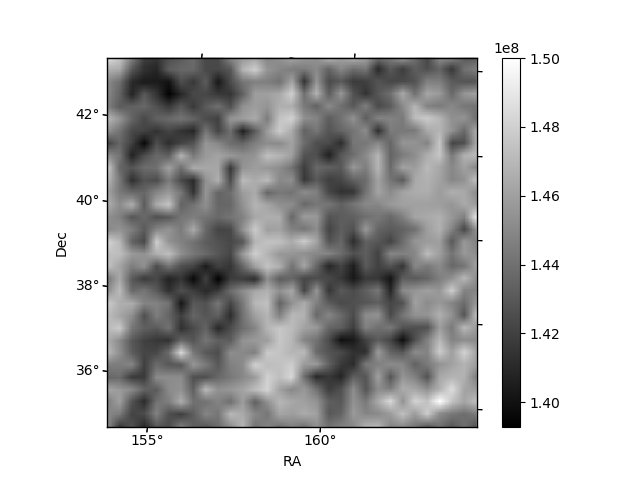
Histogram calculated using DETX and DETY for each event in the final _common_clean file
| Quadrant A | 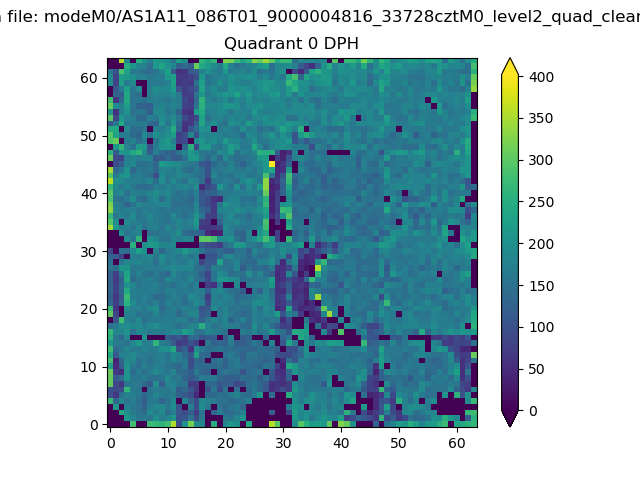 |
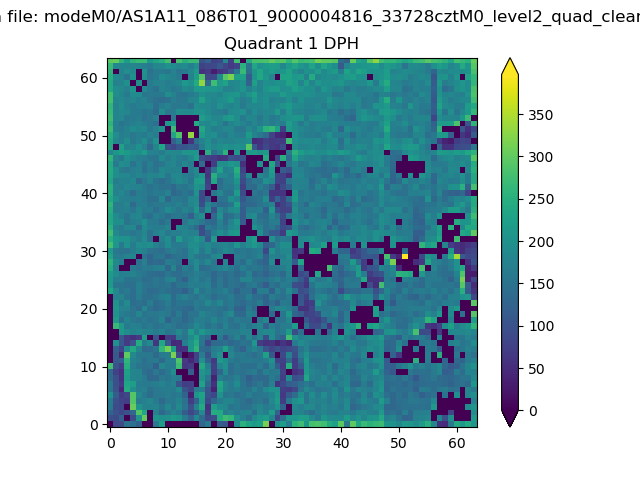 |
Quadrant B |
|---|---|---|---|
| Quadrant D | 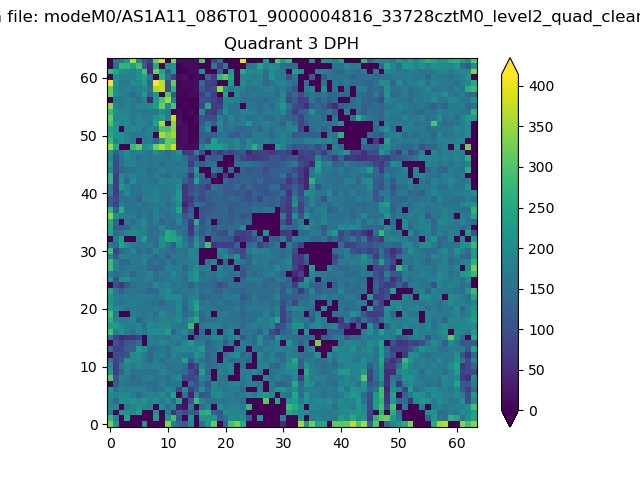 |
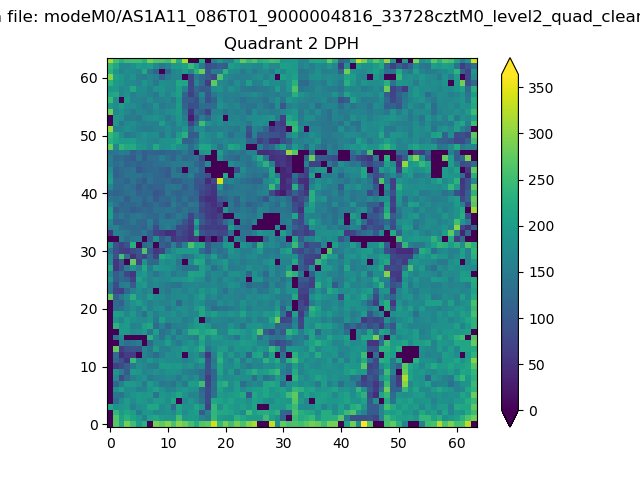 |
Quadrant C |
| Plot type | Count rate plots | Images |
|---|---|---|
| Comparison with Poisson distribution Blue bars denote a histogram of data divided into 1 sec bins. Red curve is a Poisson curve with rate = median count rate of data. |
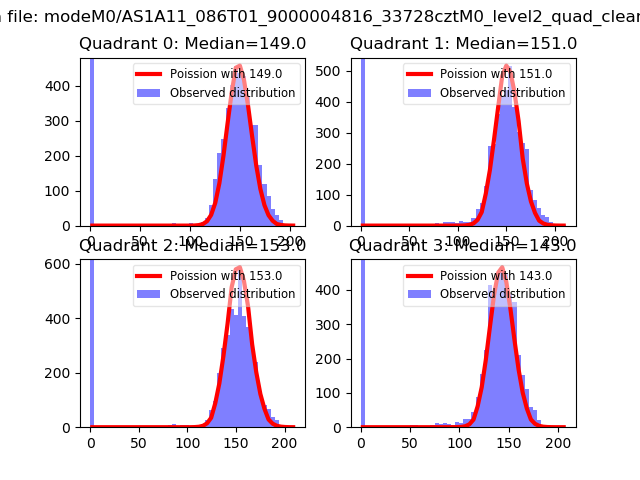 |
 |
| Quadrant-wise count rates Data is divided into 100 sec bins |
 |
|
| Module-wise count rates for Quadrant A Data is divided into 100 sec bins |
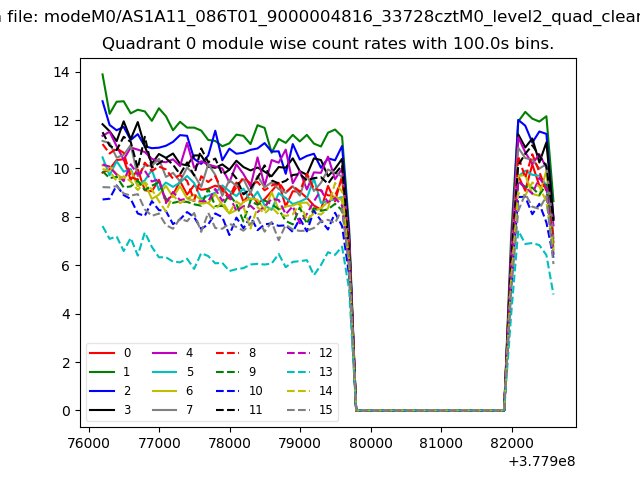 |
 |
| Module-wise count rates for Quadrant B Data is divided into 100 sec bins |
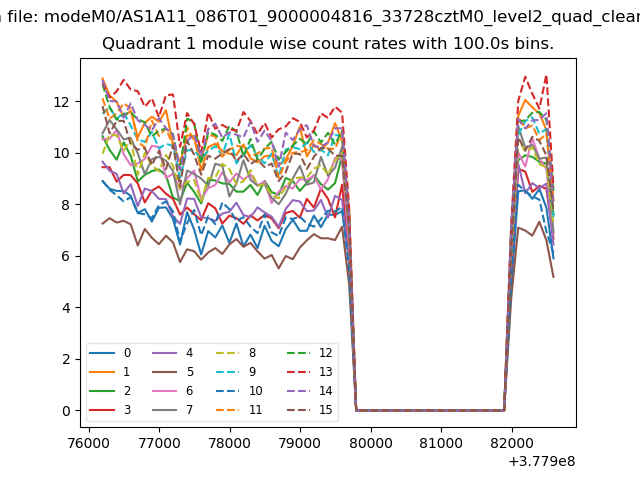 |
 |
| Module-wise count rates for Quadrant C Data is divided into 100 sec bins |
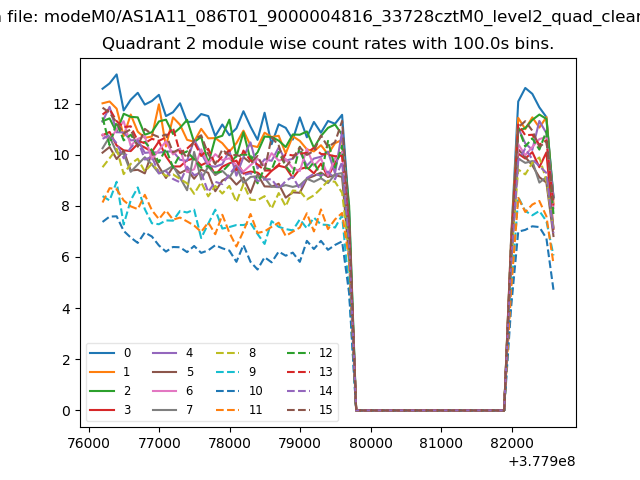 |
 |
| Module-wise count rates for Quadrant D Data is divided into 100 sec bins |
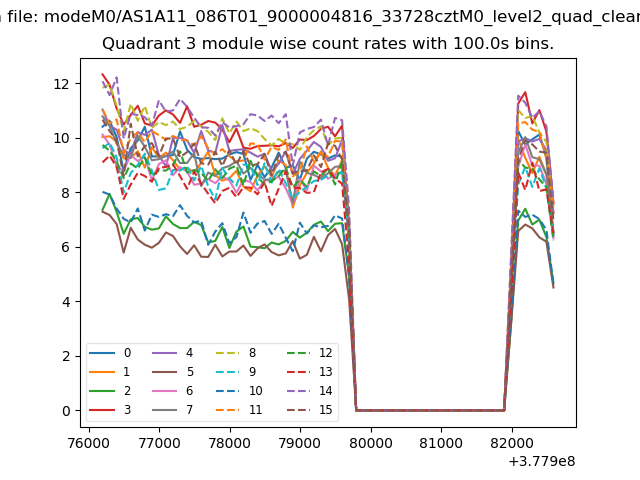 |
 |
| Parameter | Plot |
|---|---|
| CZT HV Monitor | 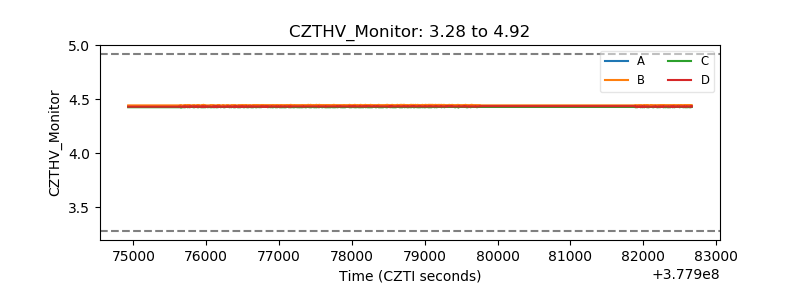 |
| D_VDD | 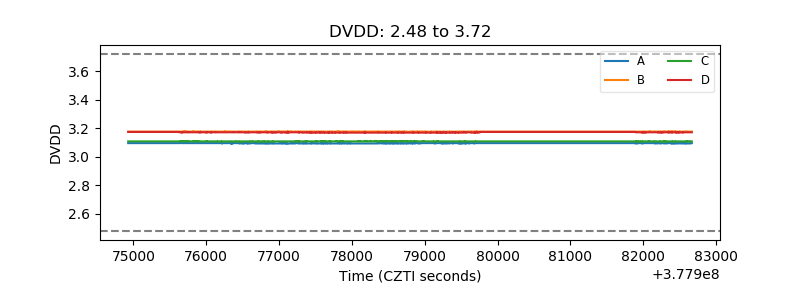 |
| Temperature 1 | 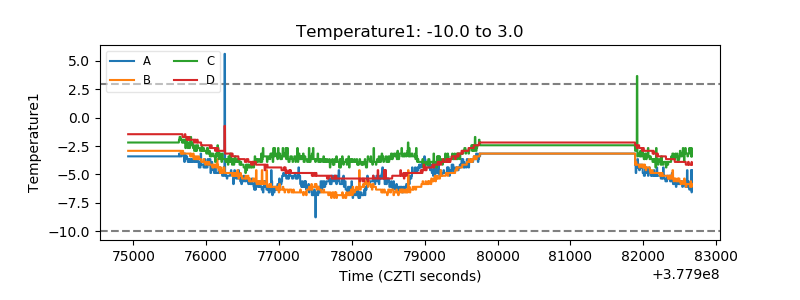 |
| Veto HV Monitor |  |
| Veto LLD | 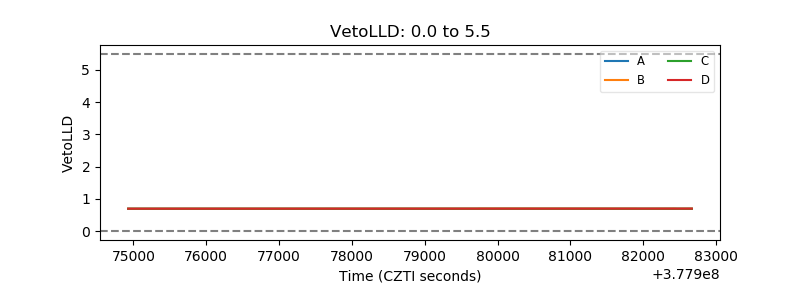 |
| Alpha Counter | 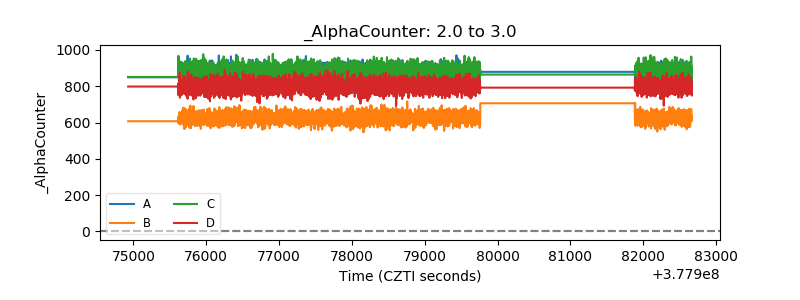 |
| _CPM_Rate |  |
| CZT Counter | 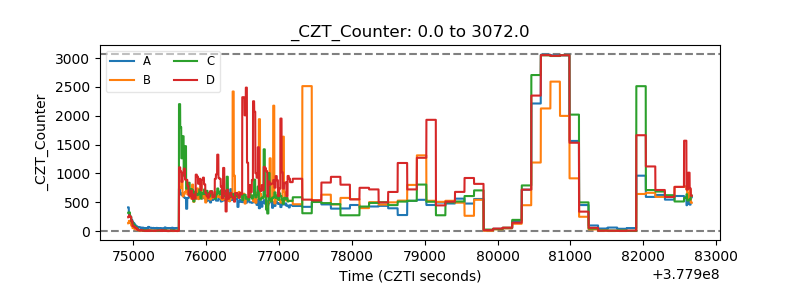 |
| +2.5 Volts monitor | 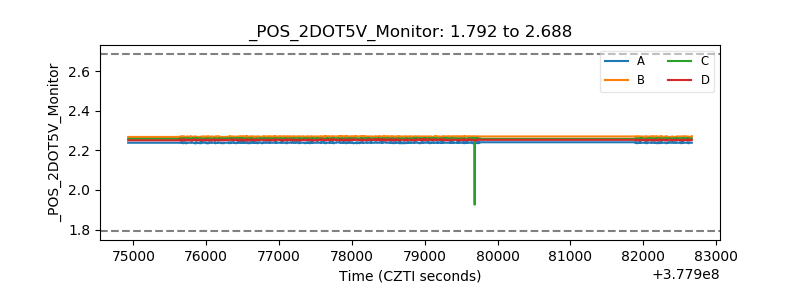 |
| +5 Volts monitor |  |
| _ROLL_ROT | 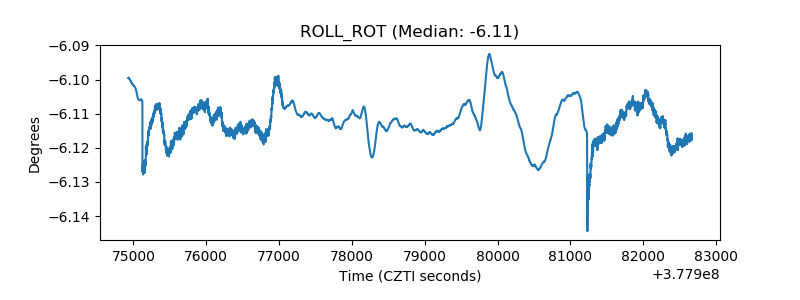 |
| _Roll_DEC | 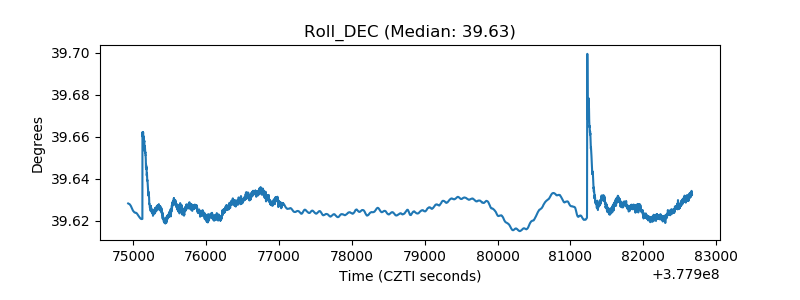 |
| _Roll_RA | 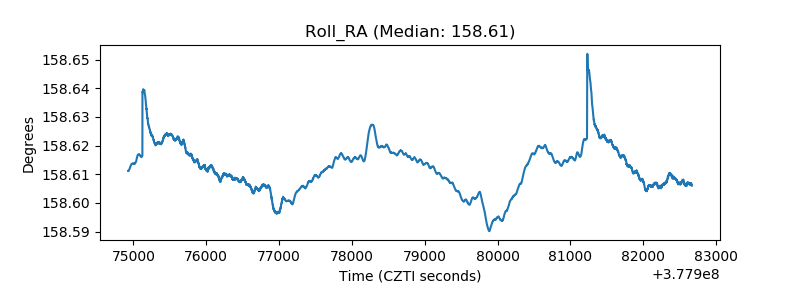 |
| Veto Counter | 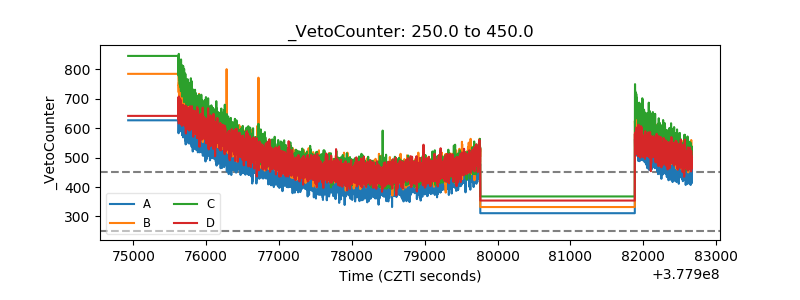 |