| Param | Original file | Final file |
|---|---|---|
| Filename | modeM0/AS1A11_086T01_9000004816_33729cztM0_level2.evt | modeM0/AS1A11_086T01_9000004816_33729cztM0_level2_quad_clean.evt |
| Size (bytes) | 449,239,680 | 96,503,040 |
| Size | 428.4 MB | 92.0 MB |
| Events in quadrant A | 2,479,535 | 651,011 |
| Events in quadrant B | 3,623,589 | 646,364 |
| Events in quadrant C | 2,892,531 | 662,361 |
| Events in quadrant D | 4,268,128 | 609,936 |
| Mode SS | |||
|---|---|---|---|
| Quadrant | BADHDUFLAG | Total packets | Discarded packets |
| A | 0 | 104 | 0 |
| B | 0 | 104 | 0 |
| C | 0 | 104 | 0 |
| D | 0 | 104 | 0 |
| Mode M9 | |||
|---|---|---|---|
| Quadrant | BADHDUFLAG | Total packets | Discarded packets |
| A | 0 | 42 | 0 |
| B | 0 | 42 | 0 |
| C | 0 | 42 | 0 |
| D | 0 | 42 | 0 |
| Mode M0 | |||
|---|---|---|---|
| Quadrant | BADHDUFLAG | Total packets | Discarded packets |
| A | 0 | 10520 | 3 |
| B | 0 | 14150 | 2 |
| C | 0 | 11529 | 2 |
| D | 0 | 16112 | 2 |
| Quadrant | Total seconds | Saturated seconds | Saturation percentage |
|---|---|---|---|
| A | 5035 | 7 | 0.139027% |
| B | 5035 | 279 | 5.541212% |
| C | 5035 | 79 | 1.569017% |
| D | 5035 | 260 | 5.163853% |
Noise dominated data is calculated using 1-second bins in cleaned event files. If a bin has >2000 counts, and if more than 50% of those come from <1% of pixels, then it is considered to be noise-dominated and hence unusable.
| Quadrant | # 1 sec bins | Bins with >0 counts | Bins with >2000 counts | High rate bins dominated by noise | Noise dominated (total time) | Noise dominated (detector-on time) | Marked lightcurve |
|---|---|---|---|---|---|---|---|
| A | 9251 | 5037 | 4 | 4 | 0.04% | 0.08% | 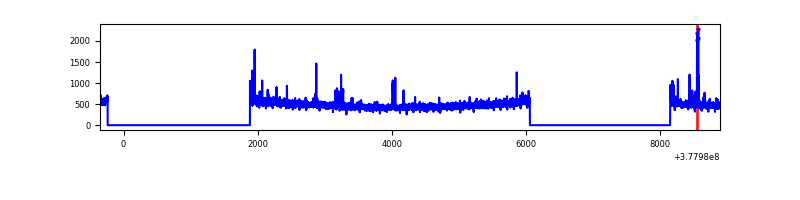 |
| B | 9251 | 5037 | 222 | 222 | 2.40% | 4.41% | 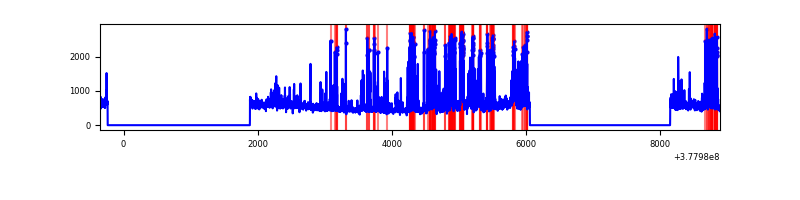 |
| C | 9251 | 5037 | 60 | 60 | 0.65% | 1.19% | 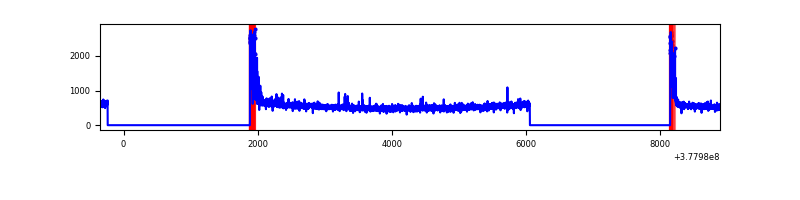 |
| D | 9251 | 5037 | 239 | 239 | 2.58% | 4.74% | 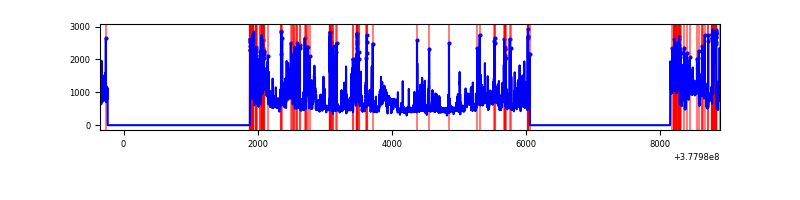 |
Top three noisy pixels from each quadrant. If the there are fewer than three noisy pixels in the level2.evt file, extra rows are filled as -1
| Pixel properties | Quadrant properties | ||||||
|---|---|---|---|---|---|---|---|
| Quadrant | DetID | PixID | Counts | Sigma | Mean | Median | Sigma |
| A | 15 | 169 | 52828 | 427.51 | 616 | 606 | 122.2 |
| A | 14 | 4 | 34335 | 276.12 | 616 | 606 | 122.2 |
| A | 10 | 83 | 9093 | 69.48 | 616 | 606 | 122.2 |
| B | 5 | 172 | 875711 | 7647.02 | 609 | 596 | 114.4 |
| B | 5 | 255 | 82199 | 713.07 | 609 | 596 | 114.4 |
| B | 0 | 245 | 72030 | 624.21 | 609 | 596 | 114.4 |
| C | 0 | 10 | 241558 | 1734.77 | 608 | 615 | 138.9 |
| C | 15 | 214 | 234498 | 1683.93 | 608 | 615 | 138.9 |
| C | 14 | 67 | 19488 | 135.88 | 608 | 615 | 138.9 |
| D | 8 | 195 | 874426 | 5462.99 | 586 | 577 | 160.0 |
| D | 13 | 249 | 209234 | 1304.45 | 586 | 577 | 160.0 |
| D | 2 | 250 | 204018 | 1271.84 | 586 | 577 | 160.0 |
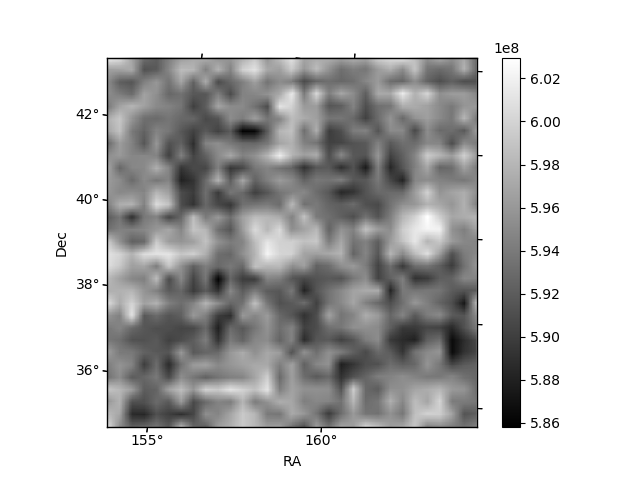
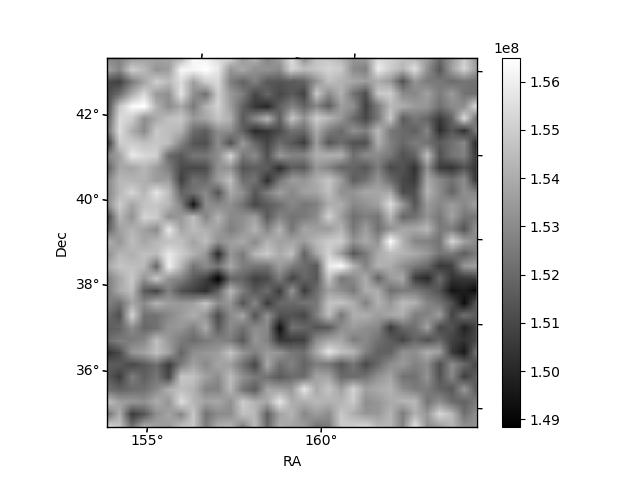
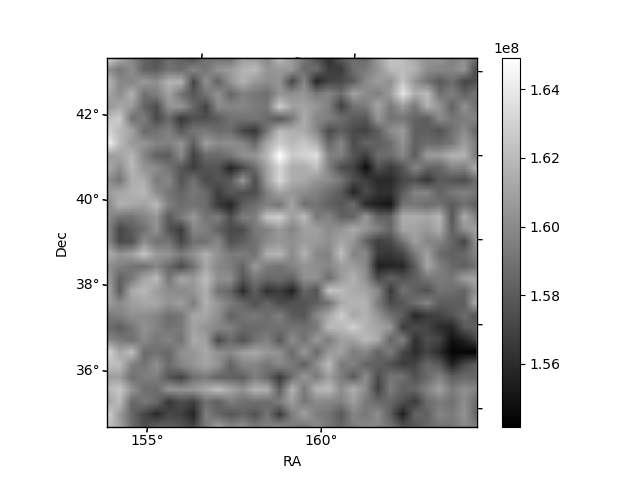
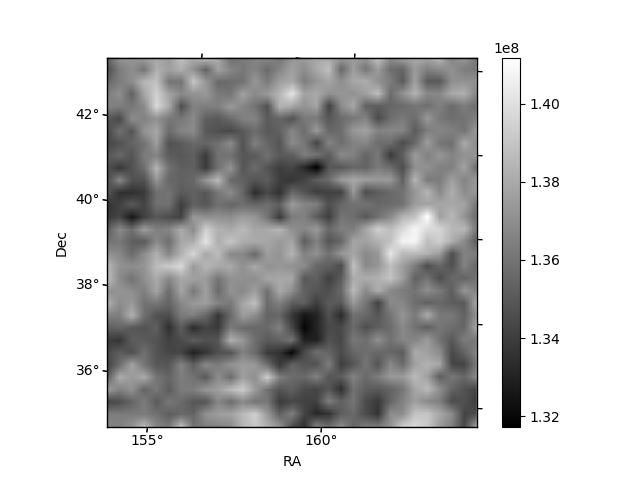
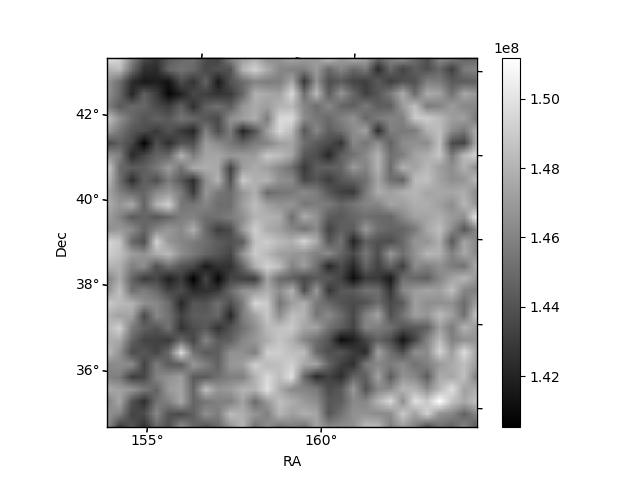
Histogram calculated using DETX and DETY for each event in the final _common_clean file
| Quadrant A | 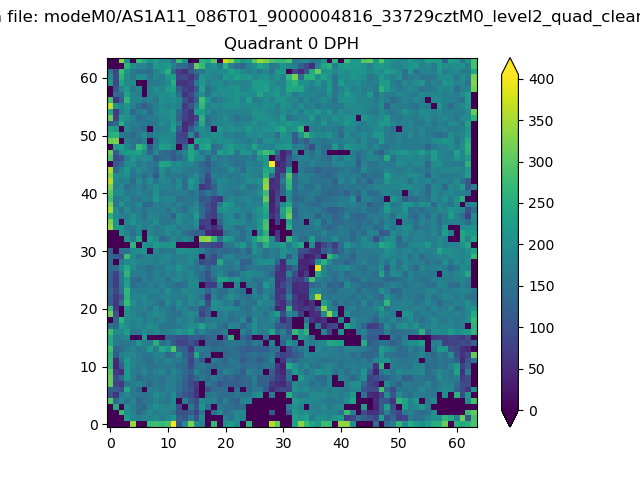 |
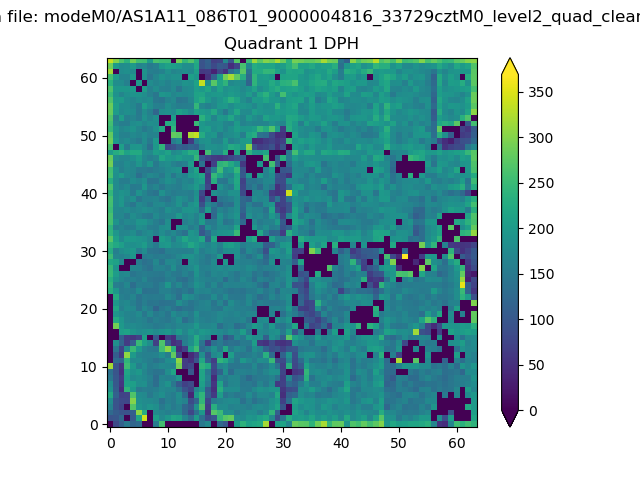 |
Quadrant B |
|---|---|---|---|
| Quadrant D | 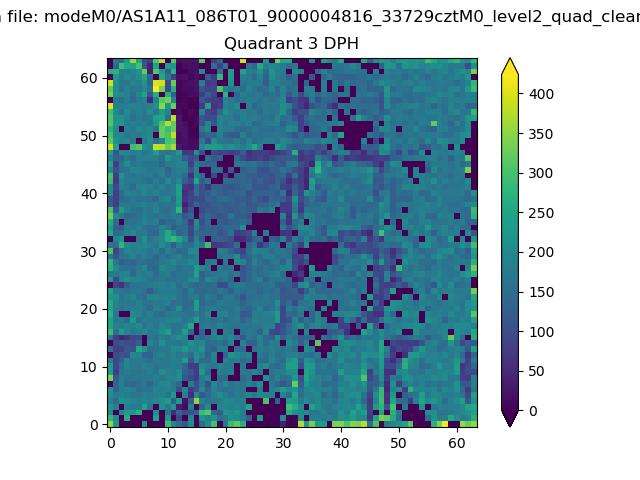 |
 |
Quadrant C |
| Plot type | Count rate plots | Images |
|---|---|---|
| Comparison with Poisson distribution Blue bars denote a histogram of data divided into 1 sec bins. Red curve is a Poisson curve with rate = median count rate of data. |
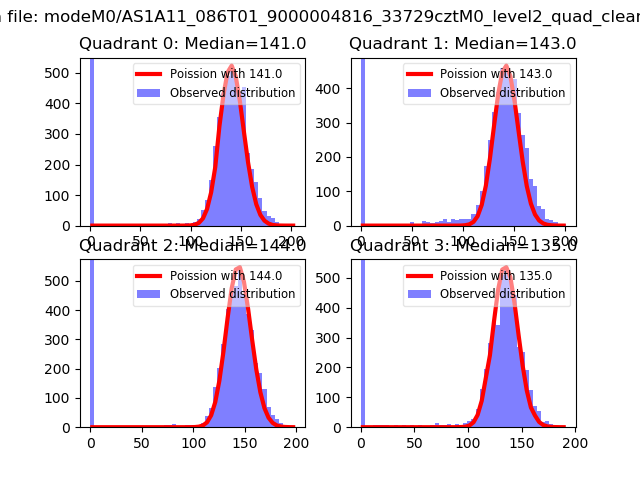 |
 |
| Quadrant-wise count rates Data is divided into 100 sec bins |
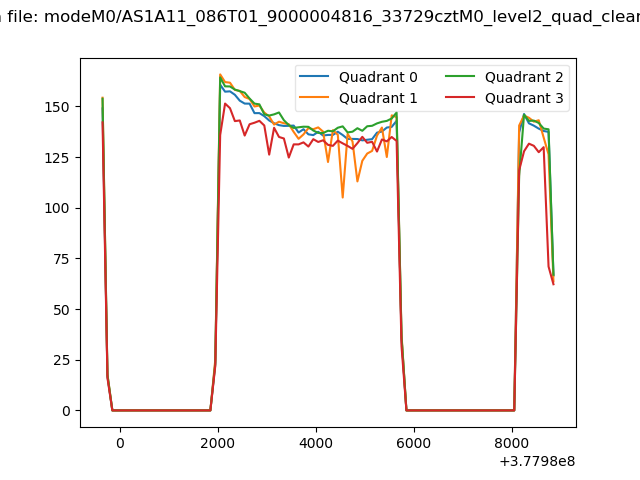 |
|
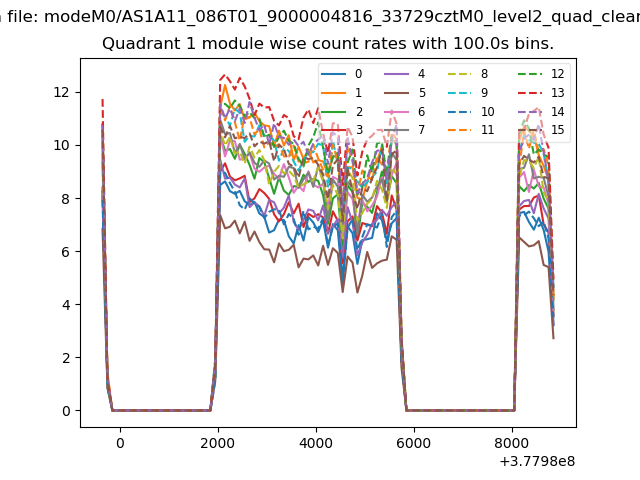
| Module-wise count rates for Quadrant A Data is divided into 100 sec bins |
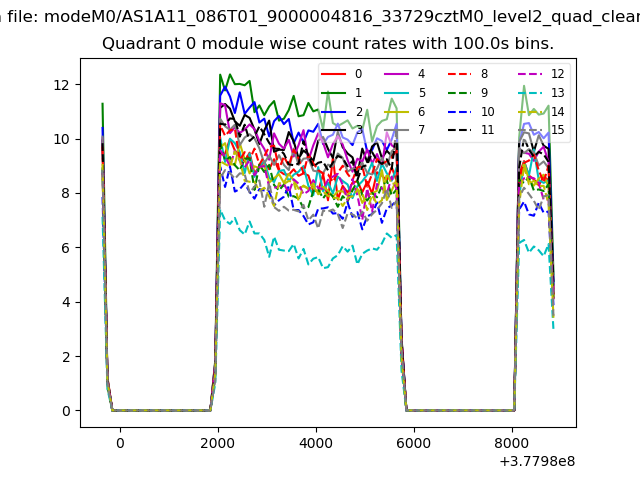 |
 |
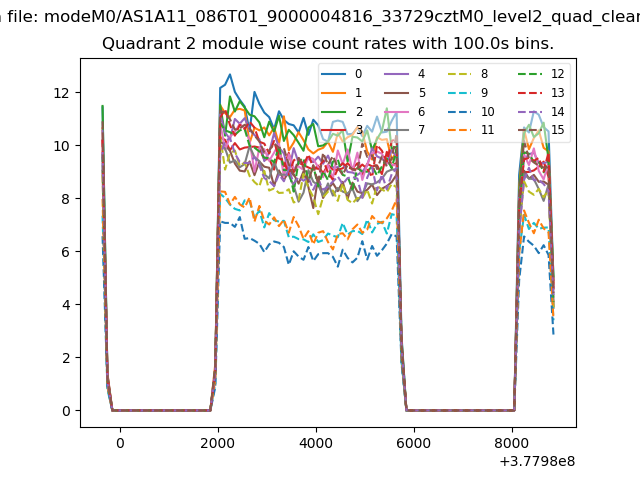
| Module-wise count rates for Quadrant B Data is divided into 100 sec bins |
 |
 |
| Module-wise count rates for Quadrant C Data is divided into 100 sec bins |
 |
 |
| Module-wise count rates for Quadrant D Data is divided into 100 sec bins |
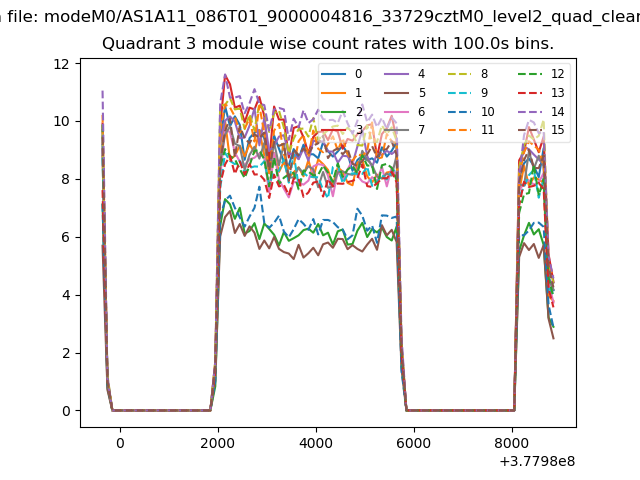 |
 |
| Parameter | Plot |
|---|---|
| CZT HV Monitor | 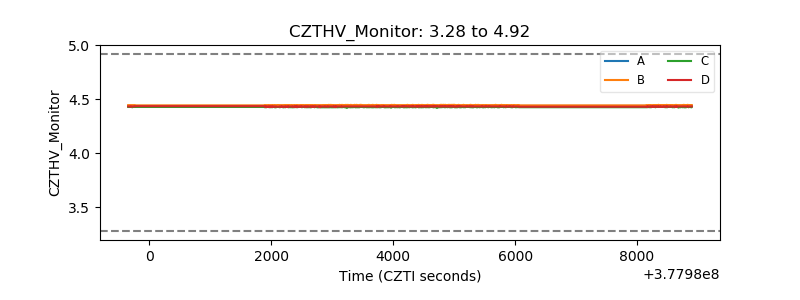 |
| D_VDD | 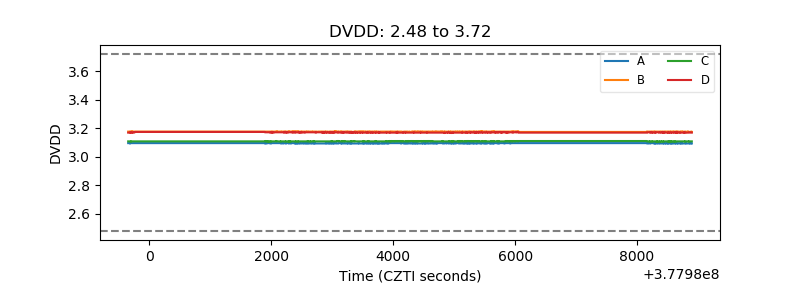 |
| Temperature 1 | 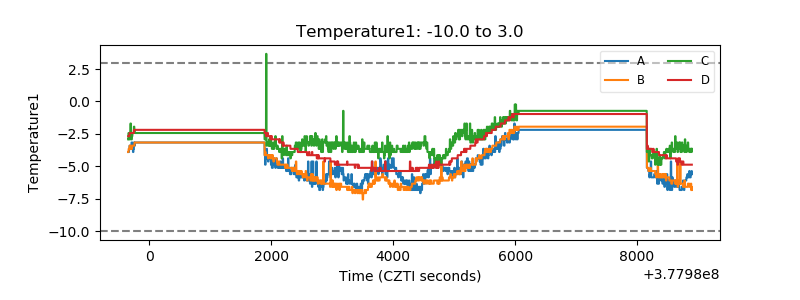 |
| Veto HV Monitor | 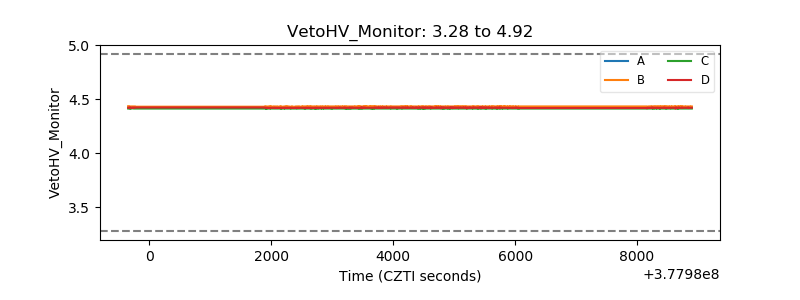 |
| Veto LLD | 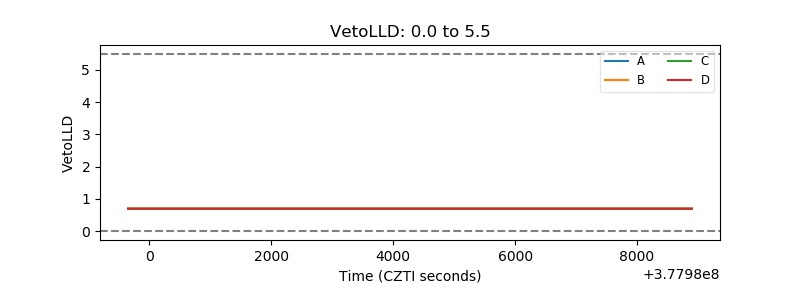 |
| Alpha Counter | 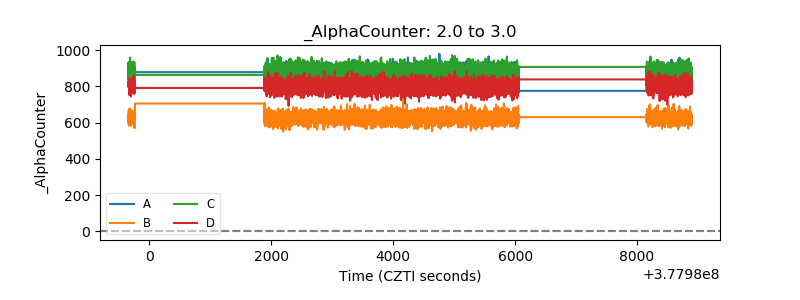 |
| _CPM_Rate | 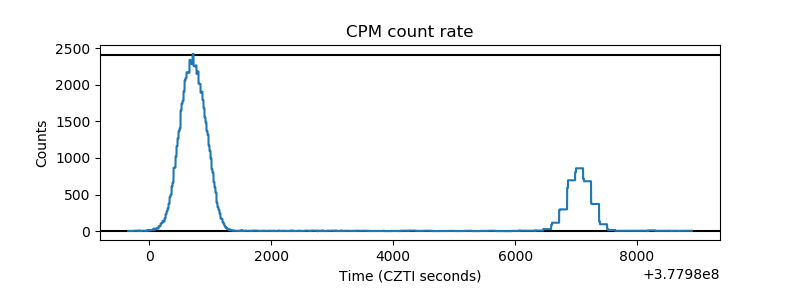 |
| CZT Counter | 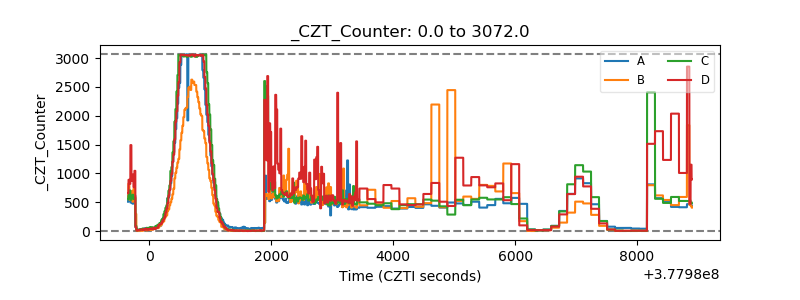 |
| +2.5 Volts monitor |  |
| +5 Volts monitor |  |
| _ROLL_ROT | 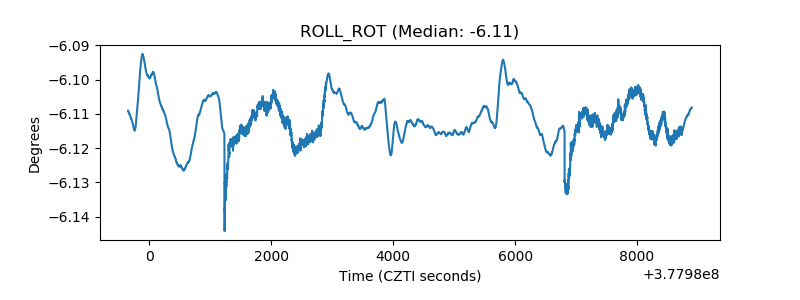 |
| _Roll_DEC | 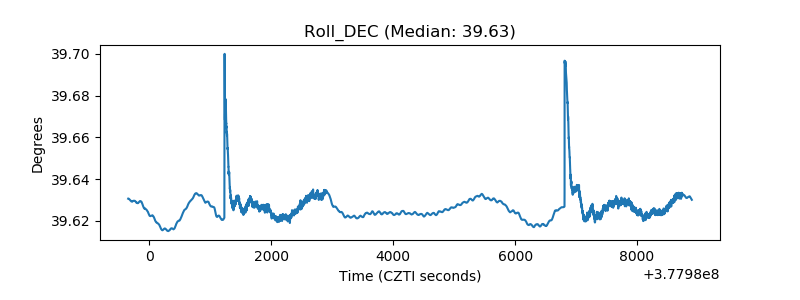 |
| _Roll_RA | 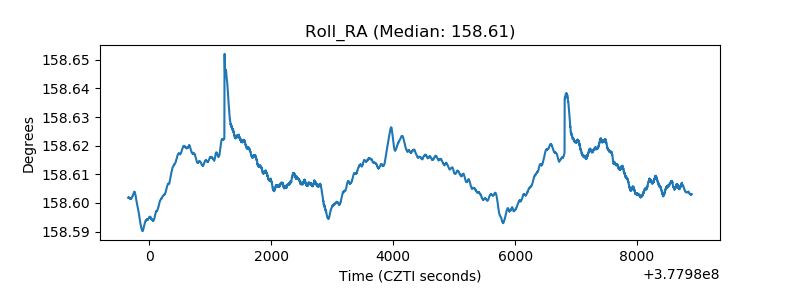 |
| Veto Counter | 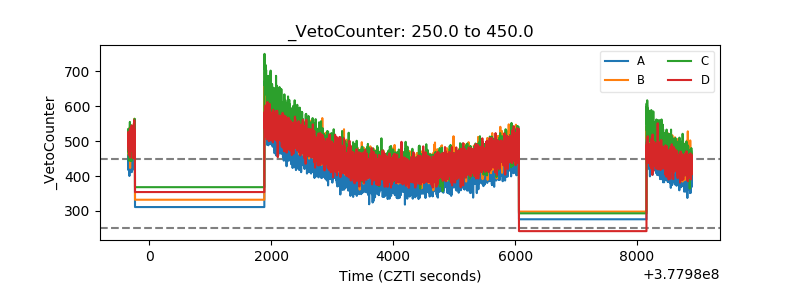 |