| Param | Original file | Final file |
|---|---|---|
| Filename | modeM0/AS1A11_086T01_9000004816_33730cztM0_level2.evt | modeM0/AS1A11_086T01_9000004816_33730cztM0_level2_quad_clean.evt |
| Size (bytes) | 450,483,840 | 83,295,360 |
| Size | 429.6 MB | 79.4 MB |
| Events in quadrant A | 2,434,856 | 553,879 |
| Events in quadrant B | 3,630,094 | 547,324 |
| Events in quadrant C | 2,891,001 | 555,994 |
| Events in quadrant D | 4,341,857 | 508,771 |
| Mode SS | |||
|---|---|---|---|
| Quadrant | BADHDUFLAG | Total packets | Discarded packets |
| A | 0 | 102 | 0 |
| B | 0 | 102 | 0 |
| C | 0 | 102 | 0 |
| D | 0 | 102 | 0 |
| Mode M9 | |||
|---|---|---|---|
| Quadrant | BADHDUFLAG | Total packets | Discarded packets |
| A | 0 | 39 | 0 |
| B | 0 | 39 | 0 |
| C | 0 | 39 | 0 |
| D | 0 | 40 | 0 |
| Mode M0 | |||
|---|---|---|---|
| Quadrant | BADHDUFLAG | Total packets | Discarded packets |
| A | 0 | 10583 | 2 |
| B | 0 | 14058 | 1 |
| C | 0 | 11677 | 1 |
| D | 0 | 16483 | 1 |
| Quadrant | Total seconds | Saturated seconds | Saturation percentage |
|---|---|---|---|
| A | 5090 | 17 | 0.333988% |
| B | 5090 | 331 | 6.502947% |
| C | 5090 | 103 | 2.023576% |
| D | 5090 | 290 | 5.697446% |
Noise dominated data is calculated using 1-second bins in cleaned event files. If a bin has >2000 counts, and if more than 50% of those come from <1% of pixels, then it is considered to be noise-dominated and hence unusable.
| Quadrant | # 1 sec bins | Bins with >0 counts | Bins with >2000 counts | High rate bins dominated by noise | Noise dominated (total time) | Noise dominated (detector-on time) | Marked lightcurve |
|---|---|---|---|---|---|---|---|
| A | 7003 | 5091 | 13 | 13 | 0.19% | 0.26% | 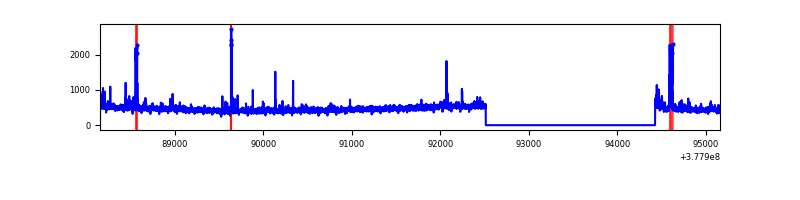 |
| B | 7003 | 5091 | 279 | 279 | 3.98% | 5.48% | 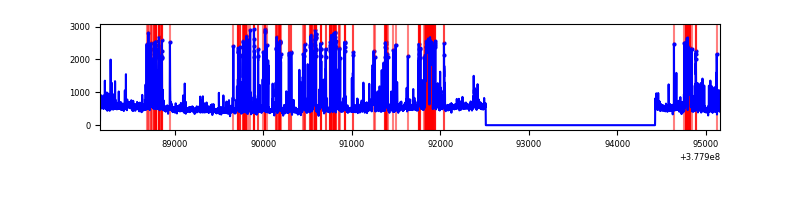 |
| C | 7003 | 5091 | 89 | 89 | 1.27% | 1.75% | 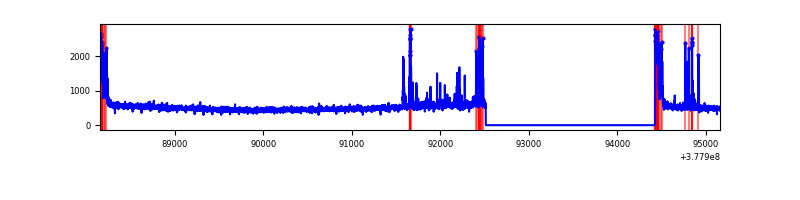 |
| D | 7003 | 5090 | 280 | 280 | 4.00% | 5.50% | 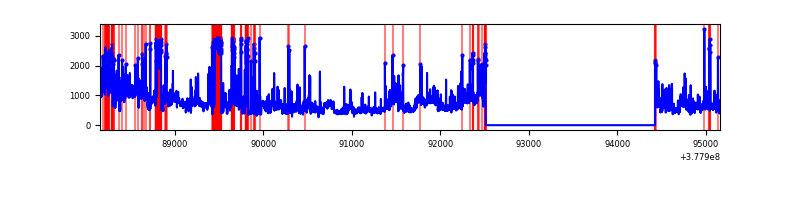 |
Top three noisy pixels from each quadrant. If the there are fewer than three noisy pixels in the level2.evt file, extra rows are filled as -1
| Pixel properties | Quadrant properties | ||||||
|---|---|---|---|---|---|---|---|
| Quadrant | DetID | PixID | Counts | Sigma | Mean | Median | Sigma |
| A | 14 | 4 | 77925 | 651.22 | 594 | 582 | 118.8 |
| A | 15 | 169 | 53214 | 443.15 | 594 | 582 | 118.8 |
| A | 13 | 254 | 8860 | 69.7 | 594 | 582 | 118.8 |
| B | 5 | 172 | 1080191 | 9654.69 | 582 | 568 | 111.8 |
| B | 0 | 245 | 82500 | 732.69 | 582 | 568 | 111.8 |
| B | 4 | 251 | 52803 | 467.12 | 582 | 568 | 111.8 |
| C | 15 | 214 | 237410 | 1773.34 | 579 | 586 | 133.5 |
| C | 0 | 10 | 192940 | 1440.35 | 579 | 586 | 133.5 |
| C | 0 | 239 | 177453 | 1324.38 | 579 | 586 | 133.5 |
| D | 8 | 195 | 978193 | 7053.97 | 563 | 547 | 138.6 |
| D | 12 | 16 | 415397 | 2993.25 | 563 | 547 | 138.6 |
| D | 2 | 250 | 203312 | 1463.0 | 563 | 547 | 138.6 |
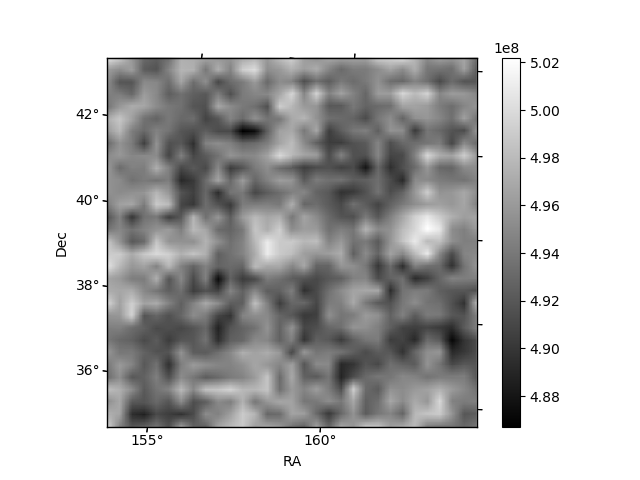
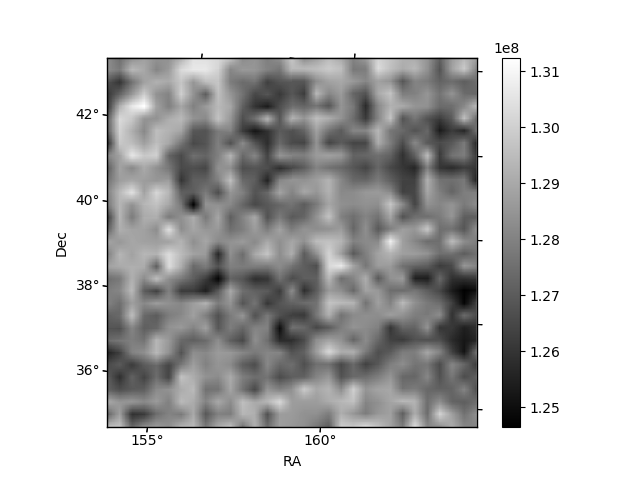
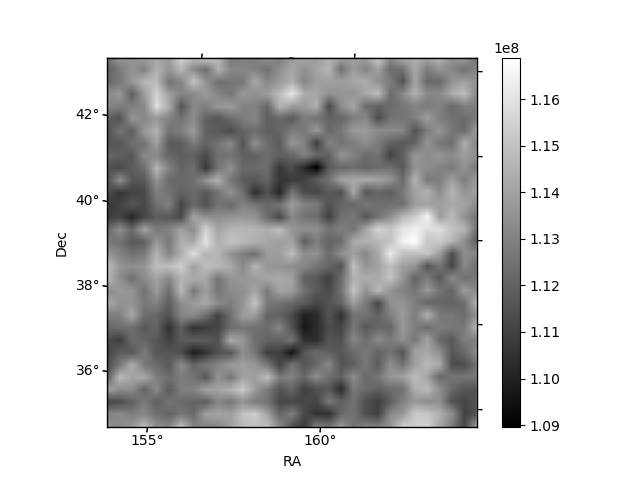
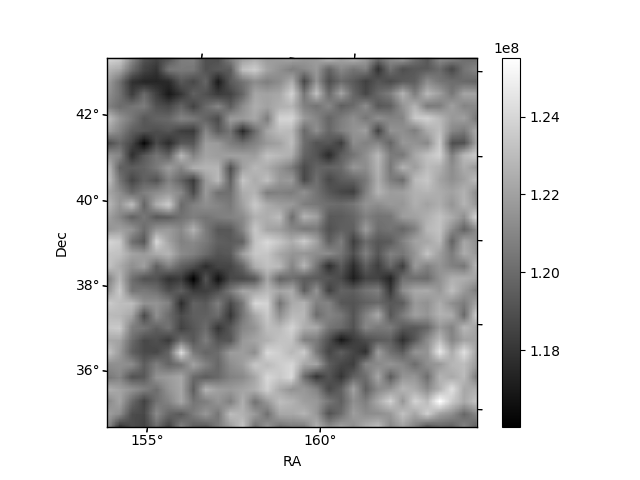
Histogram calculated using DETX and DETY for each event in the final _common_clean file
| Quadrant A | 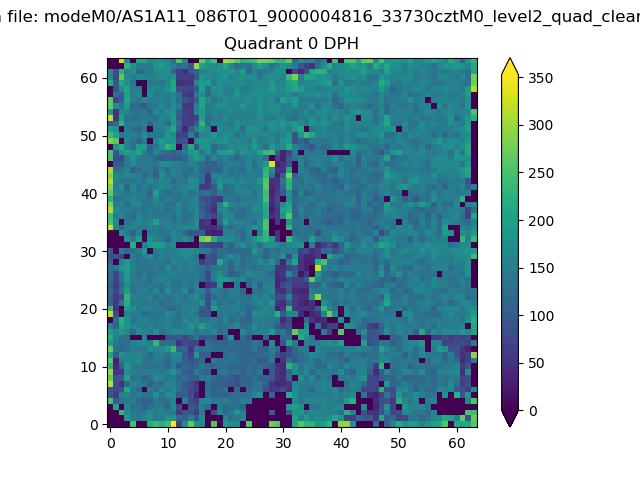 |
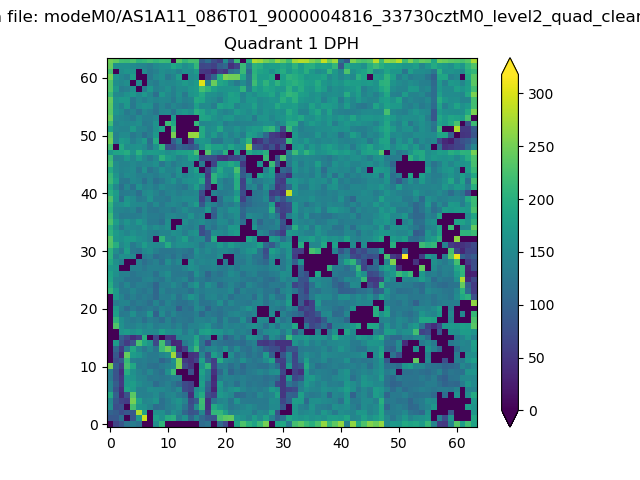 |
Quadrant B |
|---|---|---|---|
| Quadrant D | 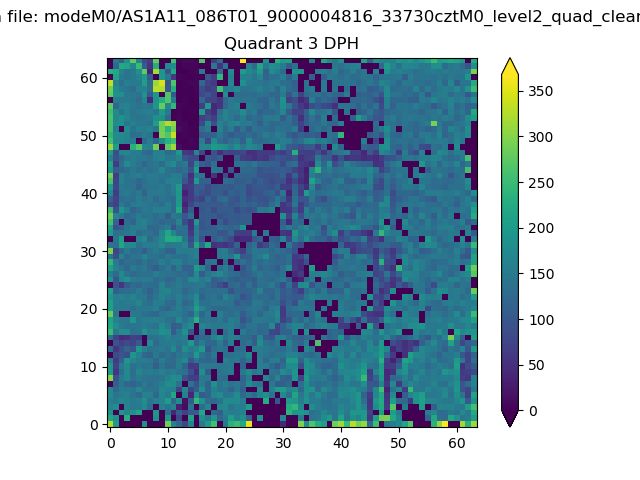 |
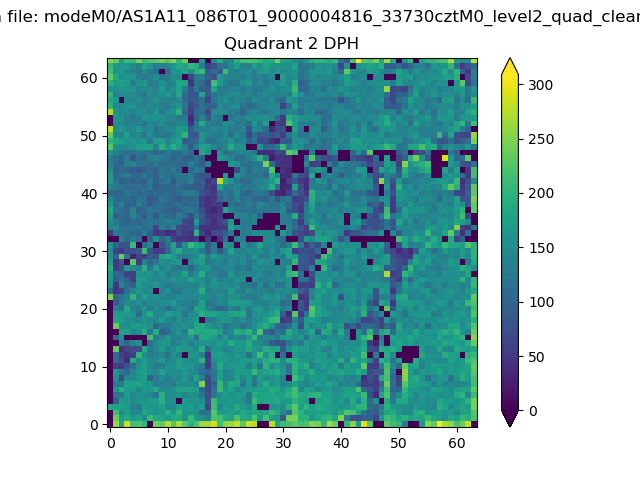 |
Quadrant C |
| Plot type | Count rate plots | Images |
|---|---|---|
| Comparison with Poisson distribution Blue bars denote a histogram of data divided into 1 sec bins. Red curve is a Poisson curve with rate = median count rate of data. |
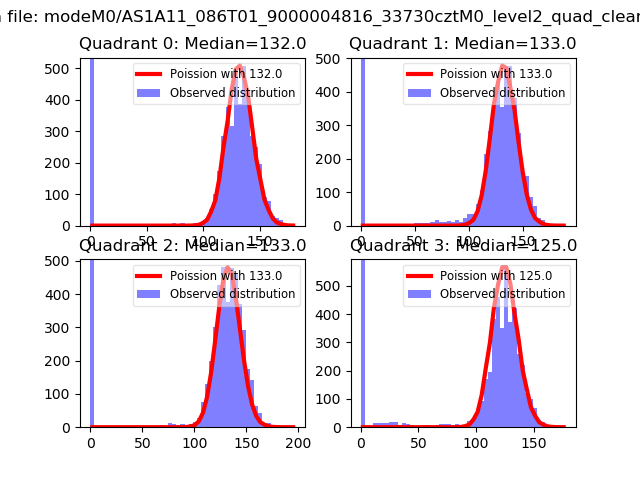 |
 |
| Quadrant-wise count rates Data is divided into 100 sec bins |
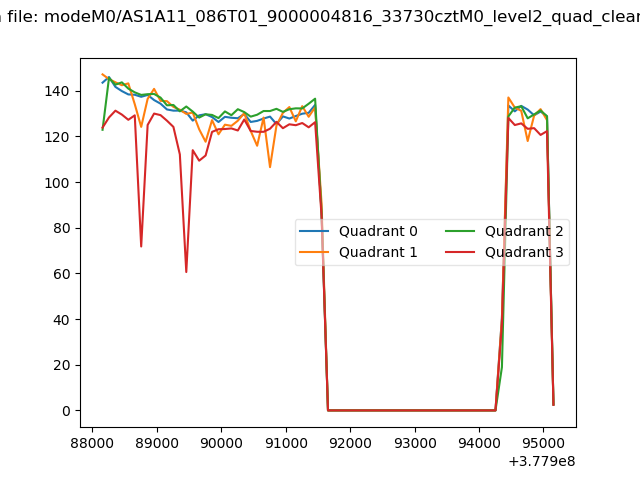 |
|
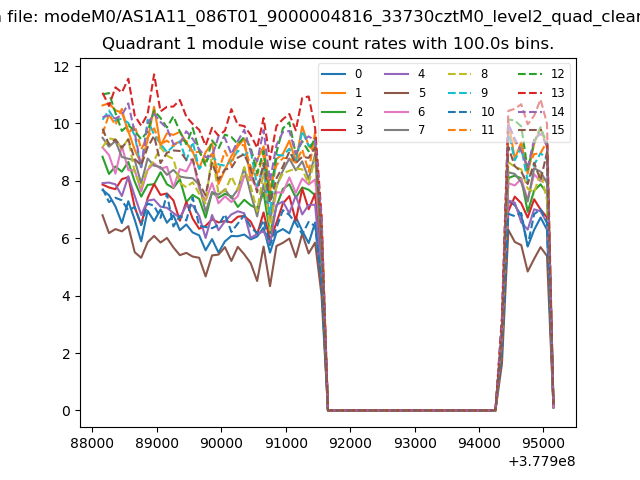
| Module-wise count rates for Quadrant A Data is divided into 100 sec bins |
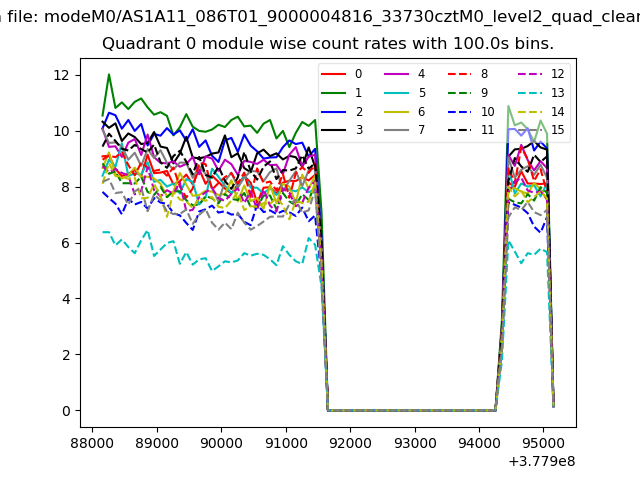 |
 |
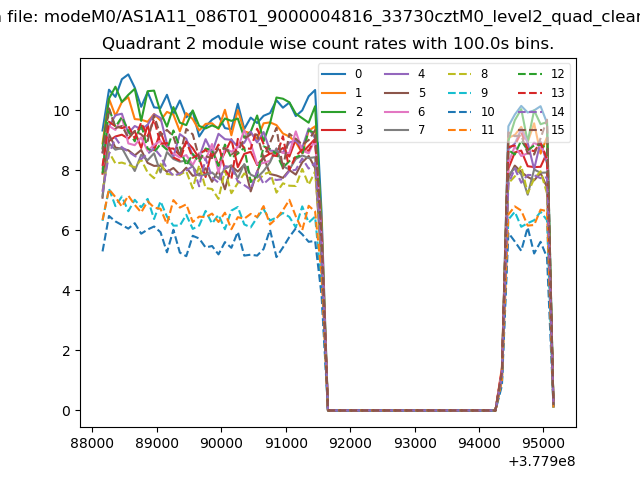
| Module-wise count rates for Quadrant B Data is divided into 100 sec bins |
 |
 |
| Module-wise count rates for Quadrant C Data is divided into 100 sec bins |
 |
 |
| Module-wise count rates for Quadrant D Data is divided into 100 sec bins |
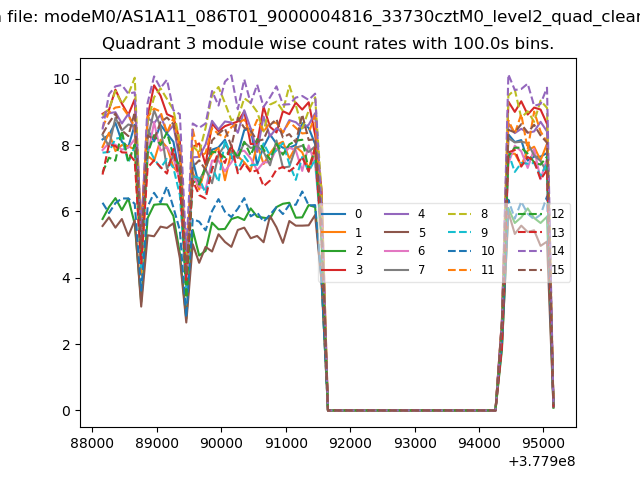 |
 |
| Parameter | Plot |
|---|---|
| CZT HV Monitor | 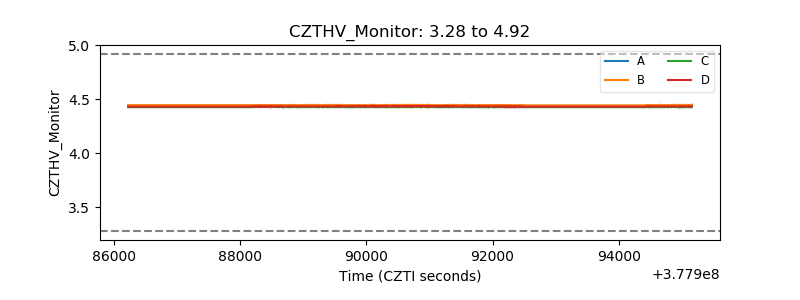 |
| D_VDD | 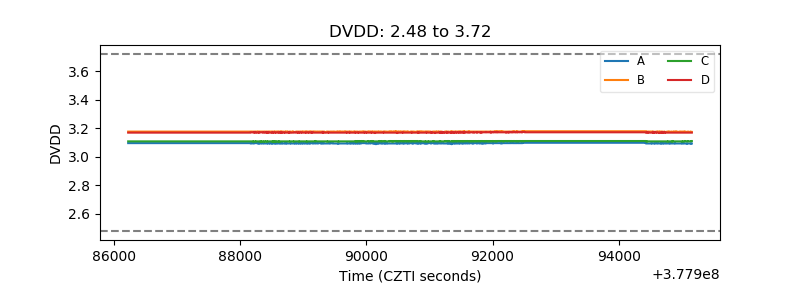 |
| Temperature 1 | 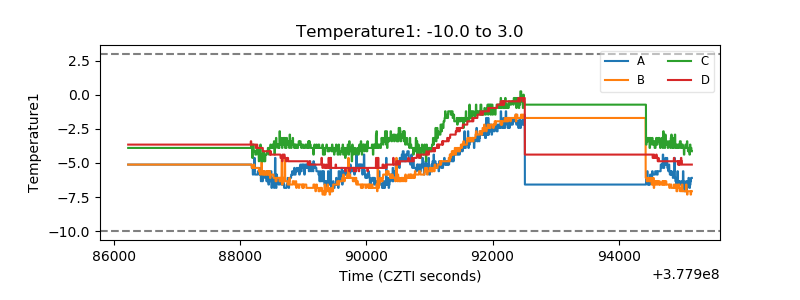 |
| Veto HV Monitor | 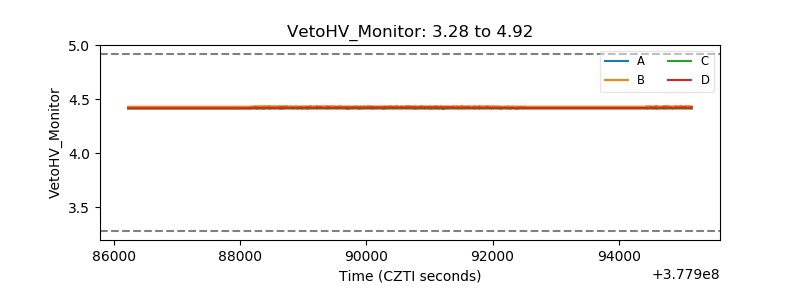 |
| Veto LLD | 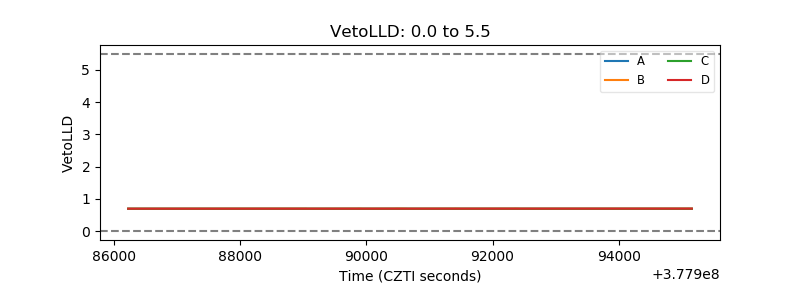 |
| Alpha Counter | 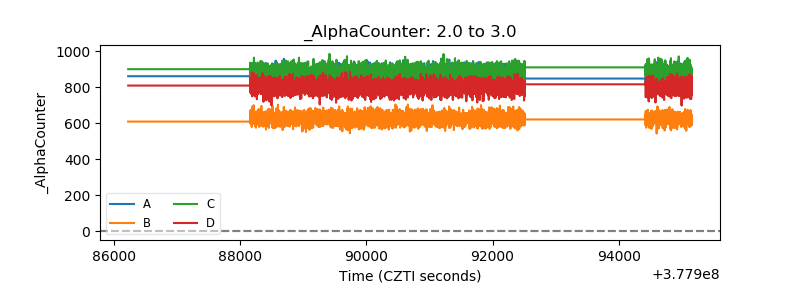 |
| _CPM_Rate | 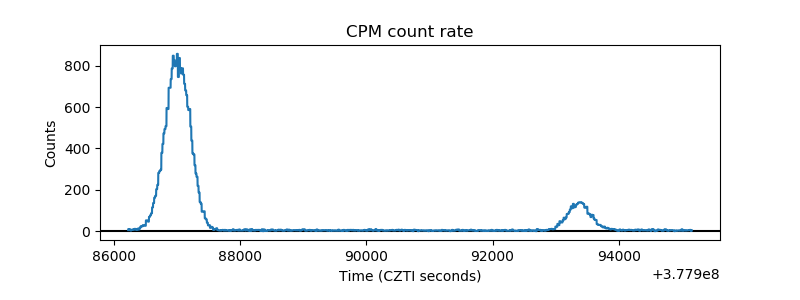 |
| CZT Counter | 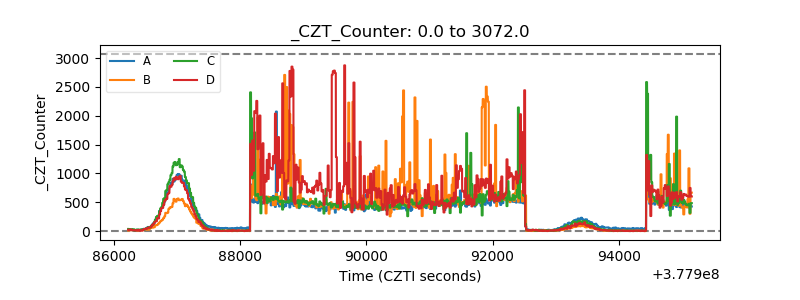 |
| +2.5 Volts monitor |  |
| +5 Volts monitor |  |
| _ROLL_ROT | 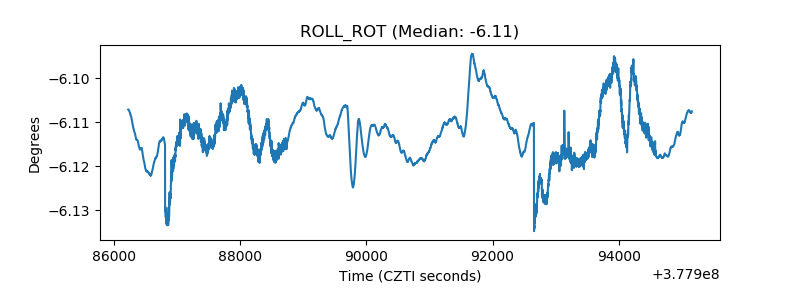 |
| _Roll_DEC | 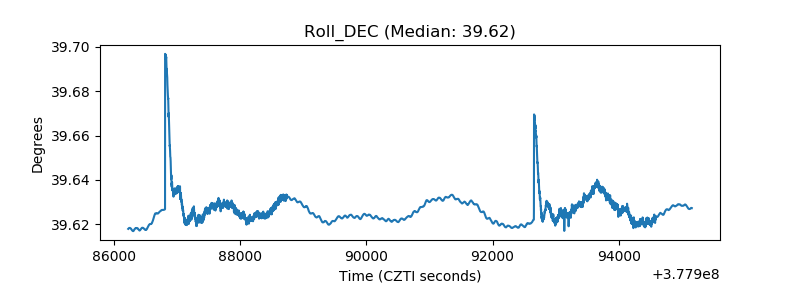 |
| _Roll_RA | 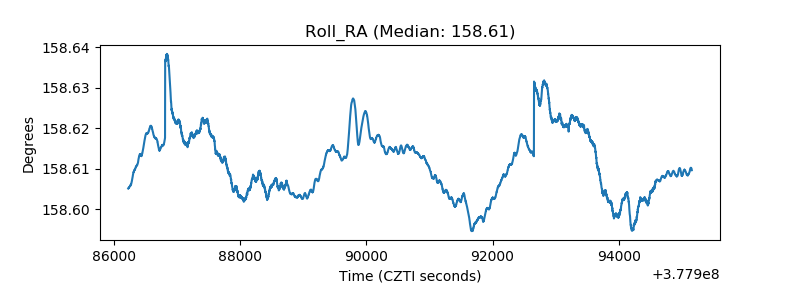 |
| Veto Counter | 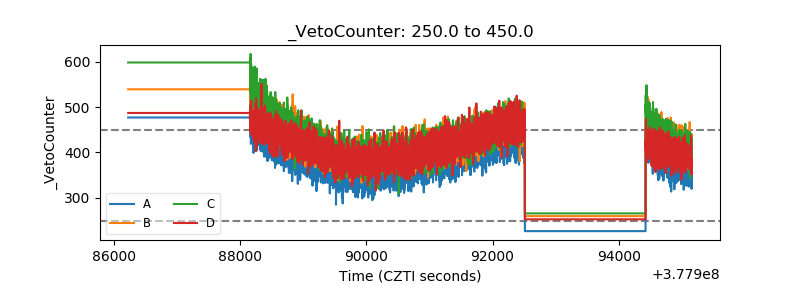 |