| Param | Original file | Final file |
|---|---|---|
| Filename | modeM0/AS1A11_086T01_9000004816_33731cztM0_level2.evt | modeM0/AS1A11_086T01_9000004816_33731cztM0_level2_quad_clean.evt |
| Size (bytes) | 477,434,880 | 75,922,560 |
| Size | 455.3 MB | 72.4 MB |
| Events in quadrant A | 2,568,174 | 487,217 |
| Events in quadrant B | 4,331,829 | 473,221 |
| Events in quadrant C | 2,981,097 | 488,994 |
| Events in quadrant D | 4,200,253 | 459,857 |
| Mode SS | |||
|---|---|---|---|
| Quadrant | BADHDUFLAG | Total packets | Discarded packets |
| A | 0 | 114 | 0 |
| B | 0 | 114 | 0 |
| C | 0 | 114 | 0 |
| D | 0 | 114 | 0 |
| Mode M9 | |||
|---|---|---|---|
| Quadrant | BADHDUFLAG | Total packets | Discarded packets |
| A | 0 | 27 | 0 |
| B | 0 | 27 | 0 |
| C | 0 | 27 | 0 |
| D | 0 | 28 | 0 |
| Mode M0 | |||
|---|---|---|---|
| Quadrant | BADHDUFLAG | Total packets | Discarded packets |
| A | 0 | 11445 | 2 |
| B | 0 | 16479 | 1 |
| C | 0 | 12192 | 1 |
| D | 0 | 16341 | 1 |
| Quadrant | Total seconds | Saturated seconds | Saturation percentage |
|---|---|---|---|
| A | 5563 | 12 | 0.215711% |
| B | 5563 | 632 | 11.360777% |
| C | 5563 | 72 | 1.294266% |
| D | 5563 | 224 | 4.026604% |
Noise dominated data is calculated using 1-second bins in cleaned event files. If a bin has >2000 counts, and if more than 50% of those come from <1% of pixels, then it is considered to be noise-dominated and hence unusable.
| Quadrant | # 1 sec bins | Bins with >0 counts | Bins with >2000 counts | High rate bins dominated by noise | Noise dominated (total time) | Noise dominated (detector-on time) | Marked lightcurve |
|---|---|---|---|---|---|---|---|
| A | 7116 | 5564 | 6 | 6 | 0.08% | 0.11% | 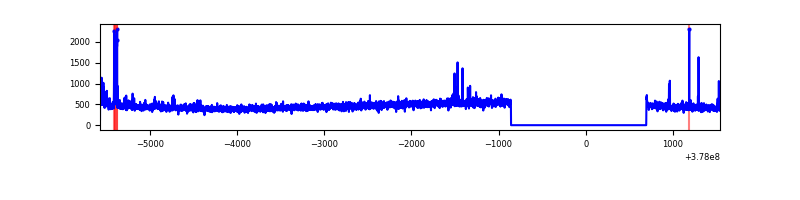 |
| B | 7116 | 5564 | 471 | 471 | 6.62% | 8.47% | 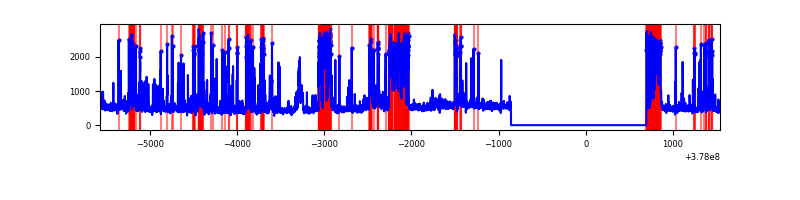 |
| C | 7116 | 5564 | 62 | 62 | 0.87% | 1.11% | 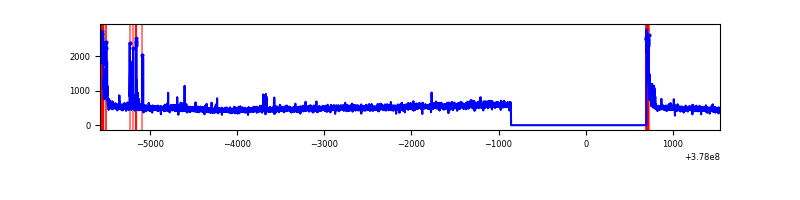 |
| D | 7116 | 5564 | 216 | 216 | 3.04% | 3.88% | 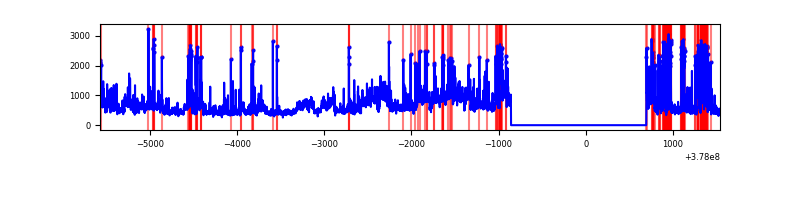 |
Top three noisy pixels from each quadrant. If the there are fewer than three noisy pixels in the level2.evt file, extra rows are filled as -1
| Pixel properties | Quadrant properties | ||||||
|---|---|---|---|---|---|---|---|
| Quadrant | DetID | PixID | Counts | Sigma | Mean | Median | Sigma |
| A | 14 | 4 | 58693 | 448.5 | 642 | 629 | 129.5 |
| A | 15 | 169 | 19459 | 145.45 | 642 | 629 | 129.5 |
| A | 13 | 254 | 9874 | 71.41 | 642 | 629 | 129.5 |
| B | 5 | 172 | 1701561 | 14709.99 | 601 | 584 | 115.6 |
| B | 5 | 200 | 68307 | 585.67 | 601 | 584 | 115.6 |
| B | 0 | 245 | 55546 | 475.31 | 601 | 584 | 115.6 |
| C | 15 | 214 | 260155 | 1790.18 | 624 | 628 | 145.0 |
| C | 0 | 10 | 174518 | 1199.47 | 624 | 628 | 145.0 |
| C | 0 | 239 | 58508 | 399.25 | 624 | 628 | 145.0 |
| D | 8 | 195 | 762529 | 5033.91 | 614 | 598 | 151.4 |
| D | 12 | 16 | 351814 | 2320.4 | 614 | 598 | 151.4 |
| D | 2 | 250 | 237205 | 1563.21 | 614 | 598 | 151.4 |
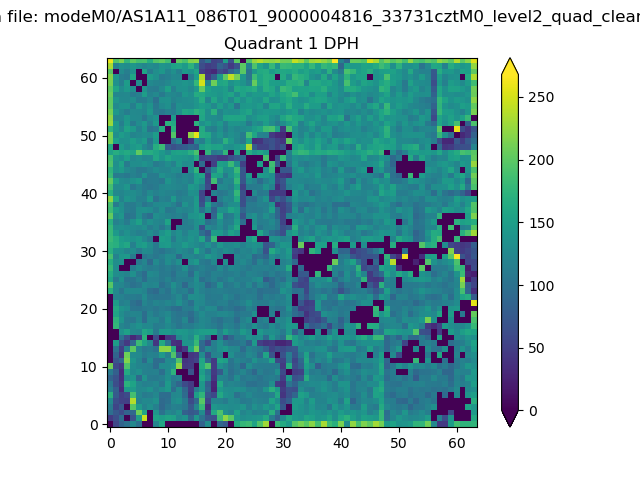
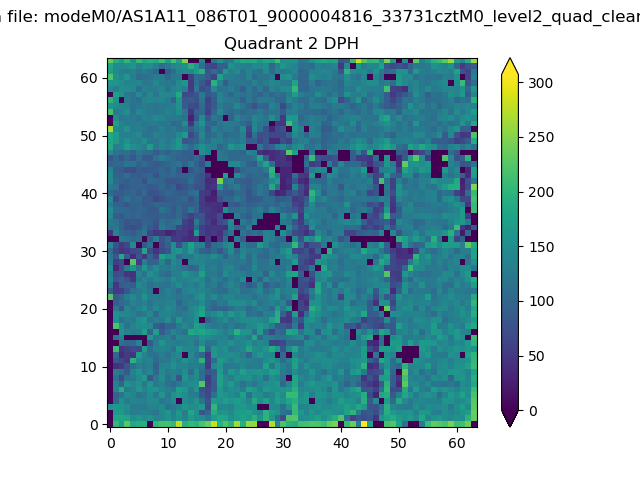
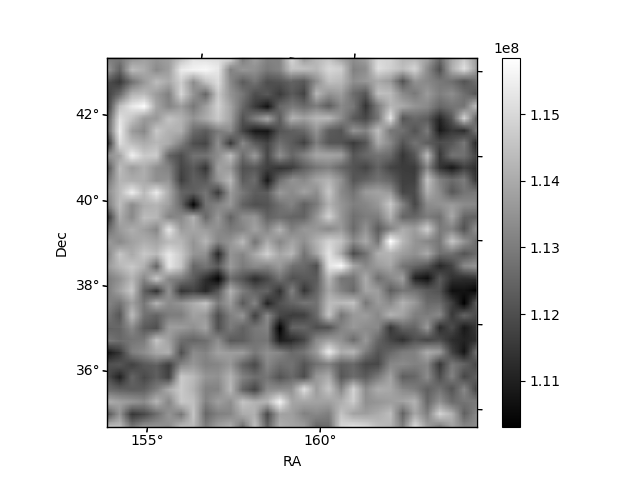
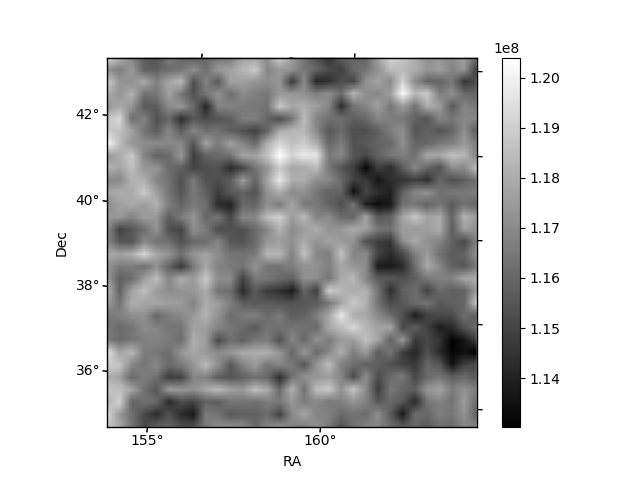
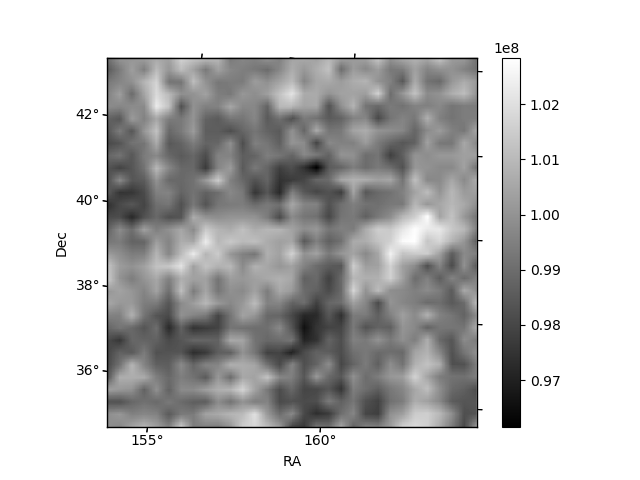
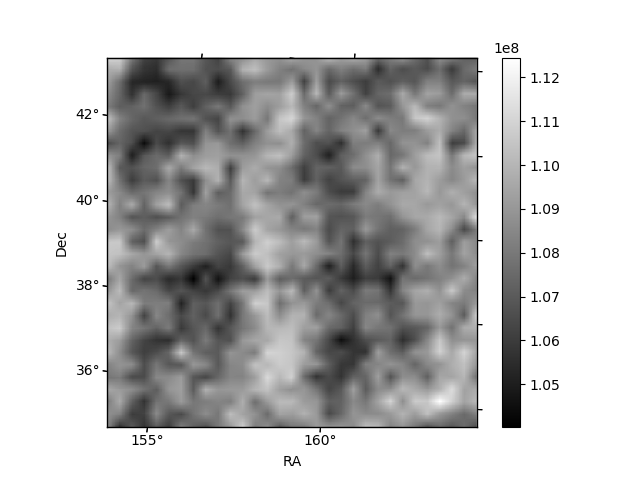
Histogram calculated using DETX and DETY for each event in the final _common_clean file
| Quadrant A |  |
 |
Quadrant B |
|---|---|---|---|
| Quadrant D | 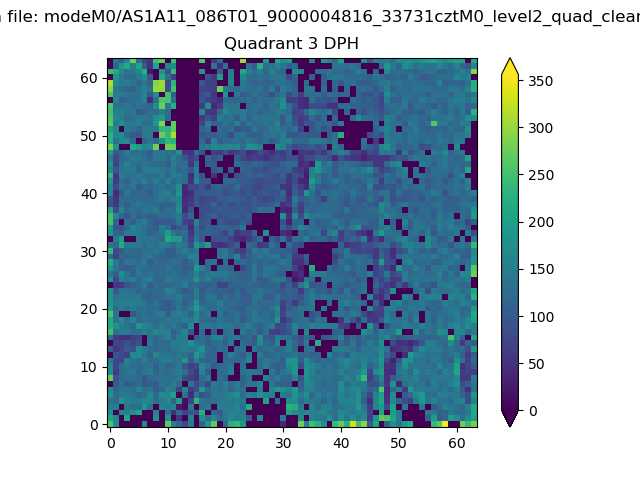 |
 |
Quadrant C |
| Plot type | Count rate plots | Images |
|---|---|---|
| Comparison with Poisson distribution Blue bars denote a histogram of data divided into 1 sec bins. Red curve is a Poisson curve with rate = median count rate of data. |
 |
 |
| Quadrant-wise count rates Data is divided into 100 sec bins |
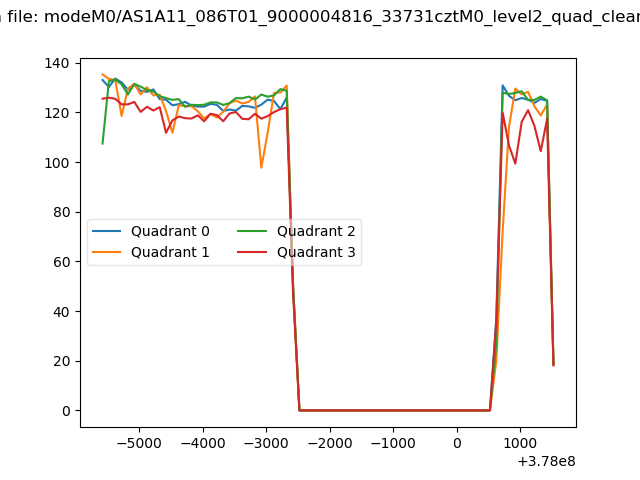 |
|
| Module-wise count rates for Quadrant A Data is divided into 100 sec bins |
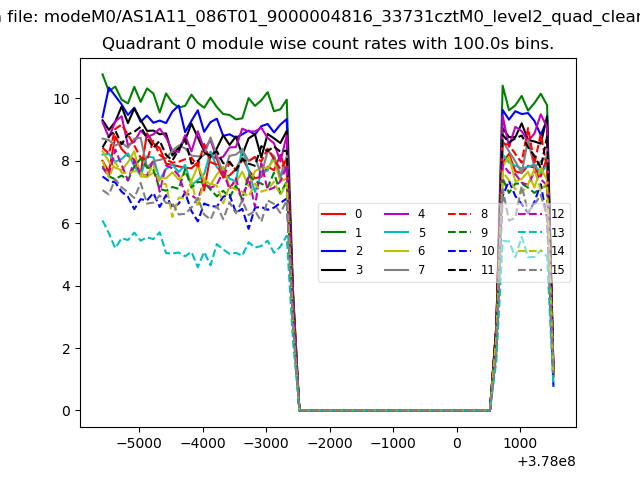 |
 |
| Module-wise count rates for Quadrant B Data is divided into 100 sec bins |
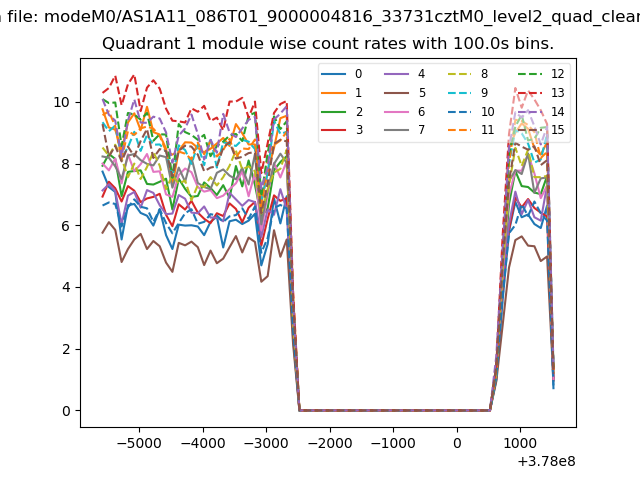 |
 |
| Module-wise count rates for Quadrant C Data is divided into 100 sec bins |
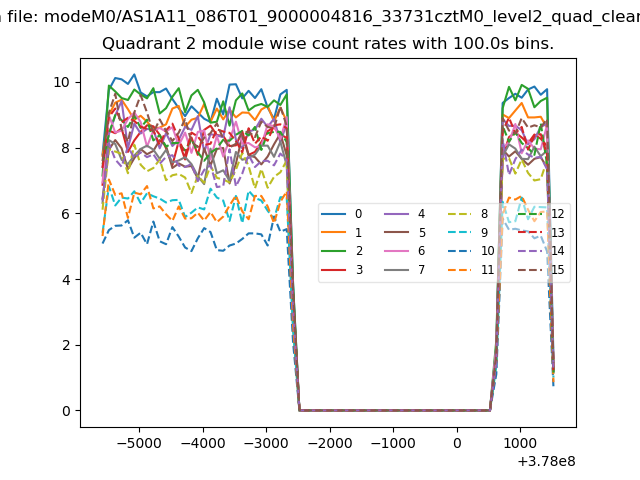 |
 |
| Module-wise count rates for Quadrant D Data is divided into 100 sec bins |
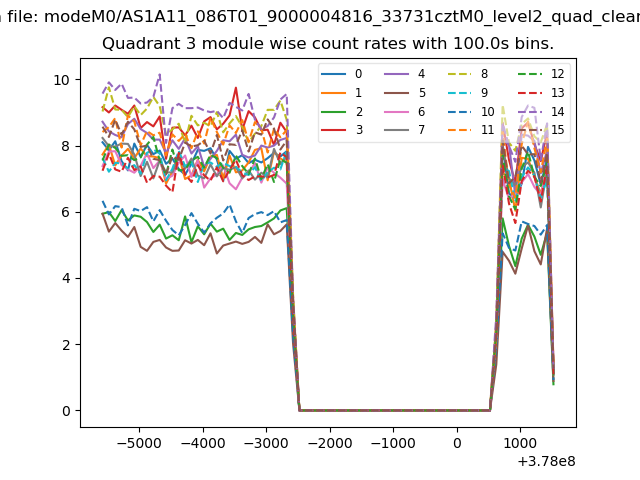 |
 |
| Parameter | Plot |
|---|---|
| CZT HV Monitor | 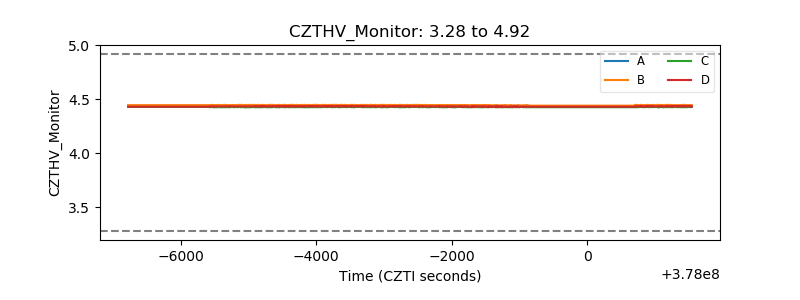 |
| D_VDD | 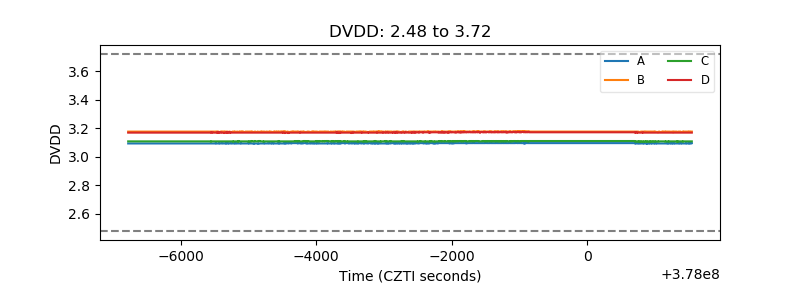 |
| Temperature 1 | 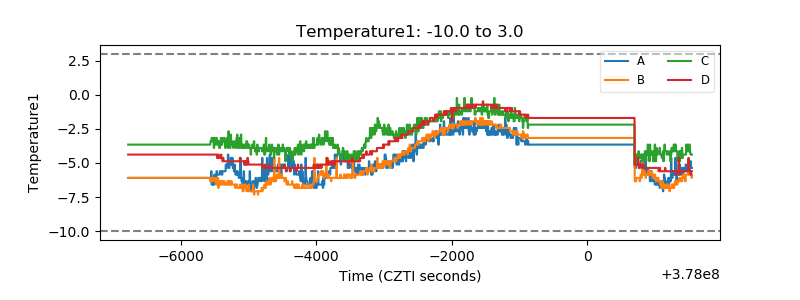 |
| Veto HV Monitor |  |
| Veto LLD | 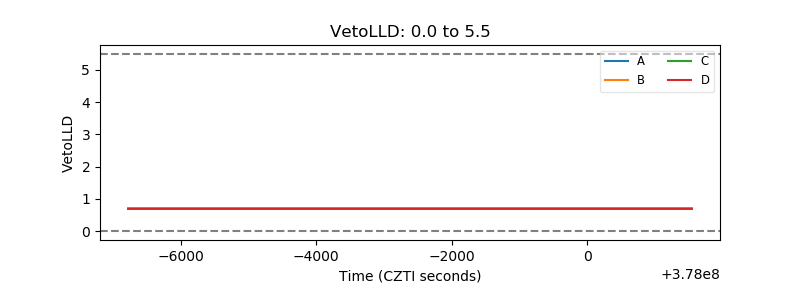 |
| Alpha Counter | 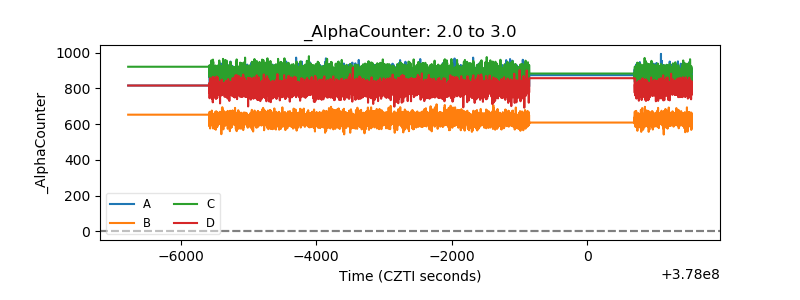 |
| _CPM_Rate | 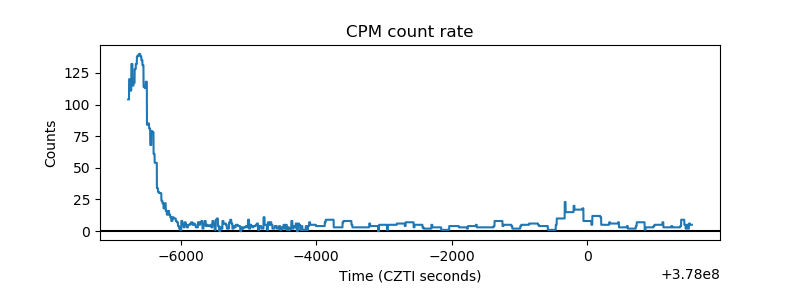 |
| CZT Counter | 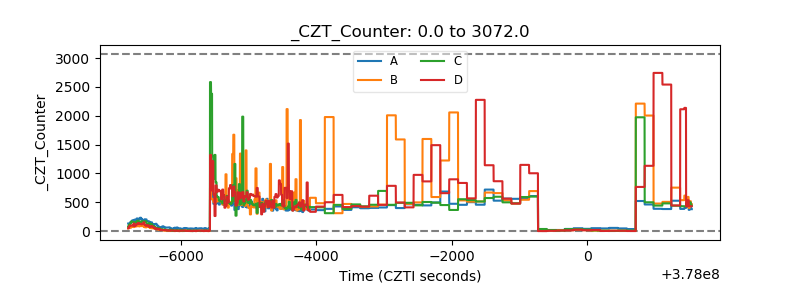 |
| +2.5 Volts monitor |  |
| +5 Volts monitor |  |
| _ROLL_ROT | 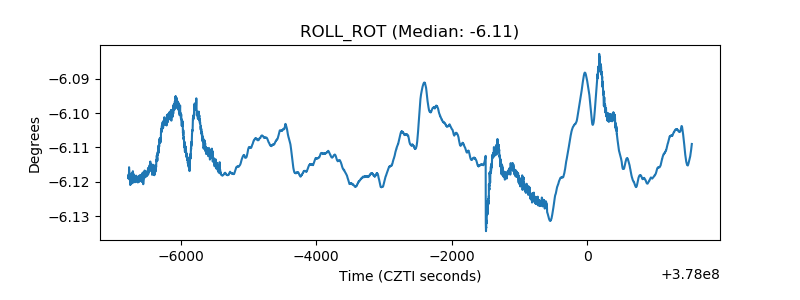 |
| _Roll_DEC | 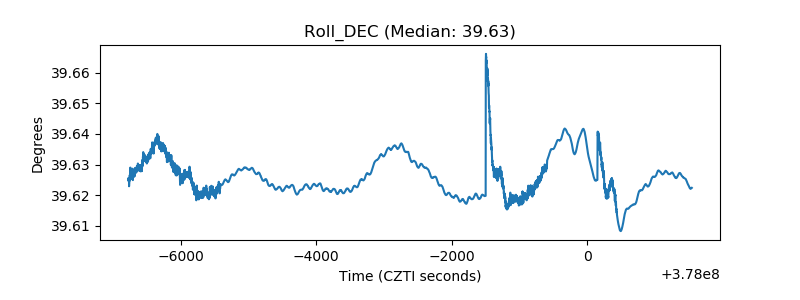 |
| _Roll_RA | 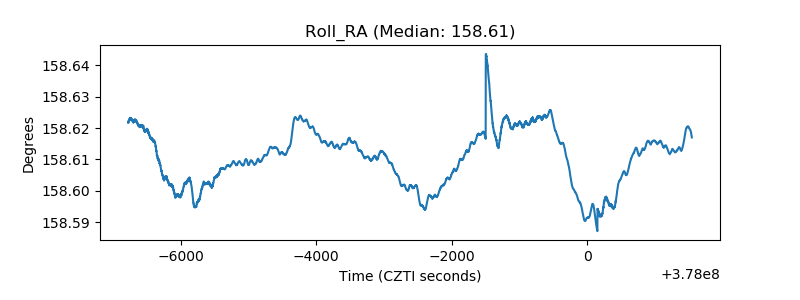 |
| Veto Counter | 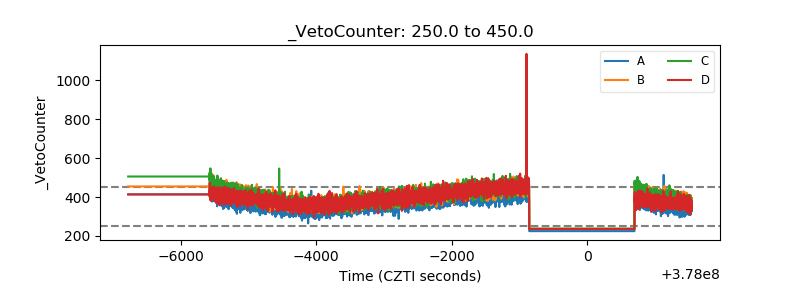 |