| Param | Original file | Final file |
|---|---|---|
| Filename | modeM0/AS1A11_086T01_9000004816_33733cztM0_level2.evt | modeM0/AS1A11_086T01_9000004816_33733cztM0_level2_quad_clean.evt |
| Size (bytes) | 505,949,760 | 76,193,280 |
| Size | 482.5 MB | 72.7 MB |
| Events in quadrant A | 2,787,051 | 480,839 |
| Events in quadrant B | 4,162,696 | 474,423 |
| Events in quadrant C | 3,106,820 | 481,443 |
| Events in quadrant D | 4,859,121 | 451,020 |
| Mode SS | |||
|---|---|---|---|
| Quadrant | BADHDUFLAG | Total packets | Discarded packets |
| A | 0 | 122 | 0 |
| B | 0 | 122 | 0 |
| C | 0 | 122 | 0 |
| D | 0 | 122 | 0 |
| Mode M9 | |||
|---|---|---|---|
| Quadrant | BADHDUFLAG | Total packets | Discarded packets |
| A | 0 | 25 | 0 |
| B | 0 | 25 | 0 |
| C | 0 | 25 | 0 |
| D | 0 | 26 | 0 |
| Mode M0 | |||
|---|---|---|---|
| Quadrant | BADHDUFLAG | Total packets | Discarded packets |
| A | 0 | 12363 | 3 |
| B | 0 | 16231 | 2 |
| C | 0 | 12888 | 2 |
| D | 0 | 18745 | 2 |
| Quadrant | Total seconds | Saturated seconds | Saturation percentage |
|---|---|---|---|
| A | 6004 | 11 | 0.183211% |
| B | 6004 | 369 | 6.145903% |
| C | 6004 | 46 | 0.766156% |
| D | 6004 | 149 | 2.481679% |
Noise dominated data is calculated using 1-second bins in cleaned event files. If a bin has >2000 counts, and if more than 50% of those come from <1% of pixels, then it is considered to be noise-dominated and hence unusable.
| Quadrant | # 1 sec bins | Bins with >0 counts | Bins with >2000 counts | High rate bins dominated by noise | Noise dominated (total time) | Noise dominated (detector-on time) | Marked lightcurve |
|---|---|---|---|---|---|---|---|
| A | 7286 | 6005 | 4 | 4 | 0.05% | 0.07% | 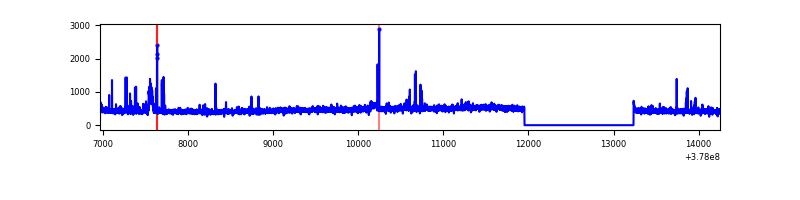 |
| B | 7286 | 6005 | 319 | 319 | 4.38% | 5.31% | 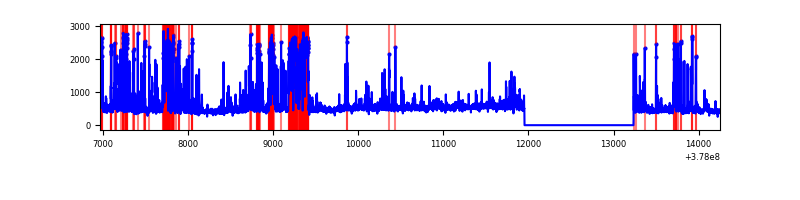 |
| C | 7286 | 6005 | 41 | 41 | 0.56% | 0.68% | 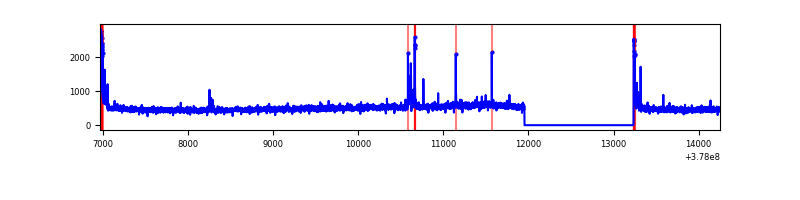 |
| D | 7286 | 6005 | 115 | 115 | 1.58% | 1.92% | 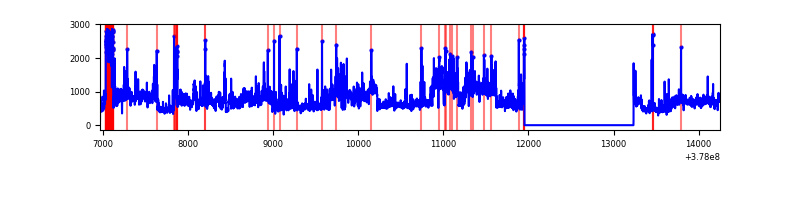 |
Top three noisy pixels from each quadrant. If the there are fewer than three noisy pixels in the level2.evt file, extra rows are filled as -1
| Pixel properties | Quadrant properties | ||||||
|---|---|---|---|---|---|---|---|
| Quadrant | DetID | PixID | Counts | Sigma | Mean | Median | Sigma |
| A | 15 | 237 | 68796 | 492.28 | 690 | 677 | 138.4 |
| A | 15 | 169 | 23909 | 167.89 | 690 | 677 | 138.4 |
| A | 14 | 4 | 20387 | 142.44 | 690 | 677 | 138.4 |
| B | 5 | 172 | 1248112 | 9709.23 | 672 | 656 | 128.5 |
| B | 15 | 222 | 65457 | 504.36 | 672 | 656 | 128.5 |
| B | 5 | 255 | 60616 | 466.68 | 672 | 656 | 128.5 |
| C | 15 | 214 | 280282 | 1804.28 | 669 | 674 | 155.0 |
| C | 0 | 10 | 123682 | 793.76 | 669 | 674 | 155.0 |
| C | 14 | 254 | 41439 | 263.05 | 669 | 674 | 155.0 |
| D | 8 | 195 | 1492341 | 9067.93 | 667 | 647 | 164.5 |
| D | 1 | 52 | 167497 | 1014.27 | 667 | 647 | 164.5 |
| D | 2 | 120 | 154088 | 932.76 | 667 | 647 | 164.5 |
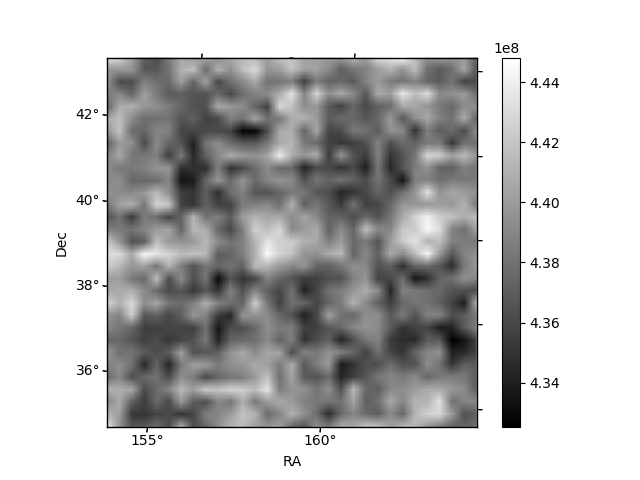
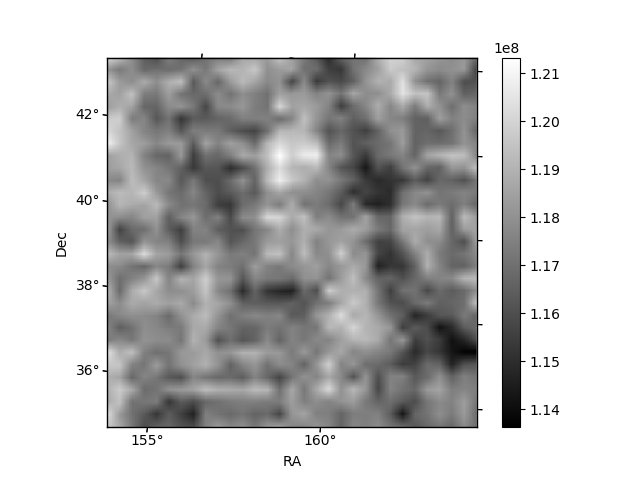
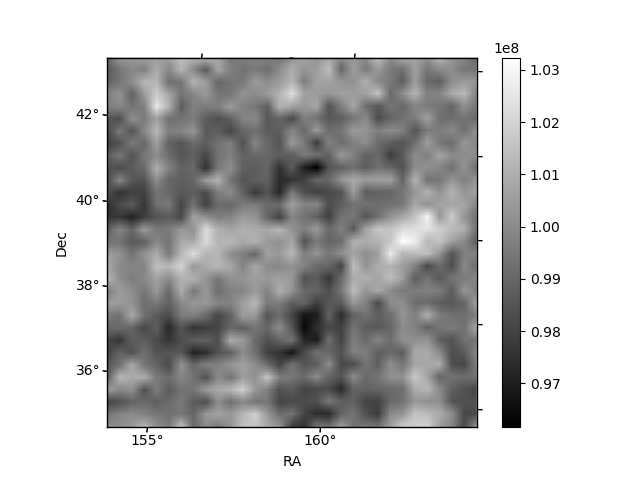
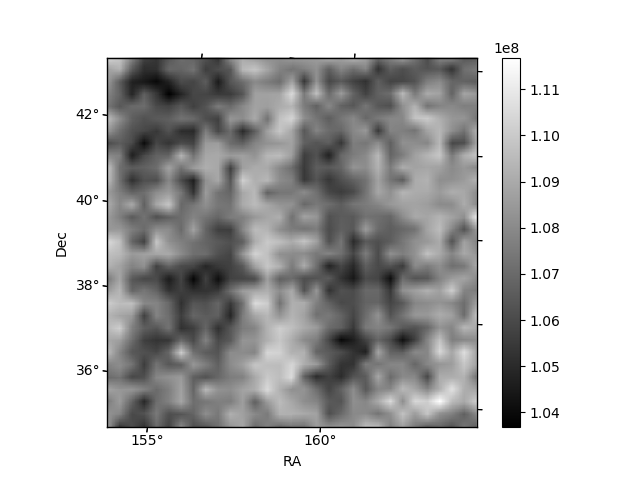
Histogram calculated using DETX and DETY for each event in the final _common_clean file
| Quadrant A | 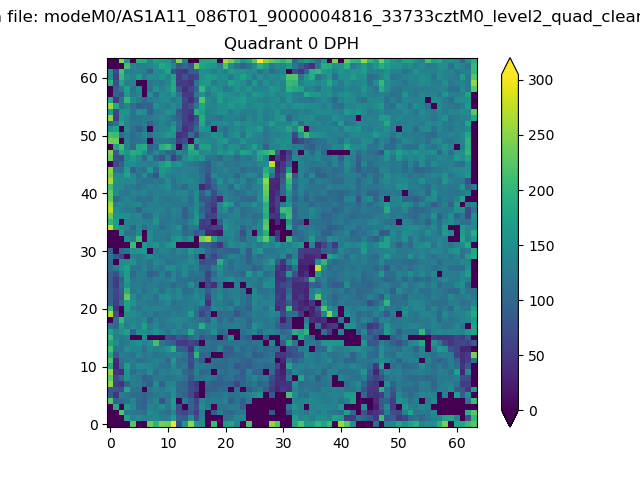 |
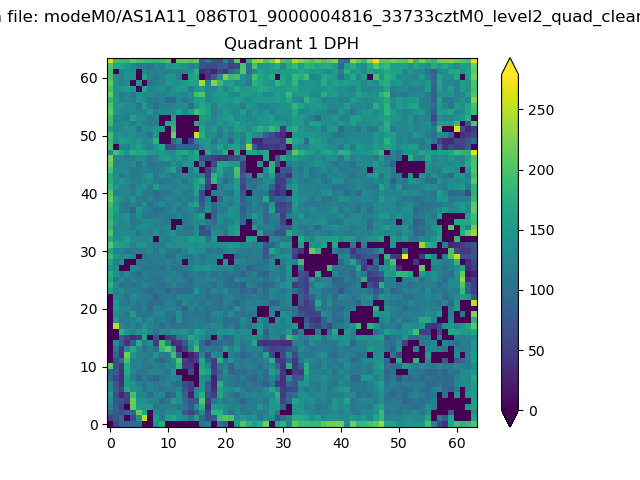 |
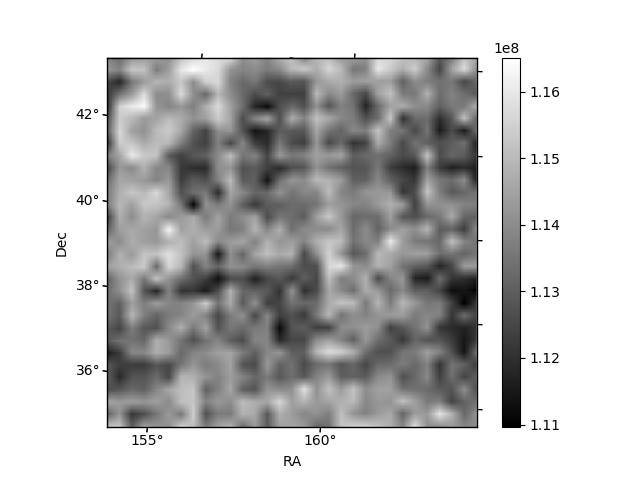
Quadrant B |
|---|---|---|---|
| Quadrant D |  |
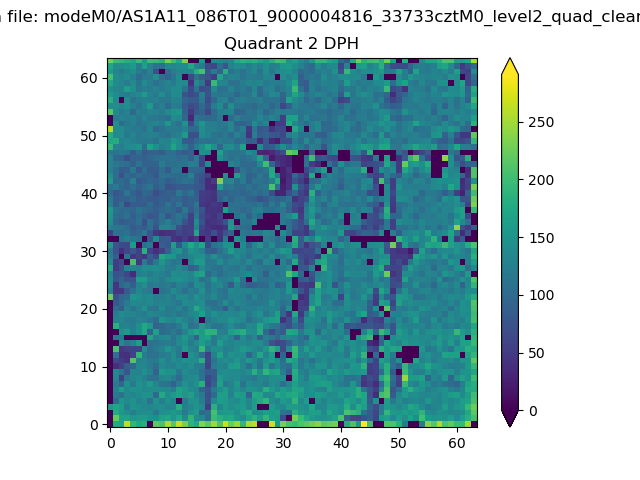 |
Quadrant C |
| Plot type | Count rate plots | Images |
|---|---|---|
| Comparison with Poisson distribution Blue bars denote a histogram of data divided into 1 sec bins. Red curve is a Poisson curve with rate = median count rate of data. |
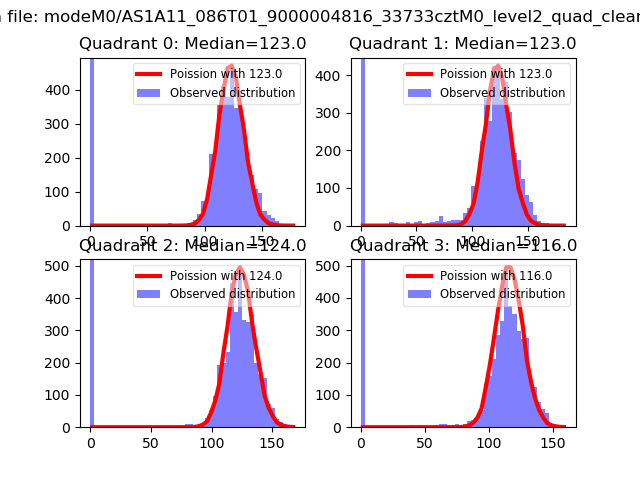 |
 |
| Quadrant-wise count rates Data is divided into 100 sec bins |
 |
|
| Module-wise count rates for Quadrant A Data is divided into 100 sec bins |
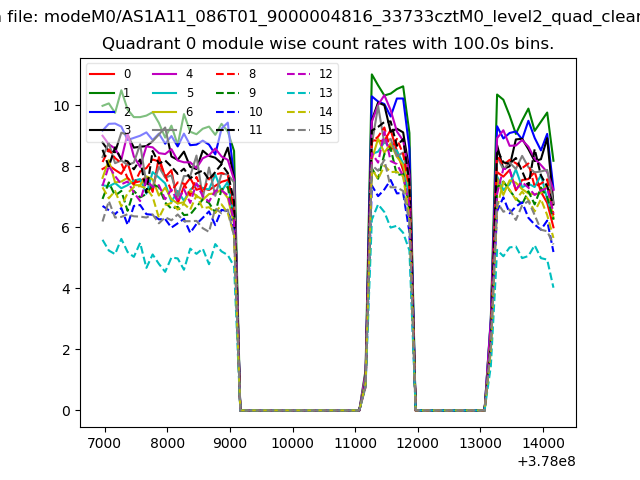 |
 |
| Module-wise count rates for Quadrant B Data is divided into 100 sec bins |
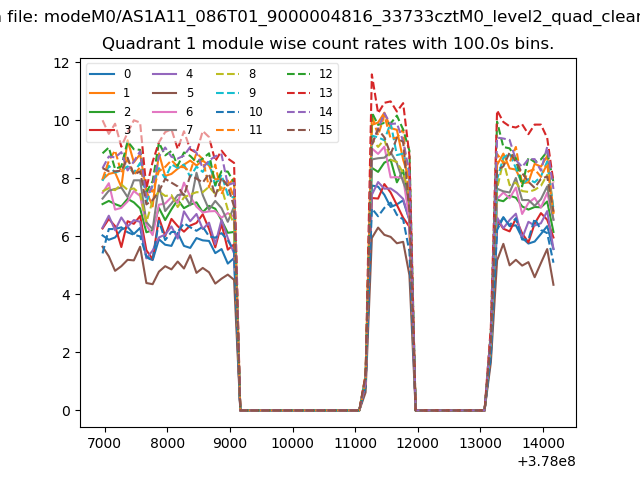 |
 |
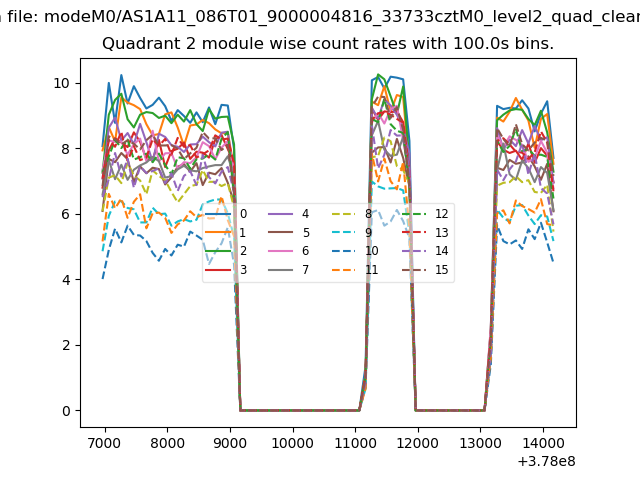
| Module-wise count rates for Quadrant C Data is divided into 100 sec bins |
 |
 |
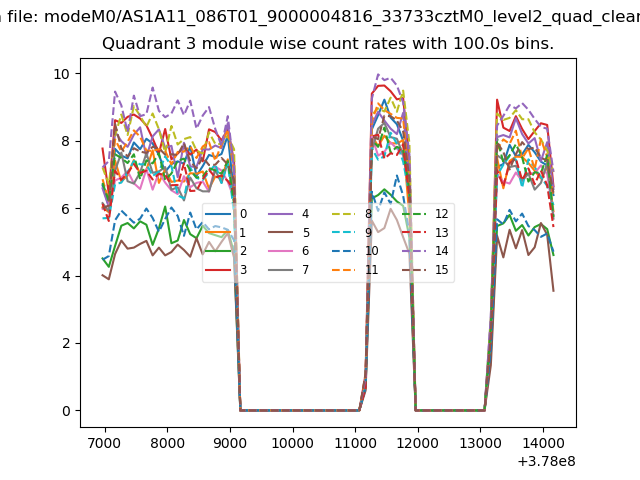
| Module-wise count rates for Quadrant D Data is divided into 100 sec bins |
 |
 |
| Parameter | Plot |
|---|---|
| CZT HV Monitor | 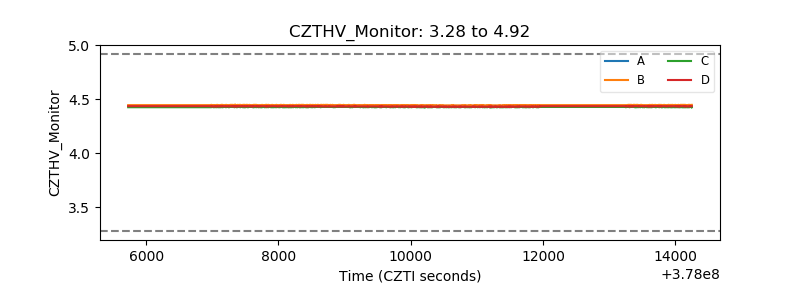 |
| D_VDD | 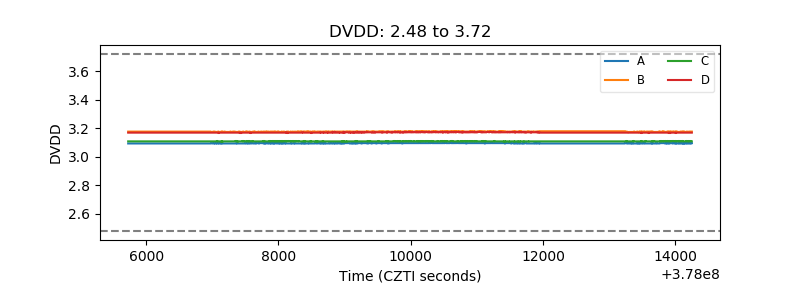 |
| Temperature 1 | 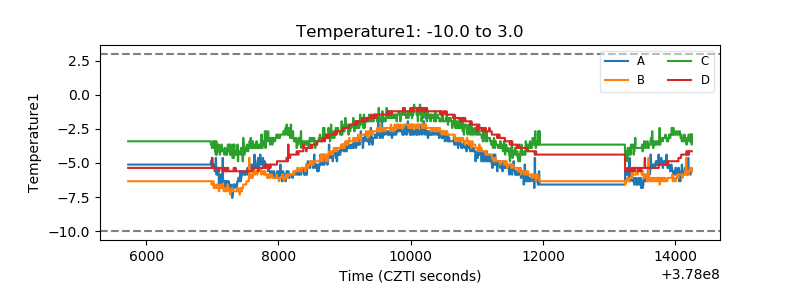 |
| Veto HV Monitor |  |
| Veto LLD | 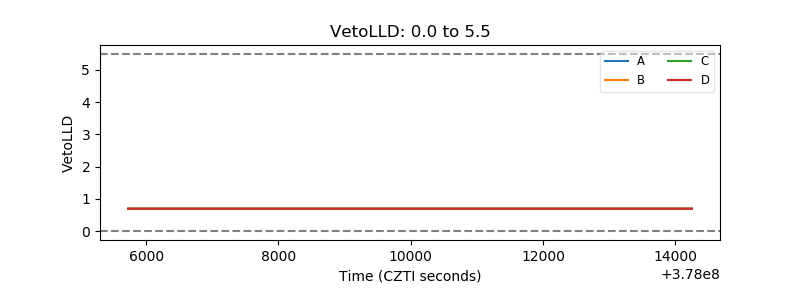 |
| Alpha Counter | 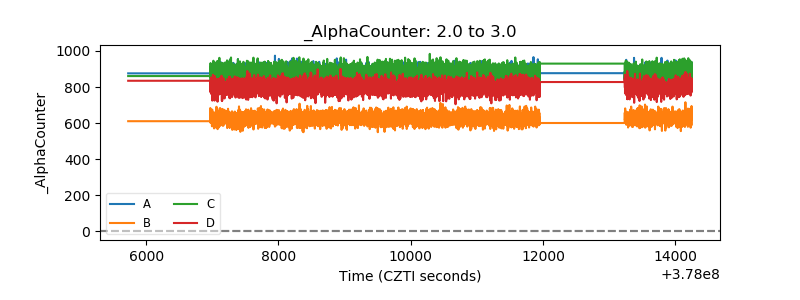 |
| _CPM_Rate | 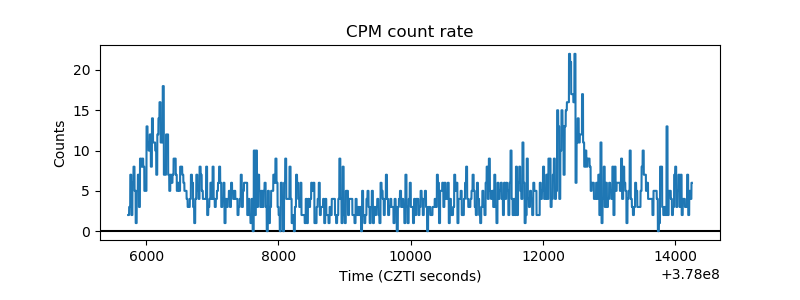 |
| CZT Counter |  |
| +2.5 Volts monitor |  |
| +5 Volts monitor |  |
| _ROLL_ROT | 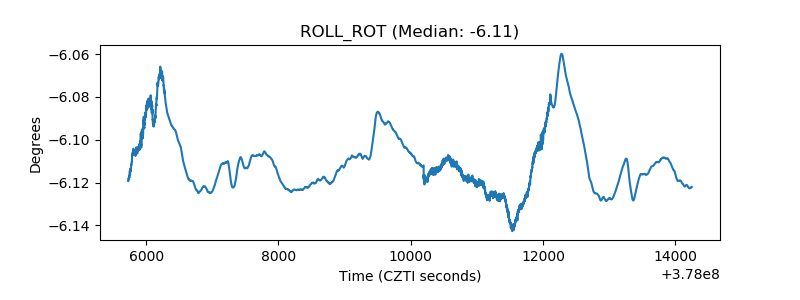 |
| _Roll_DEC | 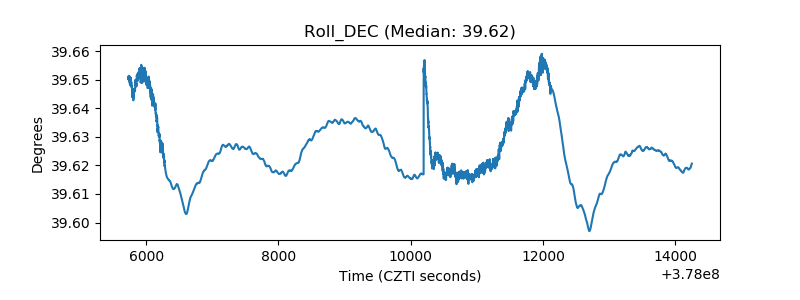 |
| _Roll_RA | 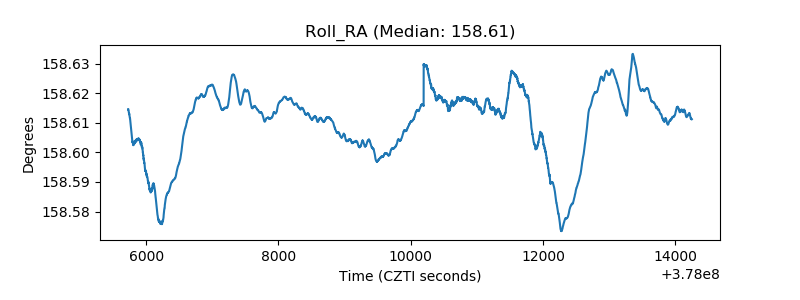 |
| Veto Counter | 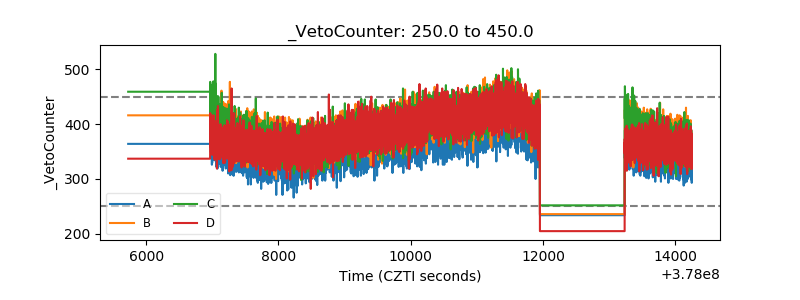 |