| Param | Original file | Final file |
|---|---|---|
| Filename | modeM0/AS1A11_086T01_9000004816_33735cztM0_level2.evt | modeM0/AS1A11_086T01_9000004816_33735cztM0_level2_quad_clean.evt |
| Size (bytes) | 978,937,920 | 129,432,960 |
| Size | 933.6 MB | 123.4 MB |
| Events in quadrant A | 5,120,948 | 808,481 |
| Events in quadrant B | 7,557,725 | 792,808 |
| Events in quadrant C | 5,939,087 | 812,650 |
| Events in quadrant D | 10,295,684 | 752,797 |
| Mode SS | |||
|---|---|---|---|
| Quadrant | BADHDUFLAG | Total packets | Discarded packets |
| A | 0 | 222 | 0 |
| B | 0 | 222 | 0 |
| C | 0 | 222 | 0 |
| D | 0 | 222 | 0 |
| Mode M9 | |||
|---|---|---|---|
| Quadrant | BADHDUFLAG | Total packets | Discarded packets |
| A | 0 | 39 | 0 |
| B | 0 | 39 | 0 |
| C | 0 | 39 | 0 |
| D | 0 | 39 | 0 |
| Mode M0 | |||
|---|---|---|---|
| Quadrant | BADHDUFLAG | Total packets | Discarded packets |
| A | 0 | 22285 | 4 |
| B | 0 | 29373 | 3 |
| C | 0 | 23862 | 3 |
| D | 0 | 38280 | 3 |
| Quadrant | Total seconds | Saturated seconds | Saturation percentage |
|---|---|---|---|
| A | 10871 | 31 | 0.285162% |
| B | 10871 | 833 | 7.662589% |
| C | 10871 | 134 | 1.232637% |
| D | 10871 | 774 | 7.119860% |
Noise dominated data is calculated using 1-second bins in cleaned event files. If a bin has >2000 counts, and if more than 50% of those come from <1% of pixels, then it is considered to be noise-dominated and hence unusable.
| Quadrant | # 1 sec bins | Bins with >0 counts | Bins with >2000 counts | High rate bins dominated by noise | Noise dominated (total time) | Noise dominated (detector-on time) | Marked lightcurve |
|---|---|---|---|---|---|---|---|
| A | 13645 | 10873 | 11 | 11 | 0.08% | 0.10% | 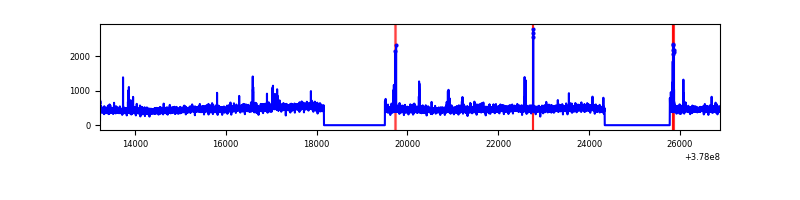 |
| B | 13645 | 10873 | 659 | 659 | 4.83% | 6.06% | 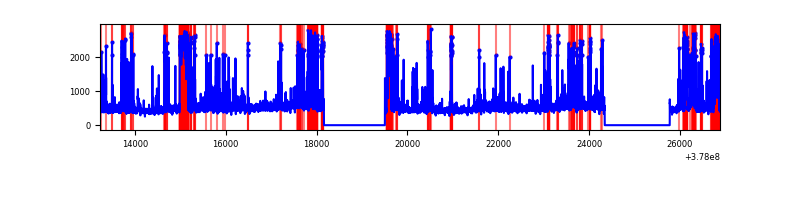 |
| C | 13644 | 10872 | 131 | 131 | 0.96% | 1.20% | 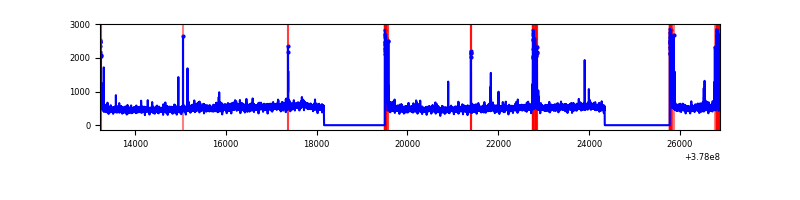 |
| D | 13645 | 10873 | 745 | 745 | 5.46% | 6.85% | 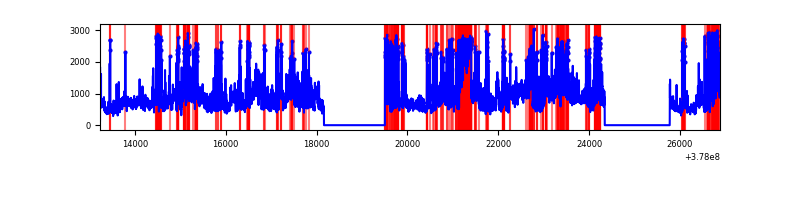 |
Top three noisy pixels from each quadrant. If the there are fewer than three noisy pixels in the level2.evt file, extra rows are filled as -1
| Pixel properties | Quadrant properties | ||||||
|---|---|---|---|---|---|---|---|
| Quadrant | DetID | PixID | Counts | Sigma | Mean | Median | Sigma |
| A | 14 | 4 | 104612 | 405.41 | 1273 | 1248 | 255.0 |
| A | 15 | 169 | 38203 | 144.94 | 1273 | 1248 | 255.0 |
| A | 0 | 31 | 20214 | 74.39 | 1273 | 1248 | 255.0 |
| B | 5 | 172 | 2276402 | 9726.63 | 1226 | 1194 | 233.9 |
| B | 5 | 255 | 119561 | 506.03 | 1226 | 1194 | 233.9 |
| B | 0 | 245 | 79910 | 336.52 | 1226 | 1194 | 233.9 |
| C | 15 | 214 | 493428 | 1745.51 | 1230 | 1240 | 282.0 |
| C | 0 | 10 | 213047 | 751.16 | 1230 | 1240 | 282.0 |
| C | 14 | 254 | 187815 | 661.67 | 1230 | 1240 | 282.0 |
| D | 8 | 195 | 2530190 | 8568.58 | 1205 | 1168 | 295.2 |
| D | 7 | 80 | 905322 | 3063.36 | 1205 | 1168 | 295.2 |
| D | 12 | 233 | 566537 | 1915.53 | 1205 | 1168 | 295.2 |
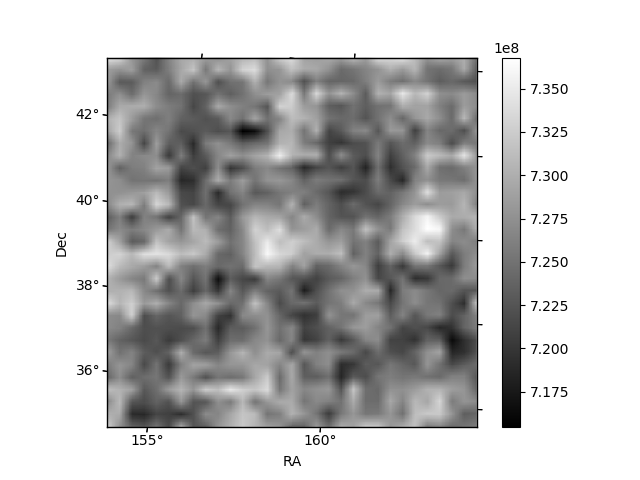
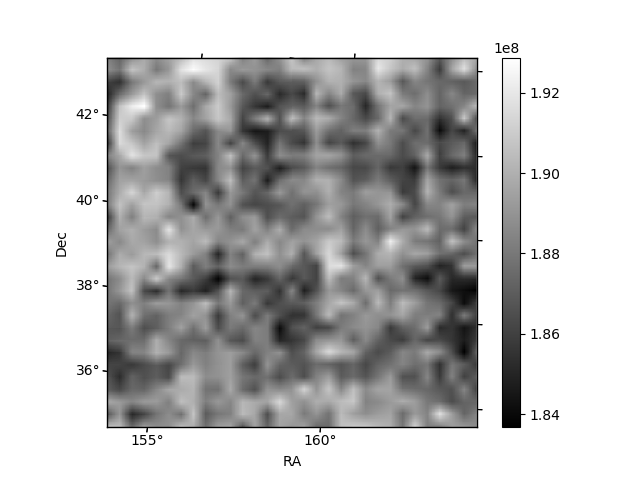
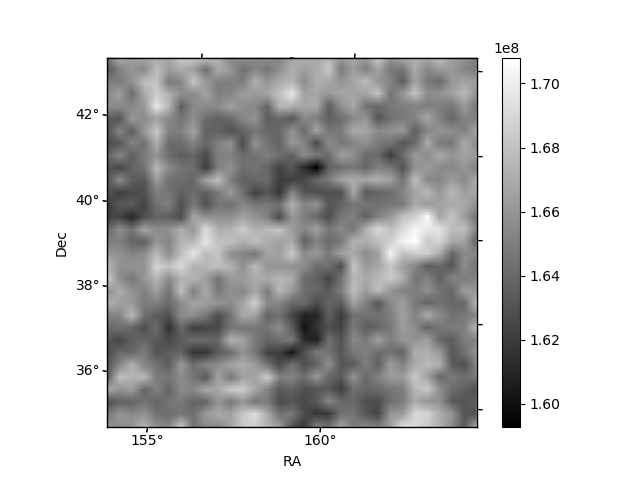
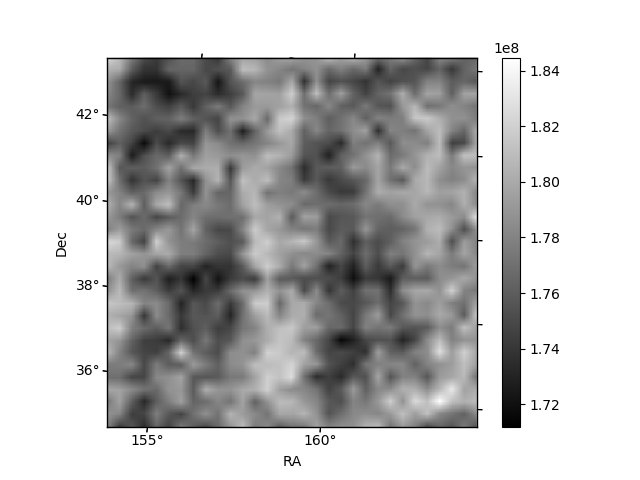
Histogram calculated using DETX and DETY for each event in the final _common_clean file
| Quadrant A | 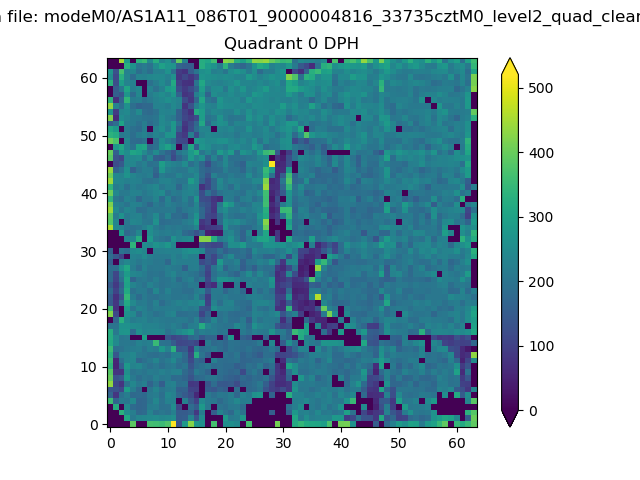 |
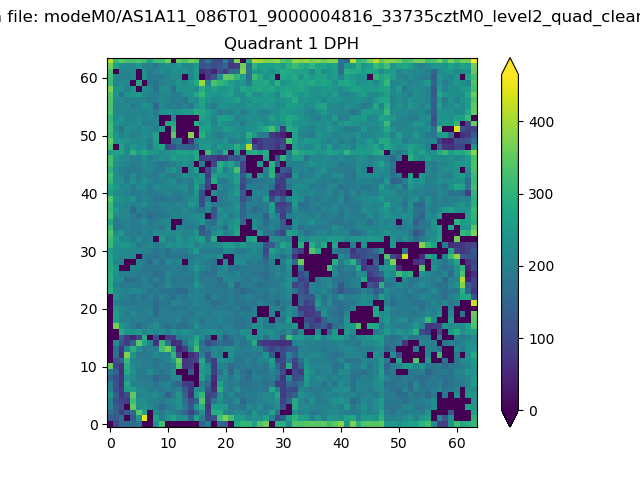 |
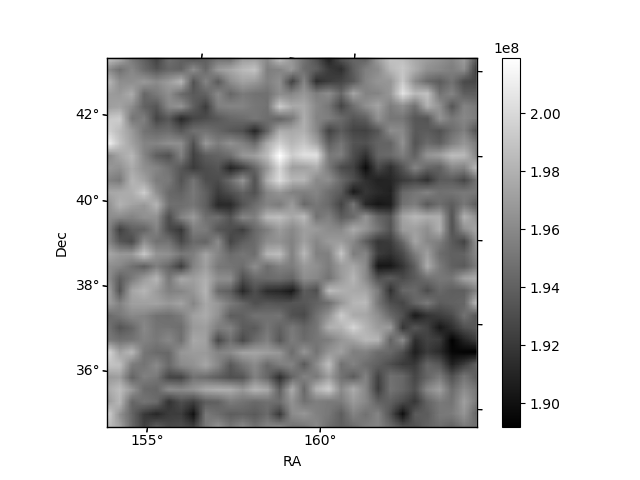
Quadrant B |
|---|---|---|---|
| Quadrant D | 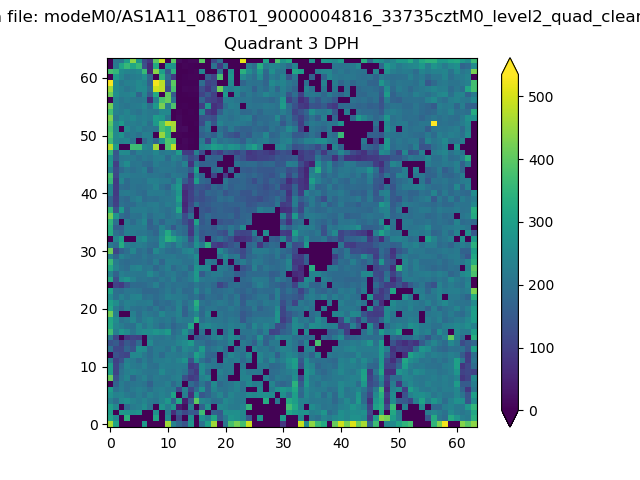 |
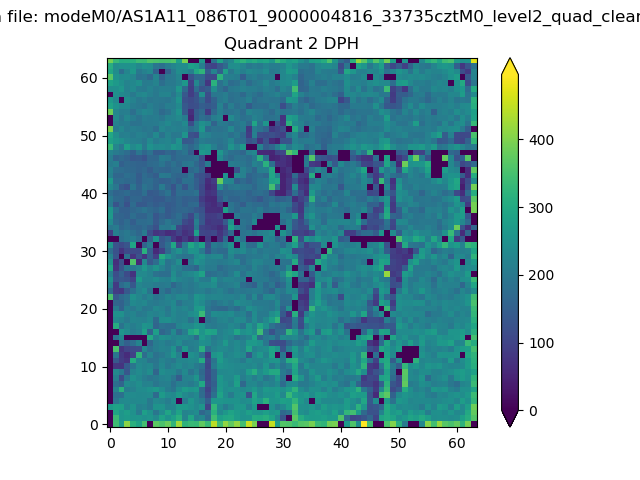 |
Quadrant C |
| Plot type | Count rate plots | Images |
|---|---|---|
| Comparison with Poisson distribution Blue bars denote a histogram of data divided into 1 sec bins. Red curve is a Poisson curve with rate = median count rate of data. |
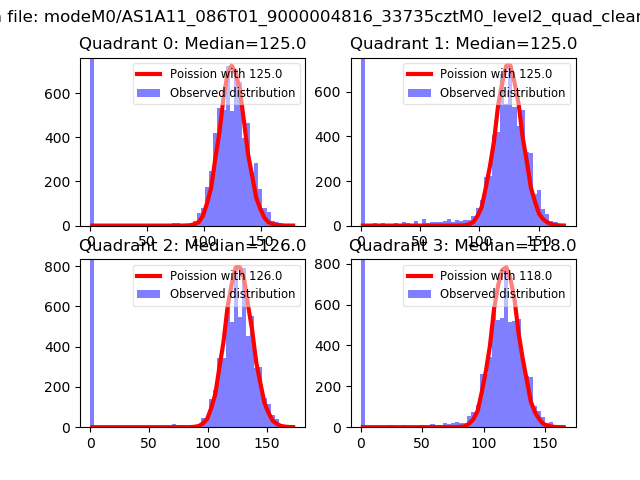 |
 |
| Quadrant-wise count rates Data is divided into 100 sec bins |
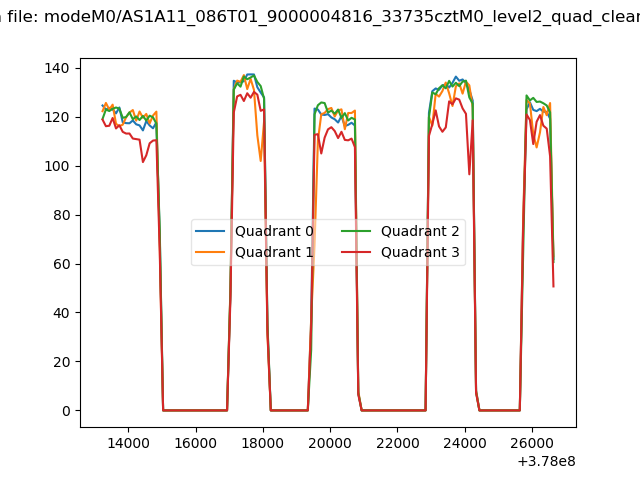 |
|
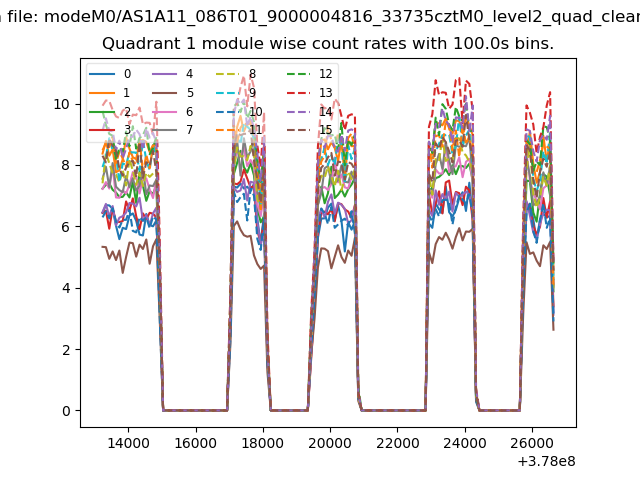
| Module-wise count rates for Quadrant A Data is divided into 100 sec bins |
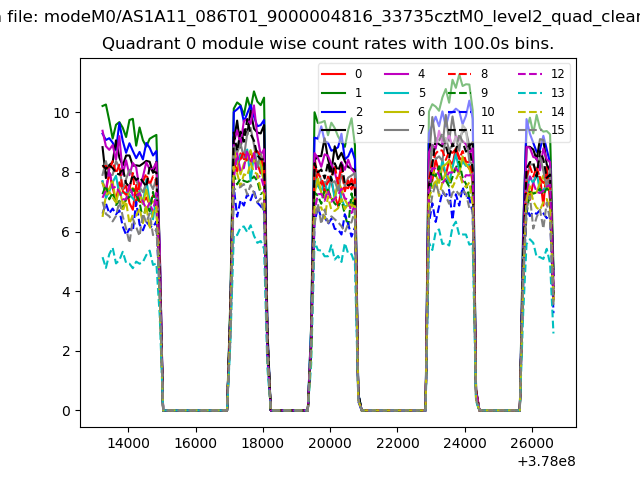 |
 |
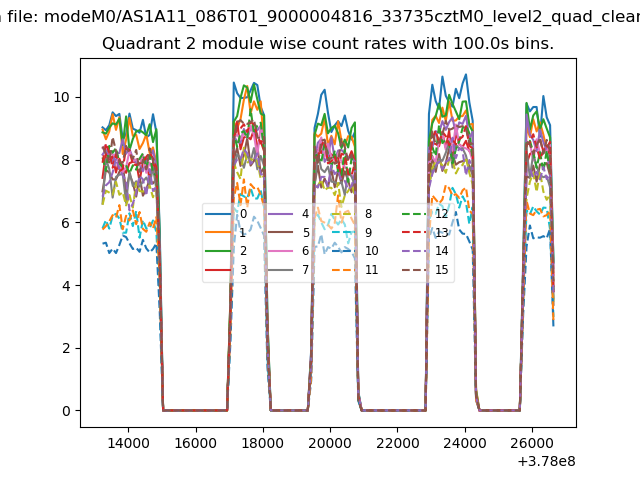
| Module-wise count rates for Quadrant B Data is divided into 100 sec bins |
 |
 |
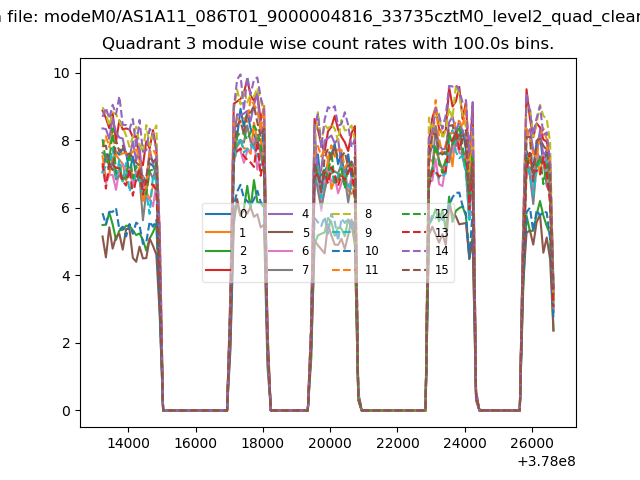
| Module-wise count rates for Quadrant C Data is divided into 100 sec bins |
 |
 |
| Module-wise count rates for Quadrant D Data is divided into 100 sec bins |
 |
 |
| Parameter | Plot |
|---|---|
| CZT HV Monitor | 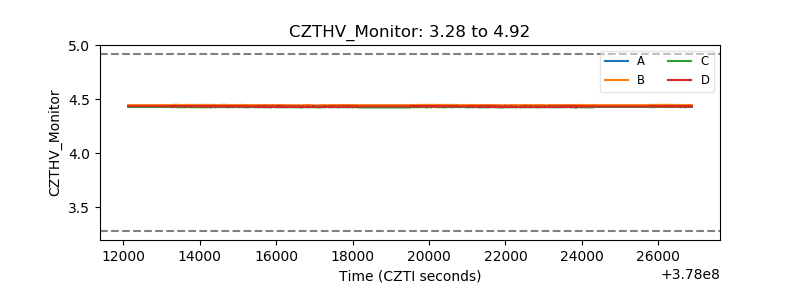 |
| D_VDD | 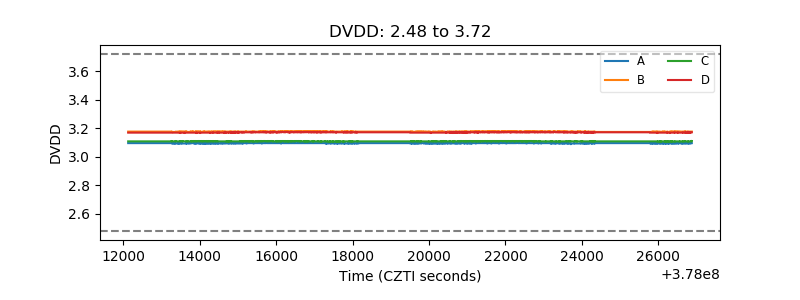 |
| Temperature 1 | 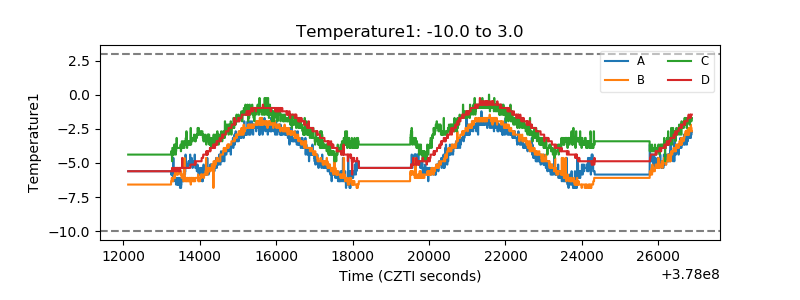 |
| Veto HV Monitor | 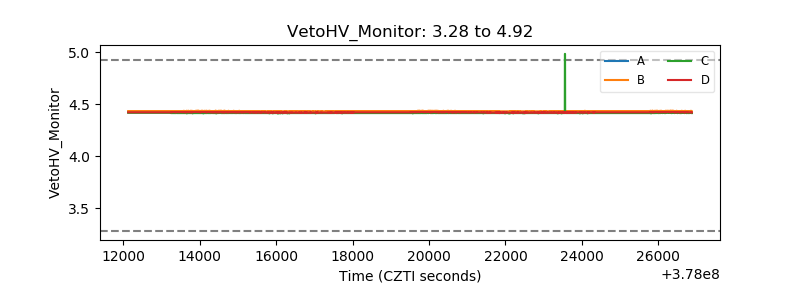 |
| Veto LLD | 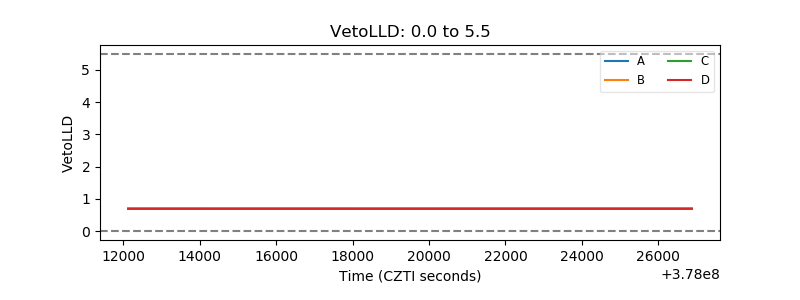 |
| Alpha Counter | 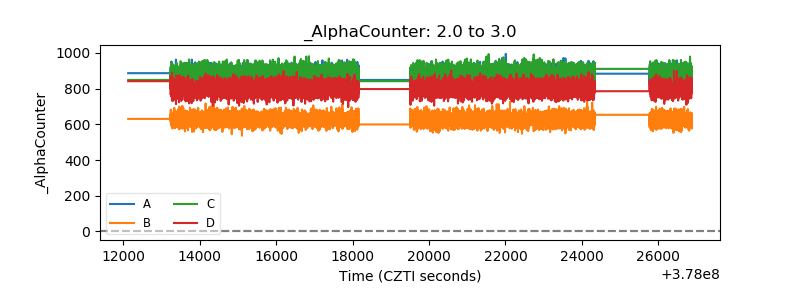 |
| _CPM_Rate | 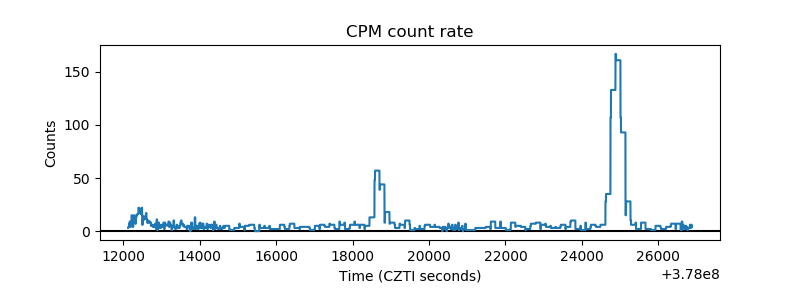 |
| CZT Counter | 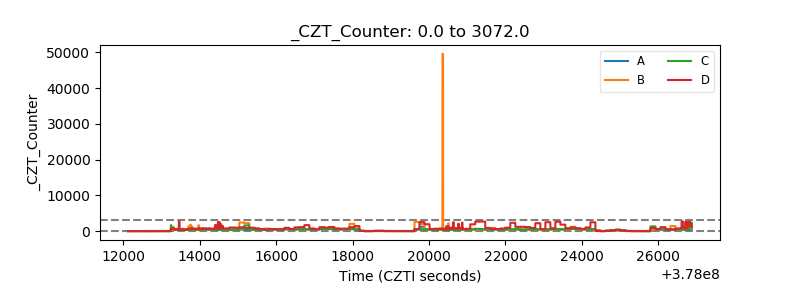 |
| +2.5 Volts monitor | 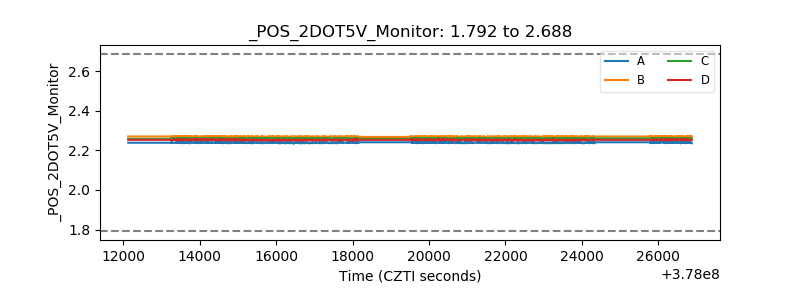 |
| +5 Volts monitor | 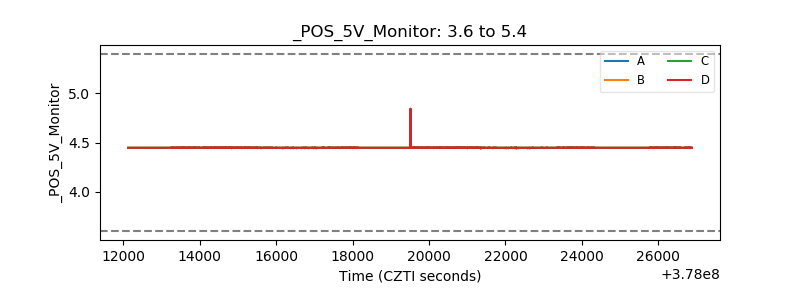 |
| _ROLL_ROT | 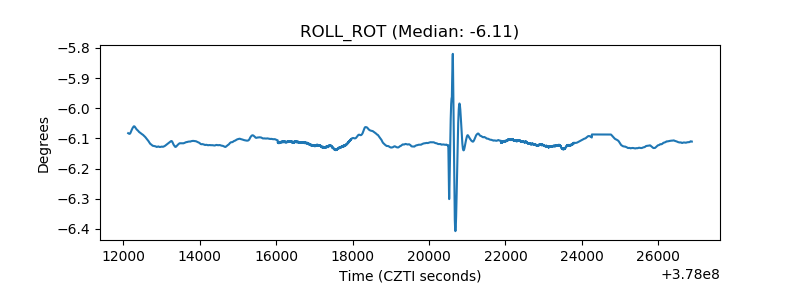 |
| _Roll_DEC |  |
| _Roll_RA | 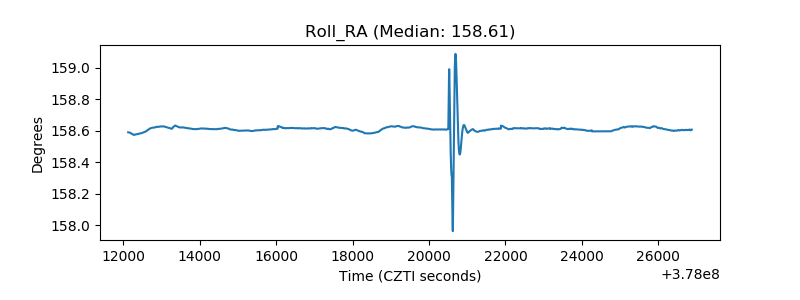 |
| Veto Counter | 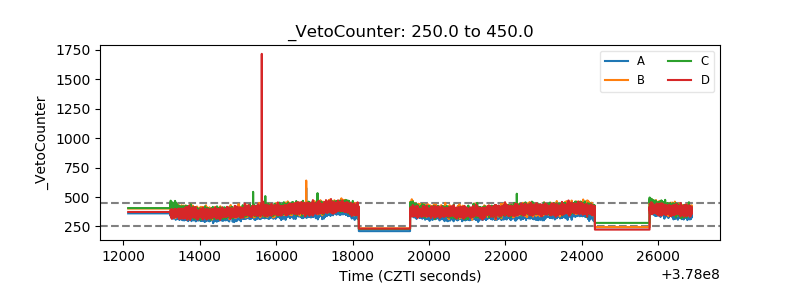 |