| Param | Original file | Final file |
|---|---|---|
| Filename | modeM0/AS1A11_086T01_9000004816_33736cztM0_level2.evt | modeM0/AS1A11_086T01_9000004816_33736cztM0_level2_quad_clean.evt |
| Size (bytes) | 2,106,270,720 | 244,598,400 |
| Size | 2.0 GB | 233.3 MB |
| Events in quadrant A | 10,678,642 | 1,499,833 |
| Events in quadrant B | 15,696,980 | 1,472,302 |
| Events in quadrant C | 12,298,822 | 1,506,463 |
| Events in quadrant D | 23,578,370 | 1,358,055 |
| Mode SS | |||
|---|---|---|---|
| Quadrant | BADHDUFLAG | Total packets | Discarded packets |
| A | 0 | 464 | 0 |
| B | 0 | 464 | 0 |
| C | 0 | 464 | 0 |
| D | 0 | 464 | 0 |
| Mode M9 | |||
|---|---|---|---|
| Quadrant | BADHDUFLAG | Total packets | Discarded packets |
| A | 0 | 56 | 0 |
| B | 0 | 56 | 0 |
| C | 0 | 56 | 0 |
| D | 0 | 56 | 0 |
| Mode M0 | |||
|---|---|---|---|
| Quadrant | BADHDUFLAG | Total packets | Discarded packets |
| A | 0 | 46713 | 5 |
| B | 0 | 61215 | 4 |
| C | 0 | 49923 | 4 |
| D | 0 | 86237 | 4 |
| Quadrant | Total seconds | Saturated seconds | Saturation percentage |
|---|---|---|---|
| A | 22821 | 44 | 0.192805% |
| B | 22821 | 1474 | 6.458963% |
| C | 22821 | 206 | 0.902677% |
| D | 22821 | 2685 | 11.765479% |
Noise dominated data is calculated using 1-second bins in cleaned event files. If a bin has >2000 counts, and if more than 50% of those come from <1% of pixels, then it is considered to be noise-dominated and hence unusable.
| Quadrant | # 1 sec bins | Bins with >0 counts | Bins with >2000 counts | High rate bins dominated by noise | Noise dominated (total time) | Noise dominated (detector-on time) | Marked lightcurve |
|---|---|---|---|---|---|---|---|
| A | 31516 | 22826 | 20 | 20 | 0.06% | 0.09% | 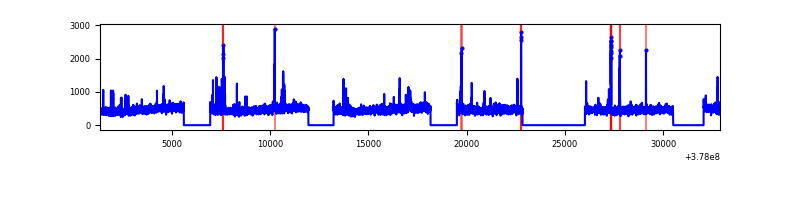 |
| B | 31516 | 22826 | 1196 | 1196 | 3.79% | 5.24% | 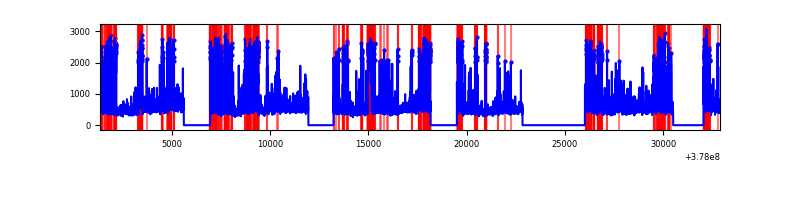 |
| C | 31516 | 22826 | 186 | 186 | 0.59% | 0.81% | 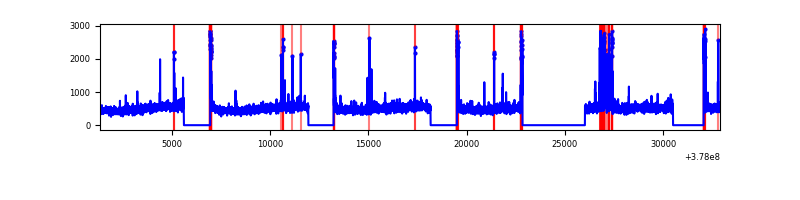 |
| D | 31516 | 22826 | 2617 | 2617 | 8.30% | 11.46% | 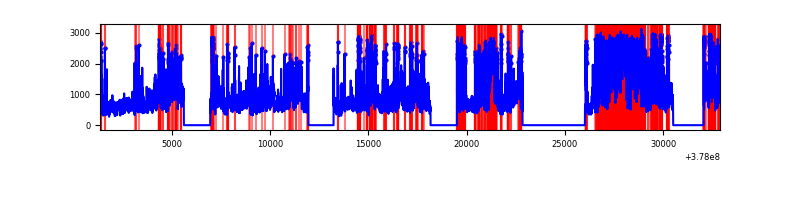 |
Top three noisy pixels from each quadrant. If the there are fewer than three noisy pixels in the level2.evt file, extra rows are filled as -1
| Pixel properties | Quadrant properties | ||||||
|---|---|---|---|---|---|---|---|
| Quadrant | DetID | PixID | Counts | Sigma | Mean | Median | Sigma |
| A | 14 | 4 | 147947 | 274.58 | 2671 | 2618 | 529.3 |
| A | 15 | 237 | 88956 | 163.13 | 2671 | 2618 | 529.3 |
| A | 15 | 169 | 80676 | 147.48 | 2671 | 2618 | 529.3 |
| B | 5 | 172 | 4245068 | 8727.13 | 2583 | 2514 | 486.1 |
| B | 5 | 255 | 317539 | 648.02 | 2583 | 2514 | 486.1 |
| B | 0 | 245 | 200403 | 407.07 | 2583 | 2514 | 486.1 |
| C | 15 | 214 | 1026995 | 1735.63 | 2582 | 2601 | 590.2 |
| C | 14 | 254 | 522879 | 881.51 | 2582 | 2601 | 590.2 |
| C | 0 | 10 | 282212 | 473.75 | 2582 | 2601 | 590.2 |
| D | 8 | 195 | 5118993 | 8518.27 | 2466 | 2397 | 600.7 |
| D | 1 | 52 | 5040856 | 8388.19 | 2466 | 2397 | 600.7 |
| D | 7 | 80 | 812955 | 1349.44 | 2466 | 2397 | 600.7 |
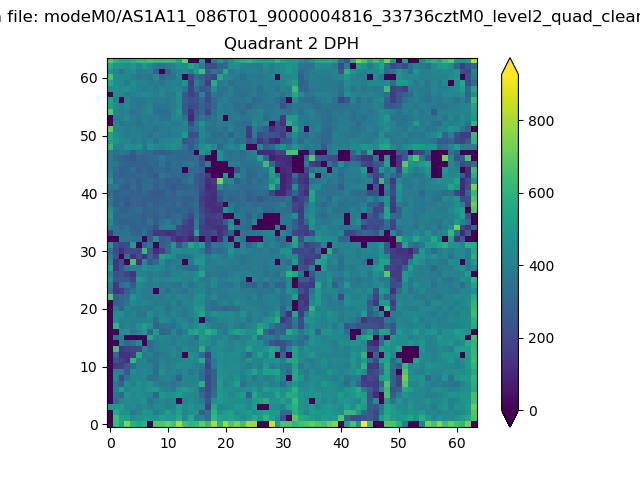
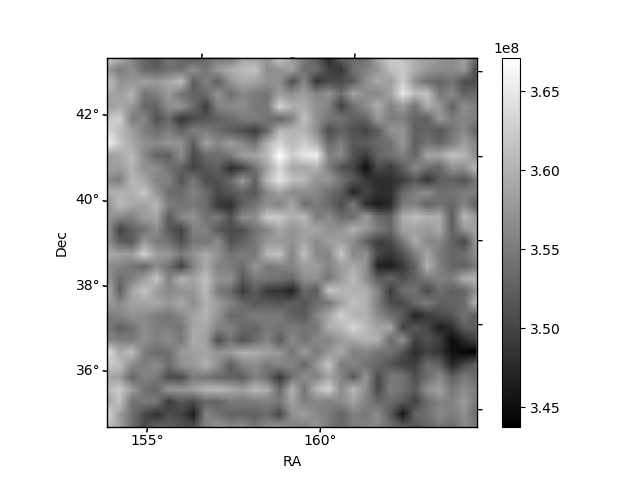
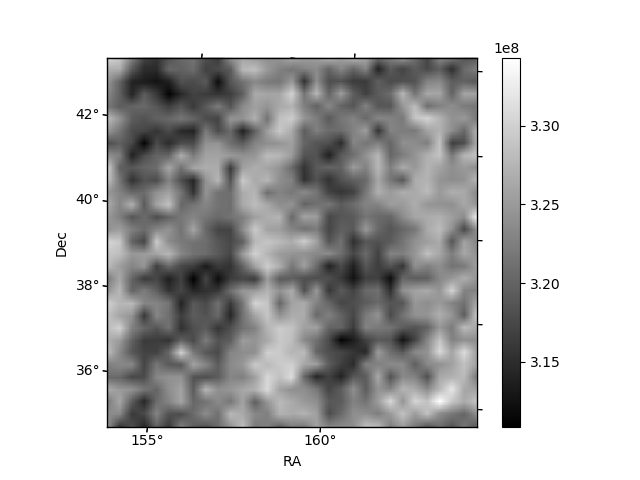
Histogram calculated using DETX and DETY for each event in the final _common_clean file
| Quadrant A | 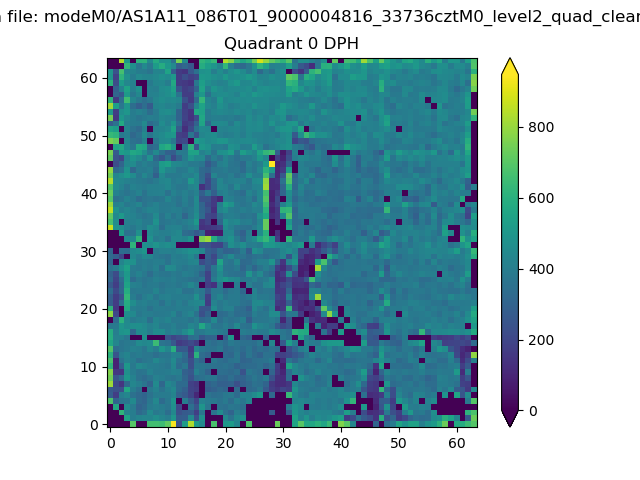 |
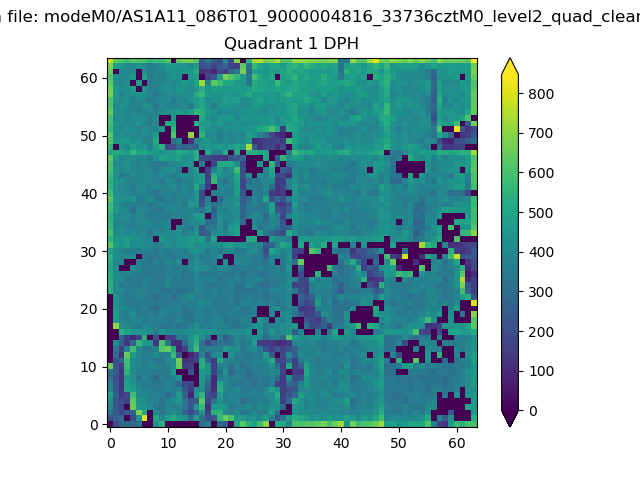 |
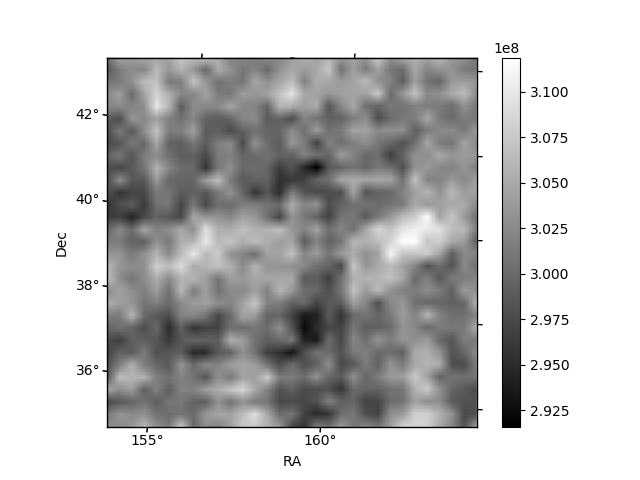
Quadrant B |
|---|---|---|---|
| Quadrant D | 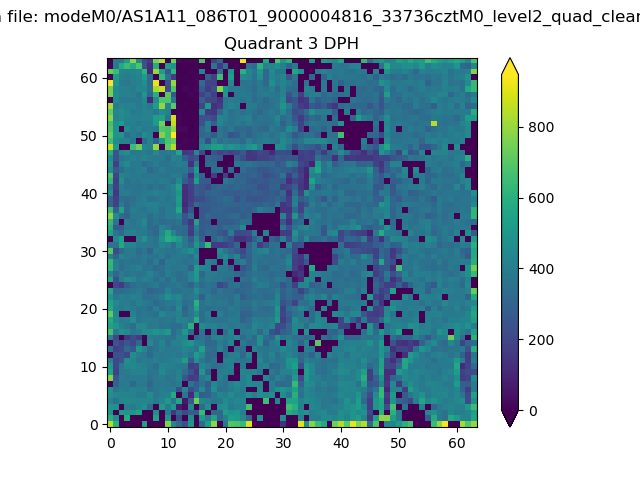 |
 |
Quadrant C |
| Plot type | Count rate plots | Images |
|---|---|---|
| Comparison with Poisson distribution Blue bars denote a histogram of data divided into 1 sec bins. Red curve is a Poisson curve with rate = median count rate of data. |
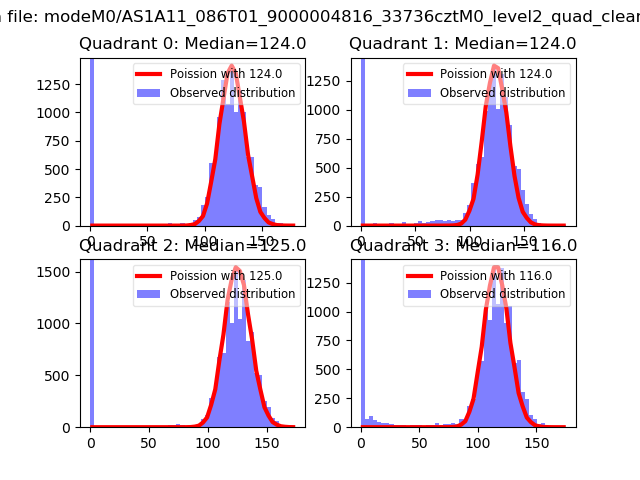 |
 |
| Quadrant-wise count rates Data is divided into 100 sec bins |
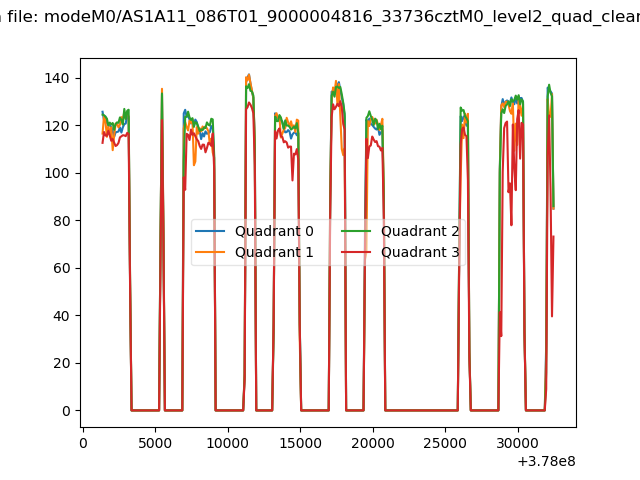 |
|
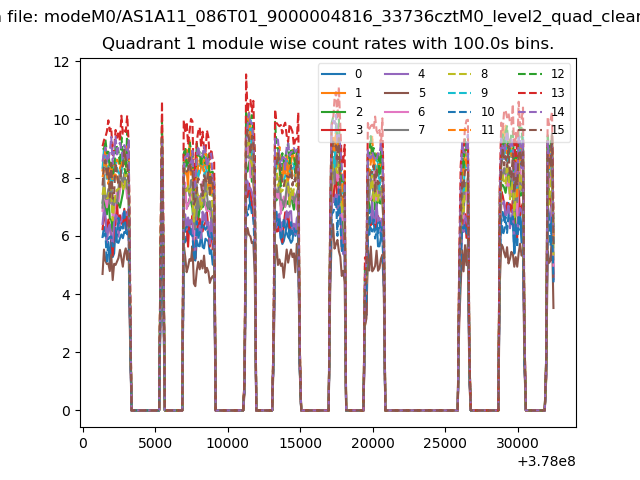
| Module-wise count rates for Quadrant A Data is divided into 100 sec bins |
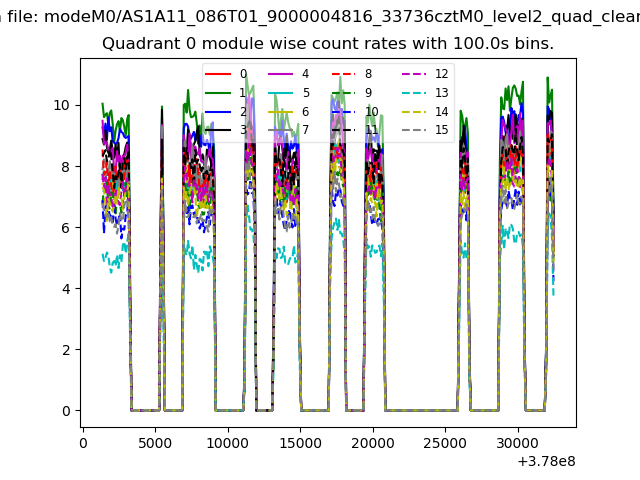 |
 |
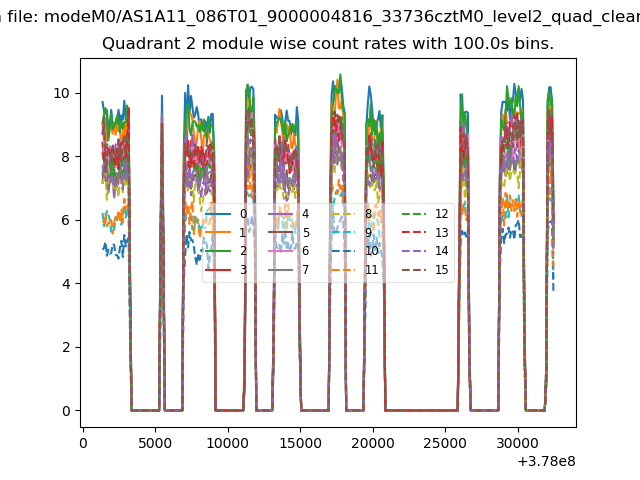
| Module-wise count rates for Quadrant B Data is divided into 100 sec bins |
 |
 |
| Module-wise count rates for Quadrant C Data is divided into 100 sec bins |
 |
 |
| Module-wise count rates for Quadrant D Data is divided into 100 sec bins |
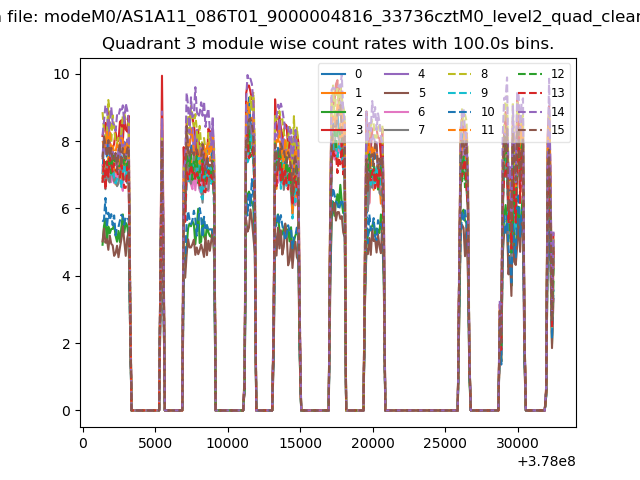 |
 |
| Parameter | Plot |
|---|---|
| CZT HV Monitor | 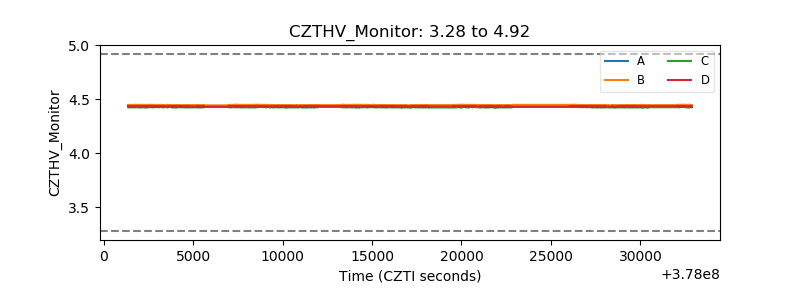 |
| D_VDD | 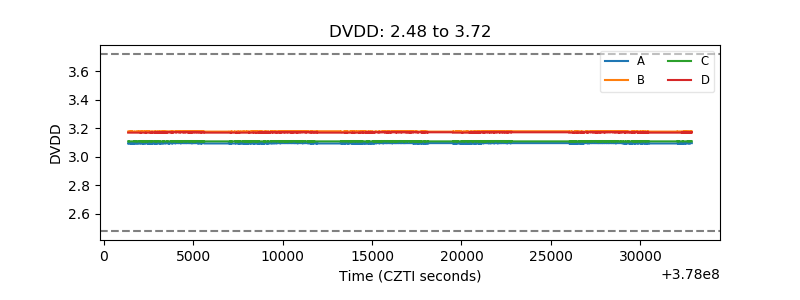 |
| Temperature 1 | 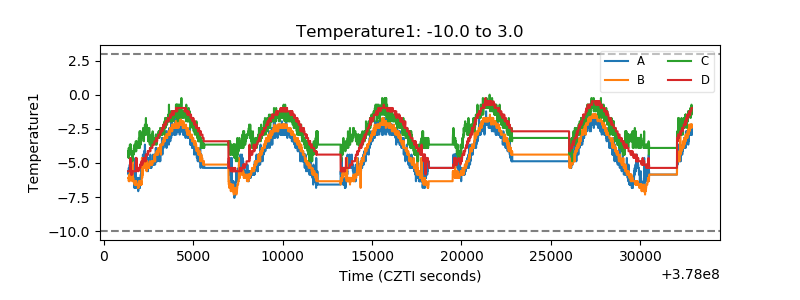 |
| Veto HV Monitor |  |
| Veto LLD | 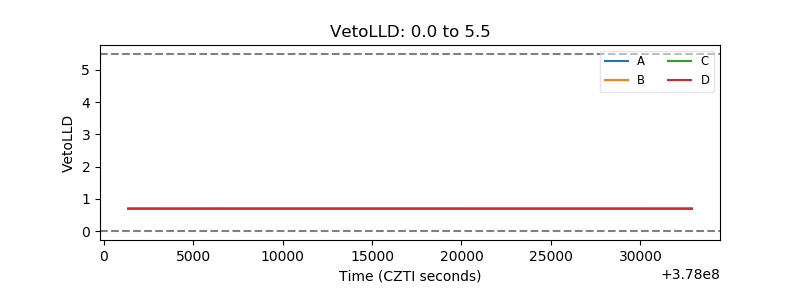 |
| Alpha Counter | 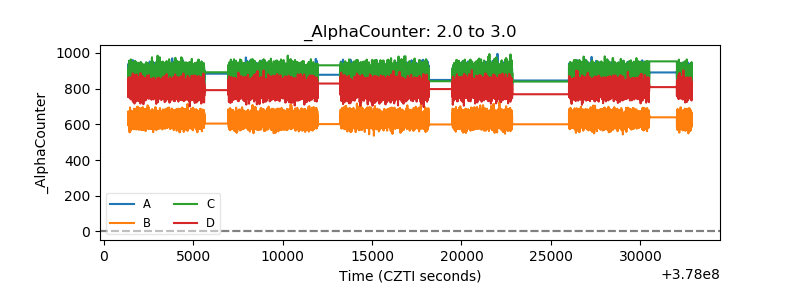 |
| _CPM_Rate | 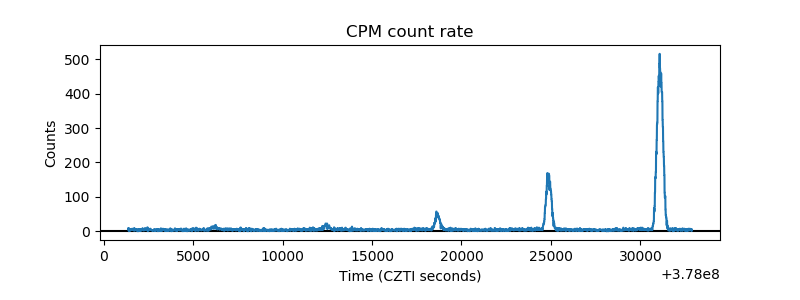 |
| CZT Counter | 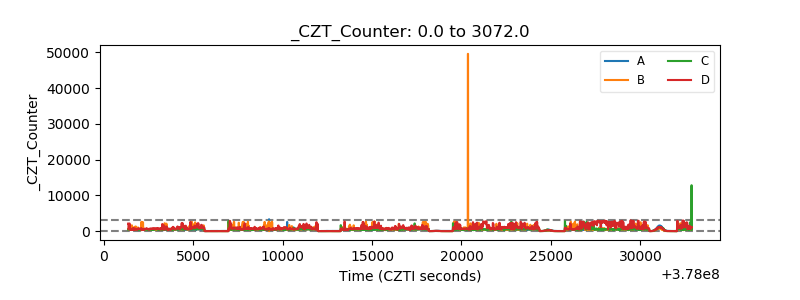 |
| +2.5 Volts monitor |  |
| +5 Volts monitor |  |
| _ROLL_ROT | 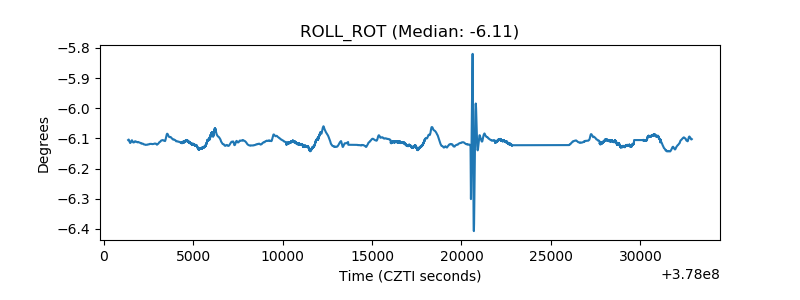 |
| _Roll_DEC | 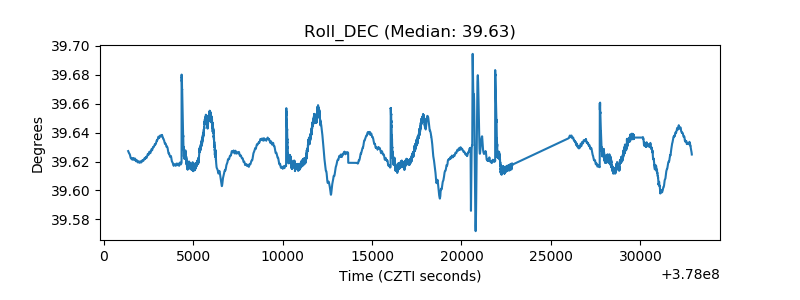 |
| _Roll_RA | 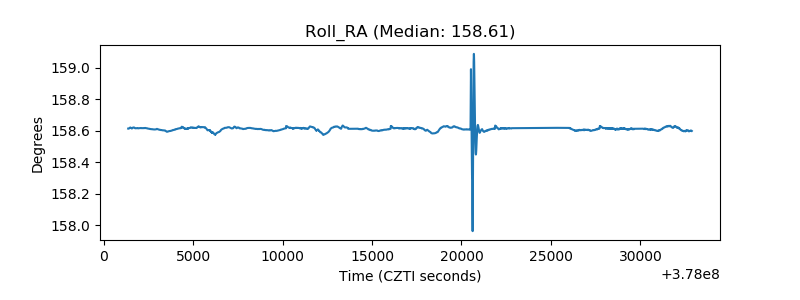 |
| Veto Counter | 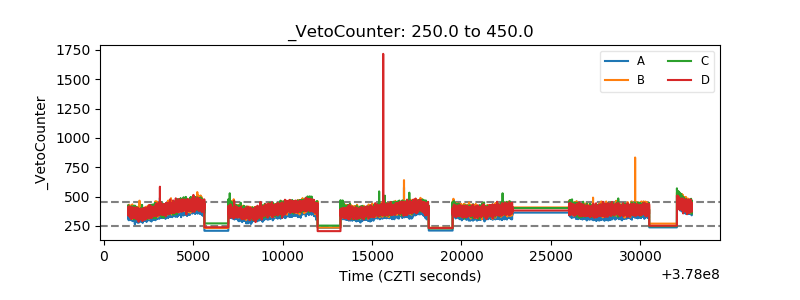 |