| Param | Original file | Final file |
|---|---|---|
| Filename | modeM0/AS1A11_086T01_9000004816_33739cztM0_level2.evt | modeM0/AS1A11_086T01_9000004816_33739cztM0_level2_quad_clean.evt |
| Size (bytes) | 498,746,880 | 52,824,960 |
| Size | 475.6 MB | 50.4 MB |
| Events in quadrant A | 2,771,947 | 314,572 |
| Events in quadrant B | 3,500,824 | 306,352 |
| Events in quadrant C | 3,120,000 | 310,198 |
| Events in quadrant D | 5,339,652 | 283,370 |
| Mode SS | |||
|---|---|---|---|
| Quadrant | BADHDUFLAG | Total packets | Discarded packets |
| A | 0 | 114 | 0 |
| B | 0 | 114 | 0 |
| C | 0 | 114 | 0 |
| D | 0 | 114 | 0 |
| Mode M9 | |||
|---|---|---|---|
| Quadrant | BADHDUFLAG | Total packets | Discarded packets |
| A | 0 | 23 | 0 |
| B | 0 | 23 | 0 |
| C | 0 | 23 | 0 |
| D | 0 | 24 | 0 |
| Mode M0 | |||
|---|---|---|---|
| Quadrant | BADHDUFLAG | Total packets | Discarded packets |
| A | 0 | 11630 | 3 |
| B | 0 | 13813 | 2 |
| C | 0 | 12428 | 2 |
| D | 0 | 19843 | 2 |
| Quadrant | Total seconds | Saturated seconds | Saturation percentage |
|---|---|---|---|
| A | 5488 | 27 | 0.491983% |
| B | 5488 | 172 | 3.134111% |
| C | 5488 | 51 | 0.929300% |
| D | 5488 | 269 | 4.901603% |
Noise dominated data is calculated using 1-second bins in cleaned event files. If a bin has >2000 counts, and if more than 50% of those come from <1% of pixels, then it is considered to be noise-dominated and hence unusable.
| Quadrant | # 1 sec bins | Bins with >0 counts | Bins with >2000 counts | High rate bins dominated by noise | Noise dominated (total time) | Noise dominated (detector-on time) | Marked lightcurve |
|---|---|---|---|---|---|---|---|
| A | 7311 | 5489 | 20 | 20 | 0.27% | 0.36% | 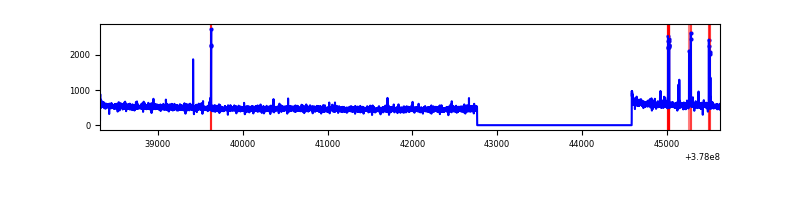 |
| B | 7311 | 5489 | 120 | 120 | 1.64% | 2.19% | 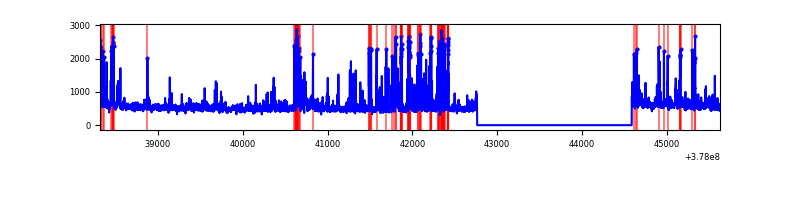 |
| C | 7311 | 5489 | 39 | 39 | 0.53% | 0.71% | 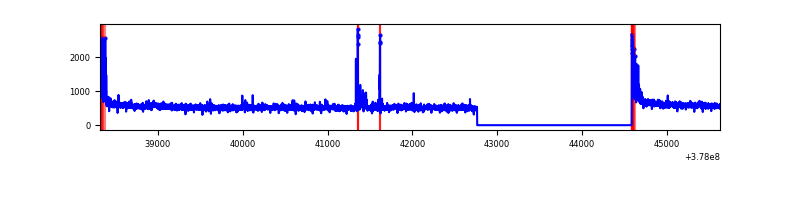 |
| D | 7311 | 5489 | 247 | 247 | 3.38% | 4.50% | 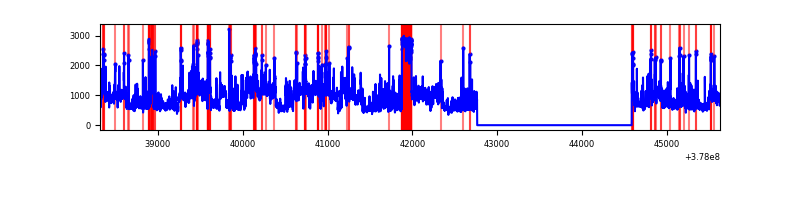 |
Top three noisy pixels from each quadrant. If the there are fewer than three noisy pixels in the level2.evt file, extra rows are filled as -1
| Pixel properties | Quadrant properties | ||||||
|---|---|---|---|---|---|---|---|
| Quadrant | DetID | PixID | Counts | Sigma | Mean | Median | Sigma |
| A | 14 | 4 | 80230 | 578.13 | 692 | 678 | 137.6 |
| A | 13 | 254 | 10143 | 68.79 | 692 | 678 | 137.6 |
| A | 10 | 83 | 9701 | 65.57 | 692 | 678 | 137.6 |
| B | 5 | 172 | 381111 | 2949.64 | 681 | 665 | 129.0 |
| B | 5 | 255 | 232475 | 1797.25 | 681 | 665 | 129.0 |
| B | 4 | 170 | 63755 | 489.14 | 681 | 665 | 129.0 |
| C | 15 | 214 | 239587 | 1557.33 | 673 | 676 | 153.4 |
| C | 0 | 10 | 138716 | 899.81 | 673 | 676 | 153.4 |
| C | 14 | 254 | 48471 | 311.55 | 673 | 676 | 153.4 |
| D | 8 | 195 | 1402204 | 8689.4 | 662 | 645 | 161.3 |
| D | 7 | 80 | 447692 | 2771.61 | 662 | 645 | 161.3 |
| D | 1 | 52 | 302366 | 1870.61 | 662 | 645 | 161.3 |
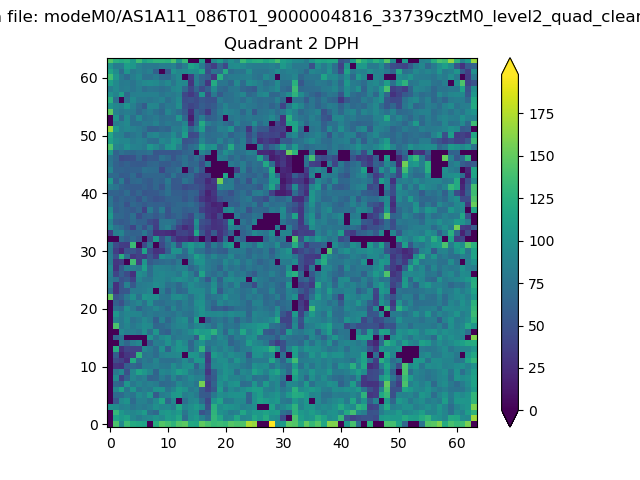
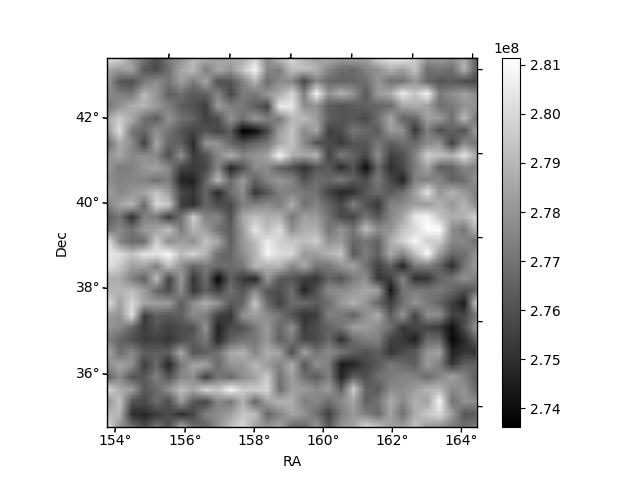
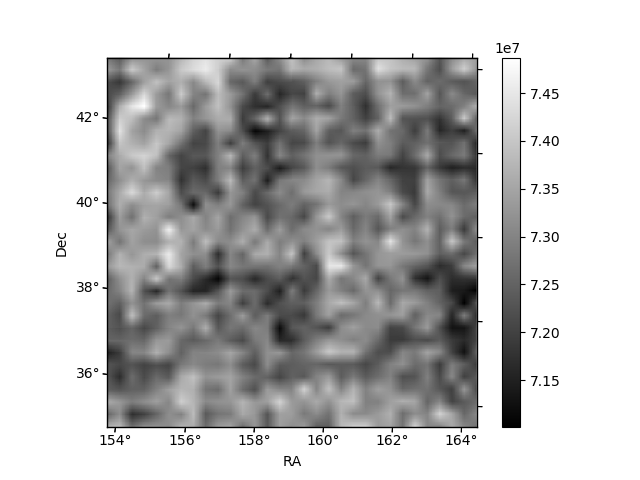
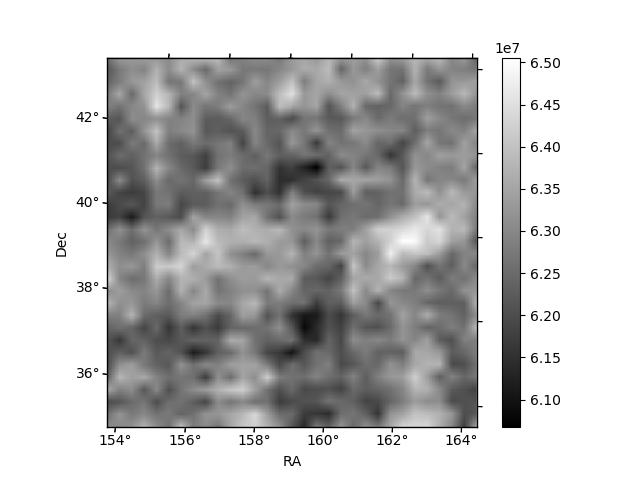
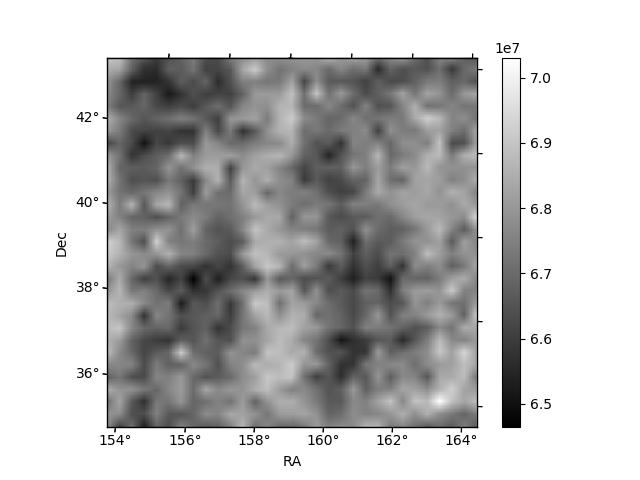
Histogram calculated using DETX and DETY for each event in the final _common_clean file
| Quadrant A | 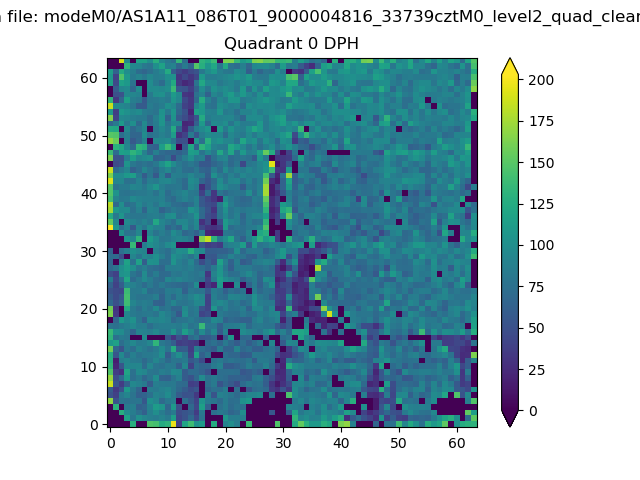 |
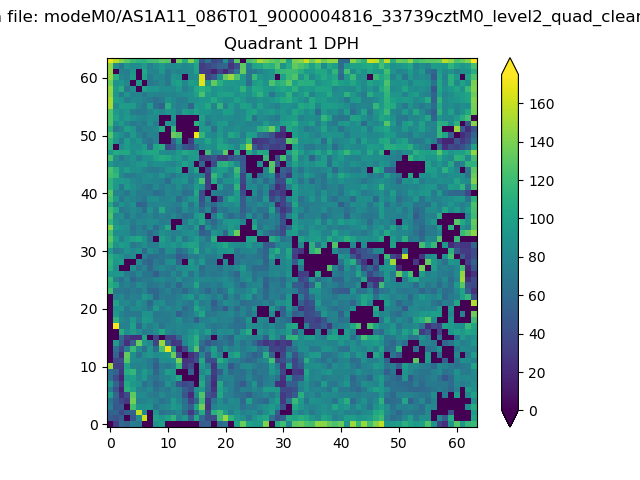 |
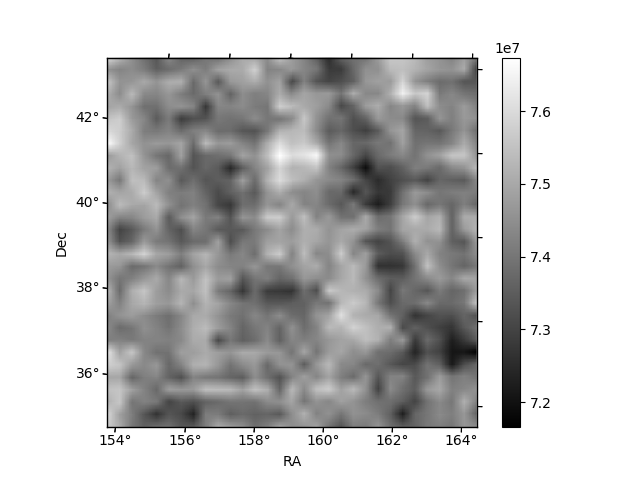
Quadrant B |
|---|---|---|---|
| Quadrant D | 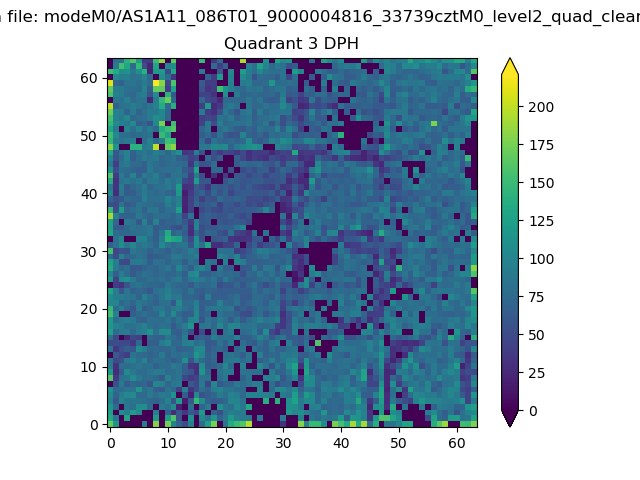 |
 |
Quadrant C |
| Plot type | Count rate plots | Images |
|---|---|---|
| Comparison with Poisson distribution Blue bars denote a histogram of data divided into 1 sec bins. Red curve is a Poisson curve with rate = median count rate of data. |
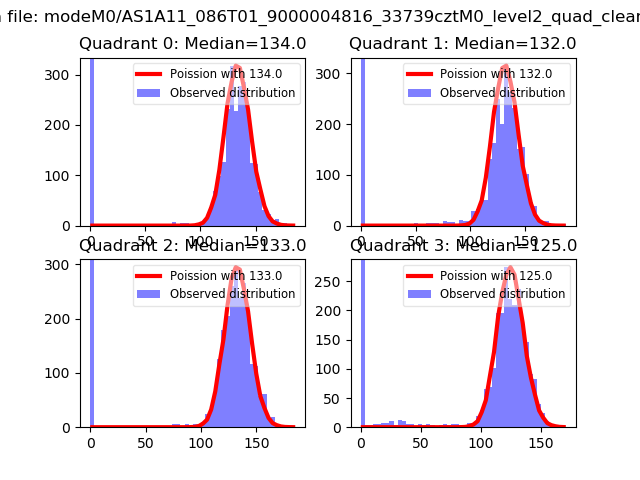 |
 |
| Quadrant-wise count rates Data is divided into 100 sec bins |
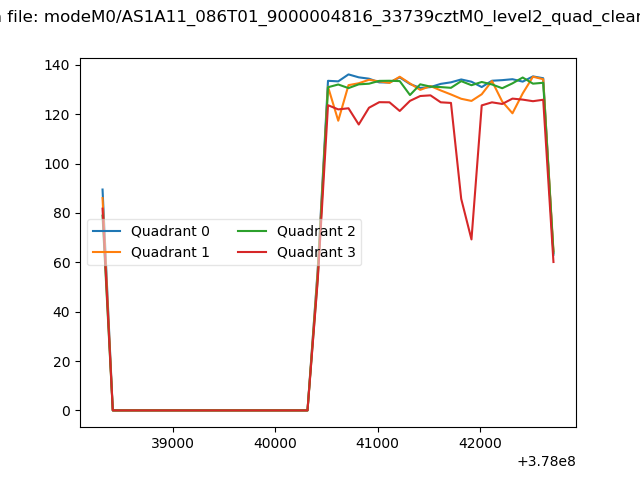 |
|
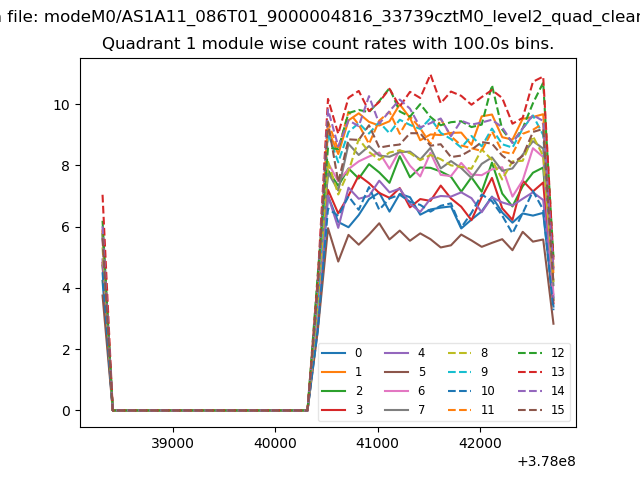
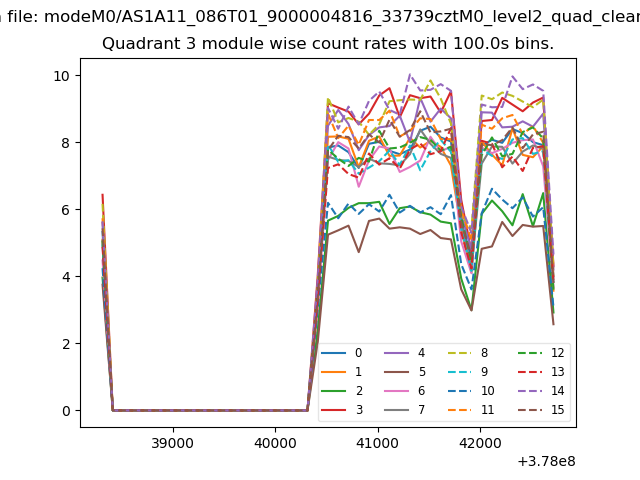
| Module-wise count rates for Quadrant A Data is divided into 100 sec bins |
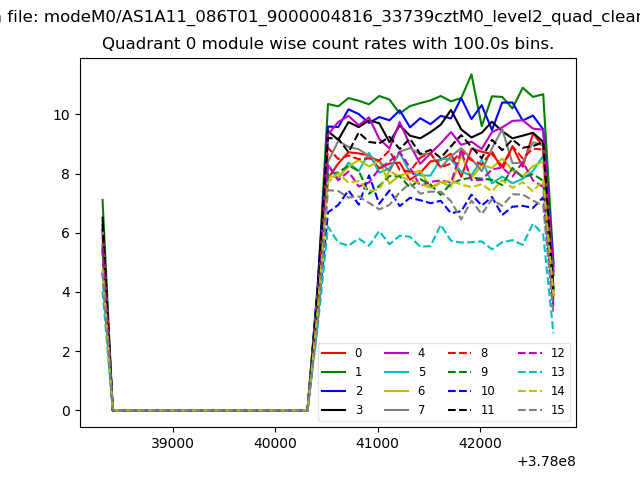 |
 |
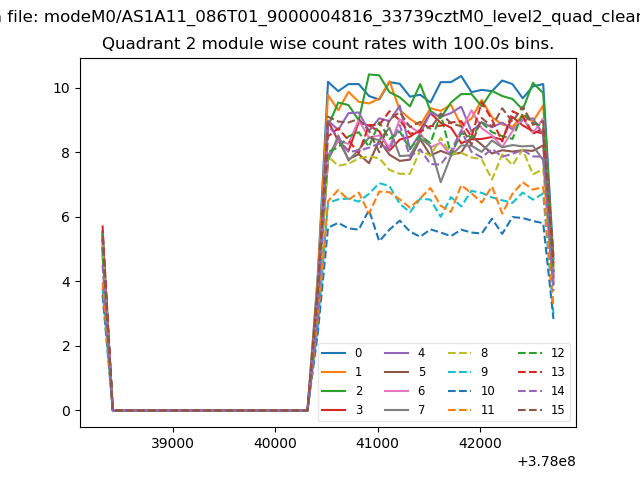
| Module-wise count rates for Quadrant B Data is divided into 100 sec bins |
 |
 |
| Module-wise count rates for Quadrant C Data is divided into 100 sec bins |
 |
 |
| Module-wise count rates for Quadrant D Data is divided into 100 sec bins |
 |
 |
| Parameter | Plot |
|---|---|
| CZT HV Monitor | 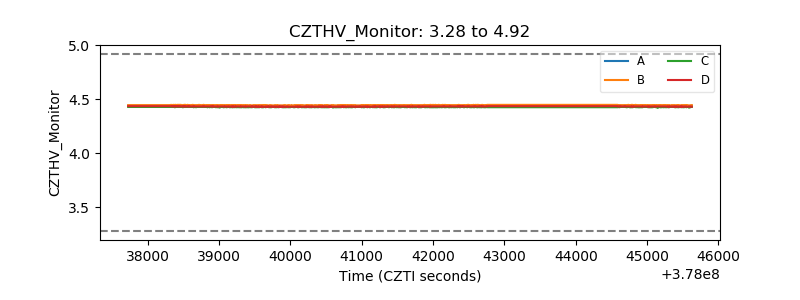 |
| D_VDD | 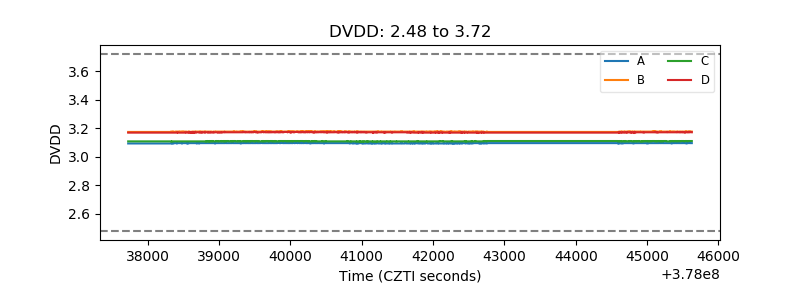 |
| Temperature 1 | 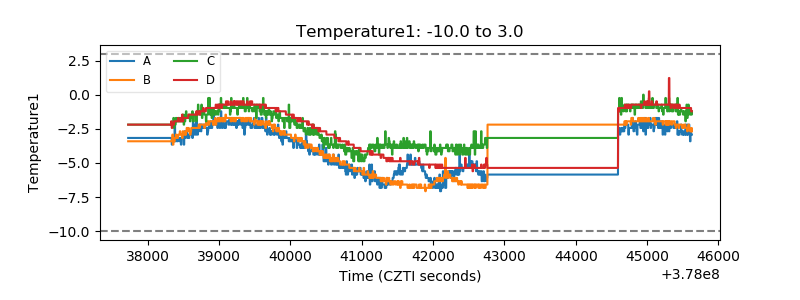 |
| Veto HV Monitor | 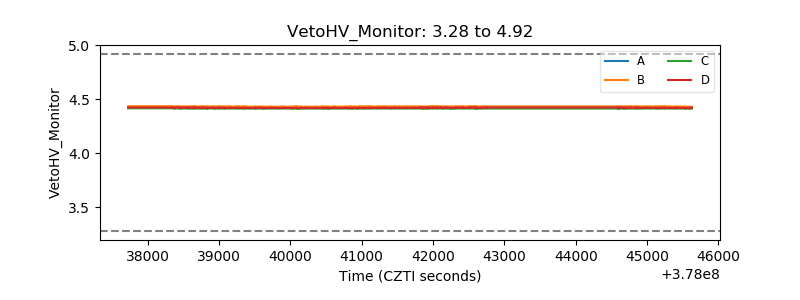 |
| Veto LLD | 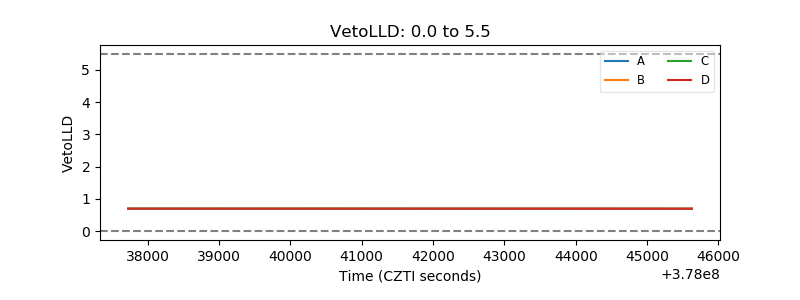 |
| Alpha Counter | 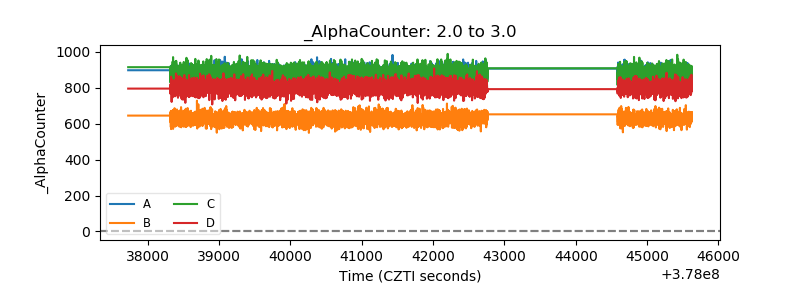 |
| _CPM_Rate | 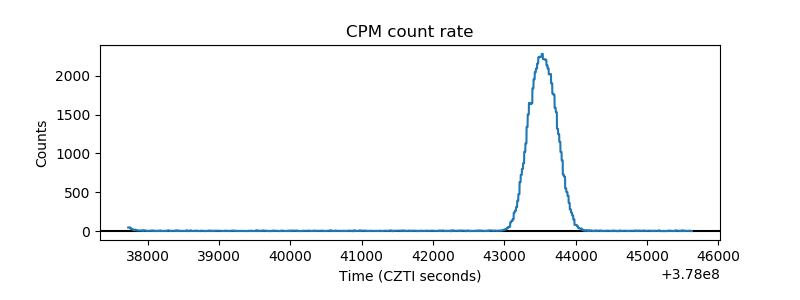 |
| CZT Counter | 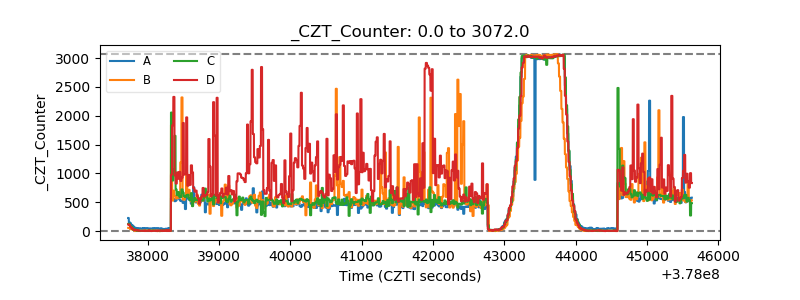 |
| +2.5 Volts monitor |  |
| +5 Volts monitor | 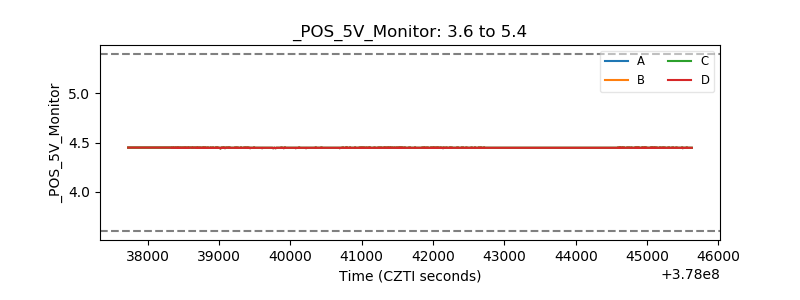 |
| _ROLL_ROT | 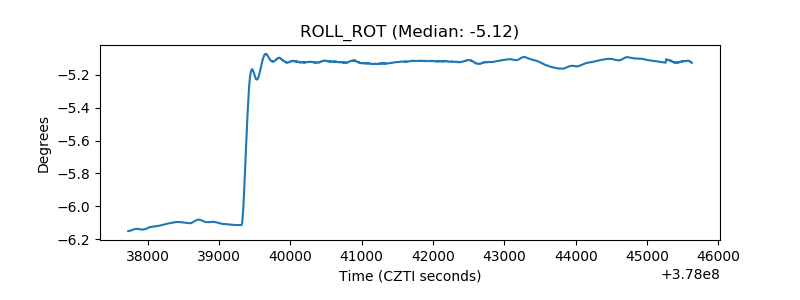 |
| _Roll_DEC |  |
| _Roll_RA | 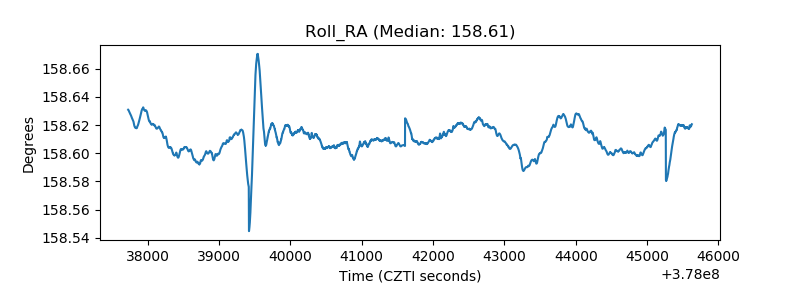 |
| Veto Counter |  |