| Param | Original file | Final file |
|---|---|---|
| Filename | modeM0/AS1A11_086T01_9000004816_33741cztM0_level2.evt | modeM0/AS1A11_086T01_9000004816_33741cztM0_level2_quad_clean.evt |
| Size (bytes) | 517,835,520 | 66,899,520 |
| Size | 493.8 MB | 63.8 MB |
| Events in quadrant A | 2,782,621 | 431,070 |
| Events in quadrant B | 3,878,373 | 419,858 |
| Events in quadrant C | 3,184,009 | 432,081 |
| Events in quadrant D | 5,492,252 | 384,712 |
| Mode SS | |||
|---|---|---|---|
| Quadrant | BADHDUFLAG | Total packets | Discarded packets |
| A | 0 | 102 | 0 |
| B | 0 | 102 | 0 |
| C | 0 | 102 | 0 |
| D | 0 | 102 | 0 |
| Mode M9 | |||
|---|---|---|---|
| Quadrant | BADHDUFLAG | Total packets | Discarded packets |
| A | 0 | 28 | 0 |
| B | 0 | 28 | 0 |
| C | 0 | 28 | 0 |
| D | 0 | 29 | 0 |
| Mode M0 | |||
|---|---|---|---|
| Quadrant | BADHDUFLAG | Total packets | Discarded packets |
| A | 0 | 11538 | 2 |
| B | 0 | 15037 | 1 |
| C | 0 | 12715 | 1 |
| D | 0 | 19804 | 1 |
| Quadrant | Total seconds | Saturated seconds | Saturation percentage |
|---|---|---|---|
| A | 5110 | 44 | 0.861057% |
| B | 5110 | 276 | 5.401174% |
| C | 5110 | 104 | 2.035225% |
| D | 5110 | 613 | 11.996086% |
Noise dominated data is calculated using 1-second bins in cleaned event files. If a bin has >2000 counts, and if more than 50% of those come from <1% of pixels, then it is considered to be noise-dominated and hence unusable.
| Quadrant | # 1 sec bins | Bins with >0 counts | Bins with >2000 counts | High rate bins dominated by noise | Noise dominated (total time) | Noise dominated (detector-on time) | Marked lightcurve |
|---|---|---|---|---|---|---|---|
| A | 7142 | 5111 | 28 | 28 | 0.39% | 0.55% | 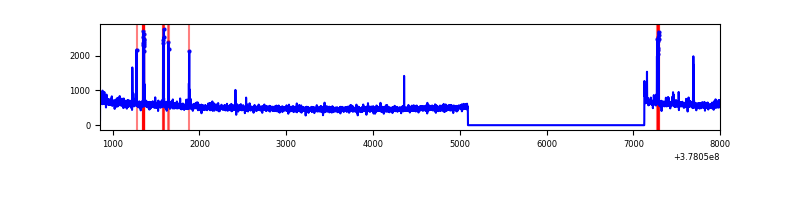 |
| B | 7142 | 5111 | 224 | 224 | 3.14% | 4.38% | 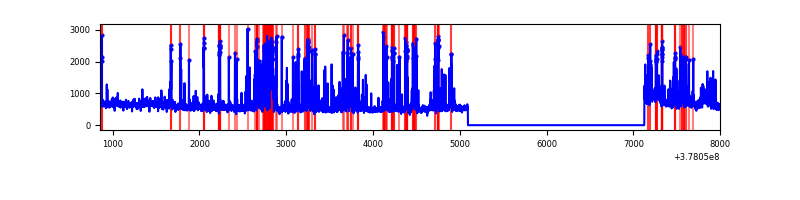 |
| C | 7142 | 5111 | 75 | 75 | 1.05% | 1.47% | 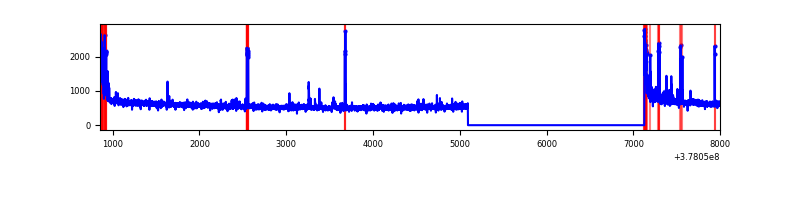 |
| D | 7142 | 5111 | 590 | 590 | 8.26% | 11.54% | 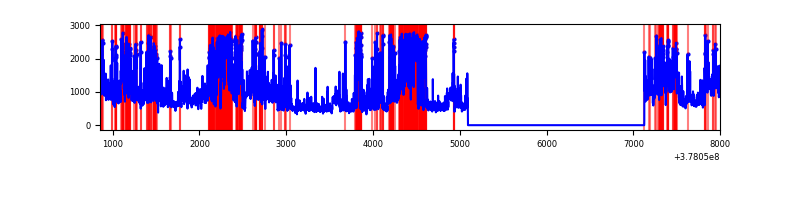 |
Top three noisy pixels from each quadrant. If the there are fewer than three noisy pixels in the level2.evt file, extra rows are filled as -1
| Pixel properties | Quadrant properties | ||||||
|---|---|---|---|---|---|---|---|
| Quadrant | DetID | PixID | Counts | Sigma | Mean | Median | Sigma |
| A | 14 | 4 | 97237 | 715.08 | 686 | 676 | 135.0 |
| A | 15 | 169 | 14179 | 100.0 | 686 | 676 | 135.0 |
| A | 10 | 83 | 10561 | 73.2 | 686 | 676 | 135.0 |
| B | 5 | 172 | 776753 | 6236.53 | 673 | 657 | 124.4 |
| B | 5 | 255 | 128013 | 1023.4 | 673 | 657 | 124.4 |
| B | 12 | 1 | 61517 | 489.06 | 673 | 657 | 124.4 |
| C | 15 | 214 | 223625 | 1443.82 | 676 | 683 | 154.4 |
| C | 0 | 10 | 191207 | 1233.88 | 676 | 683 | 154.4 |
| C | 9 | 187 | 91298 | 586.84 | 676 | 683 | 154.4 |
| D | 2 | 250 | 1228075 | 7725.96 | 649 | 633 | 158.9 |
| D | 8 | 195 | 858864 | 5402.01 | 649 | 633 | 158.9 |
| D | 1 | 47 | 244807 | 1536.92 | 649 | 633 | 158.9 |
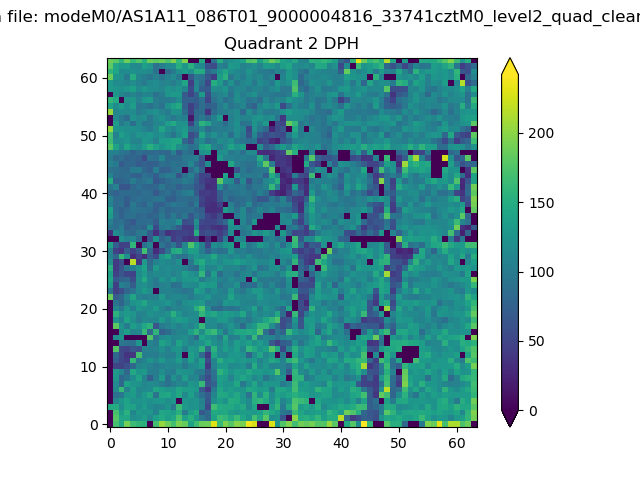
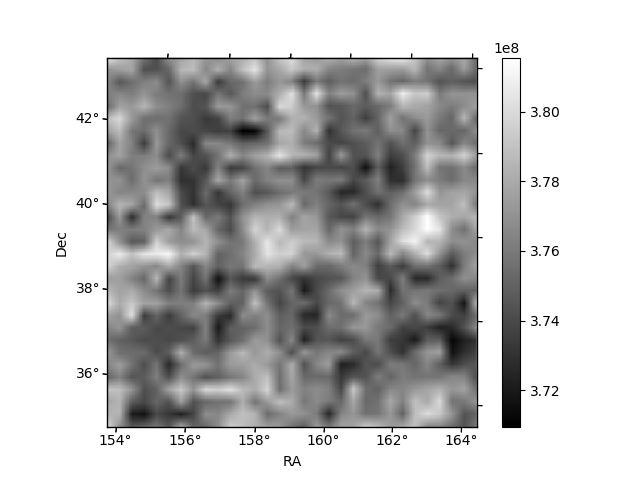
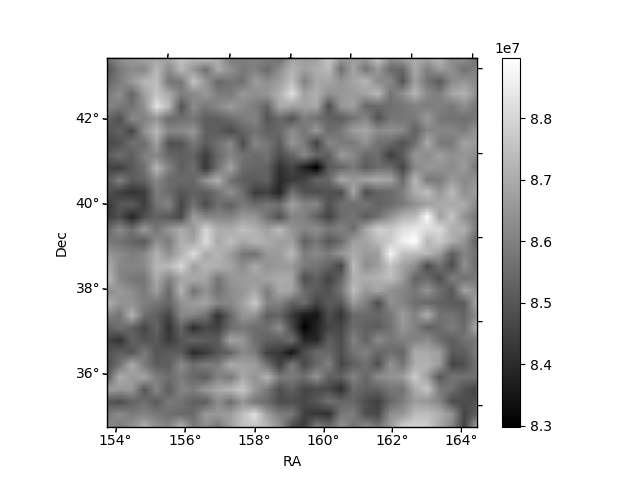
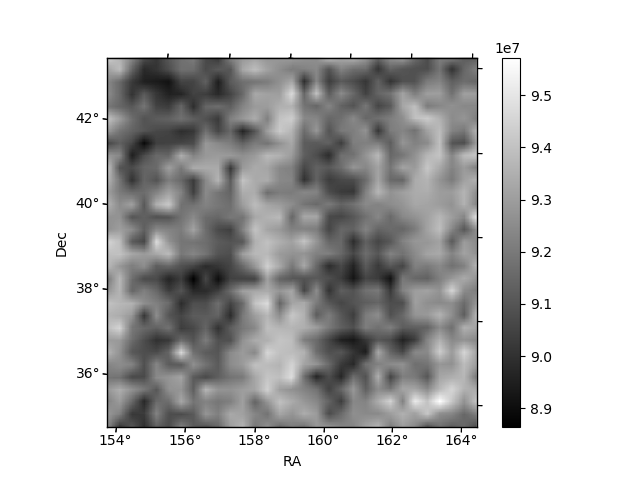
Histogram calculated using DETX and DETY for each event in the final _common_clean file
| Quadrant A | 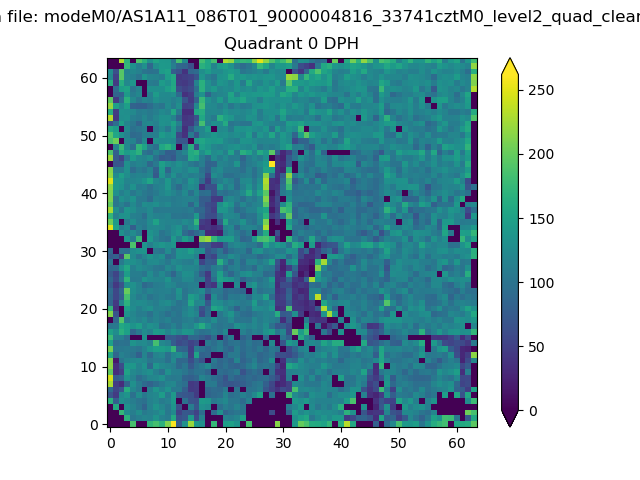 |
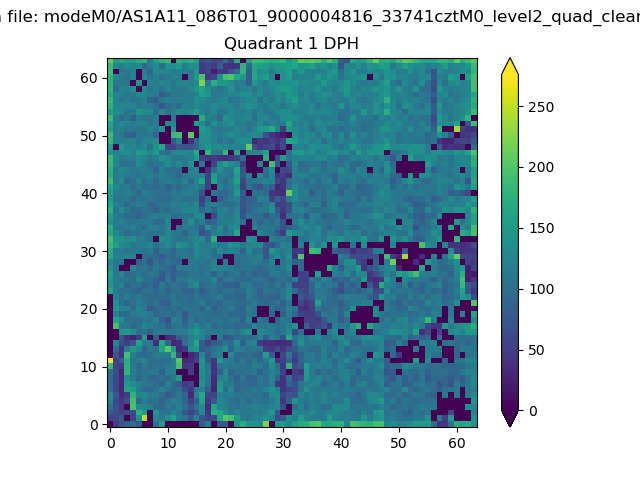 |
Quadrant B |
|---|---|---|---|
| Quadrant D | 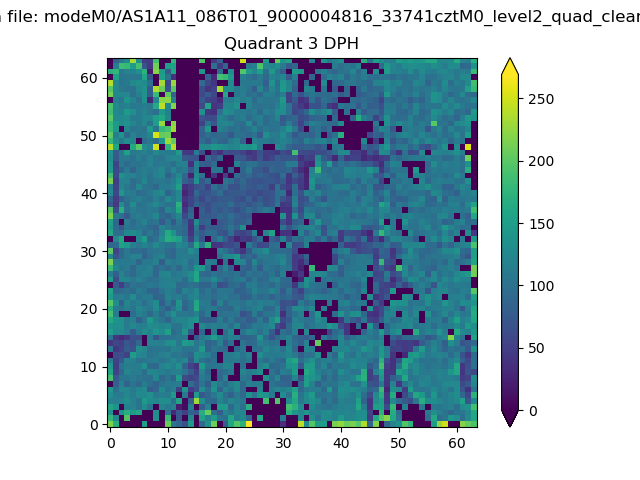 |
 |
Quadrant C |
| Plot type | Count rate plots | Images |
|---|---|---|
| Comparison with Poisson distribution Blue bars denote a histogram of data divided into 1 sec bins. Red curve is a Poisson curve with rate = median count rate of data. |
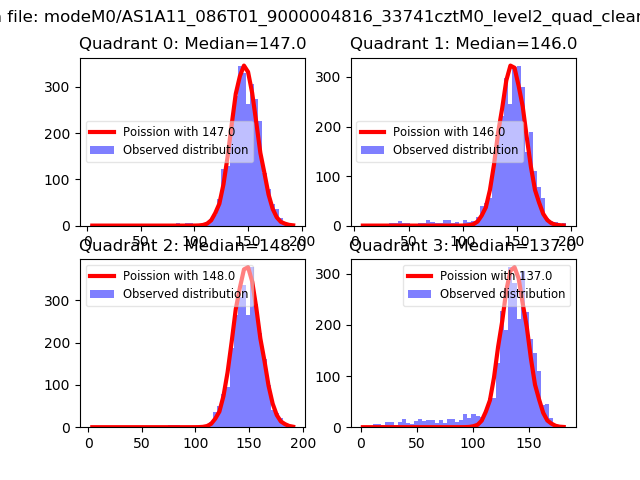 |
 |
| Quadrant-wise count rates Data is divided into 100 sec bins |
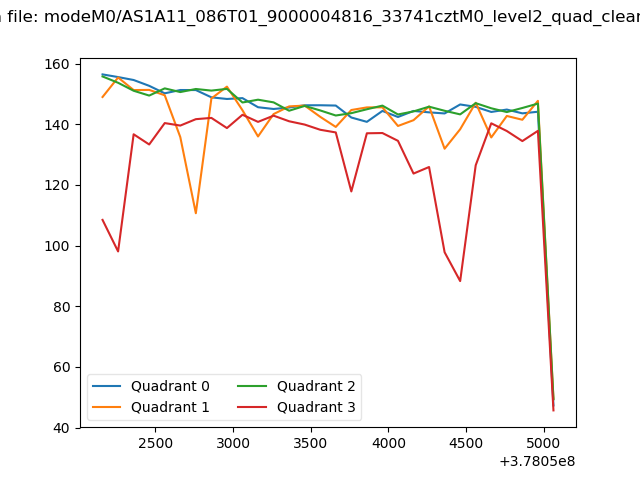 |
|
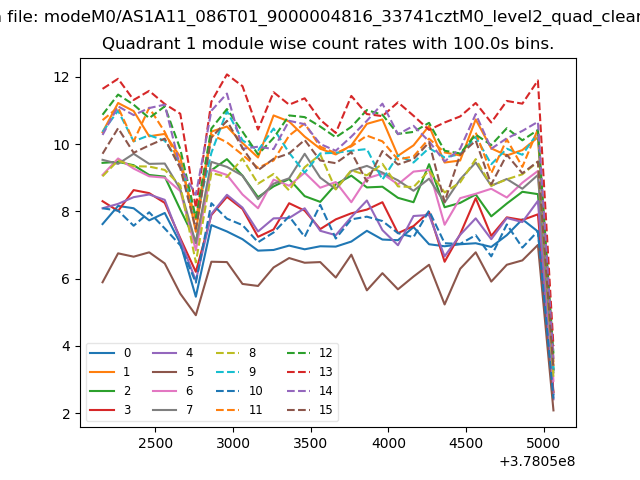
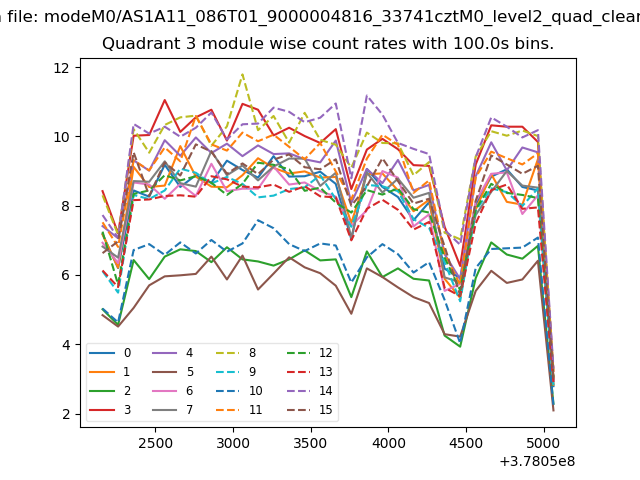
| Module-wise count rates for Quadrant A Data is divided into 100 sec bins |
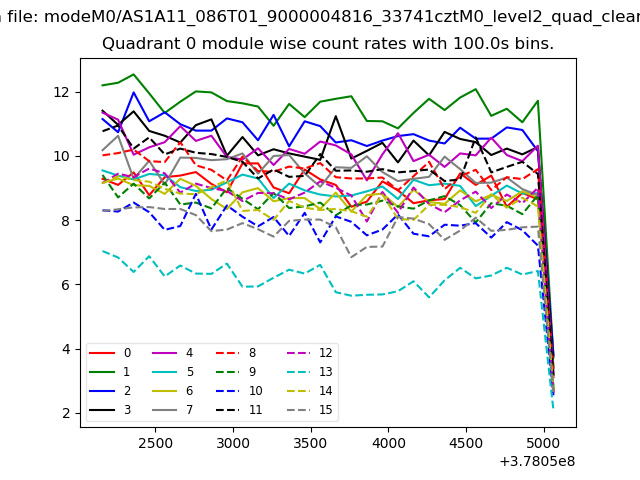 |
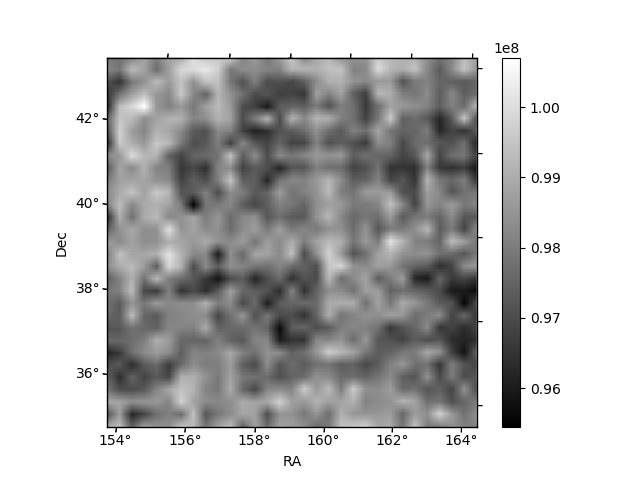 |
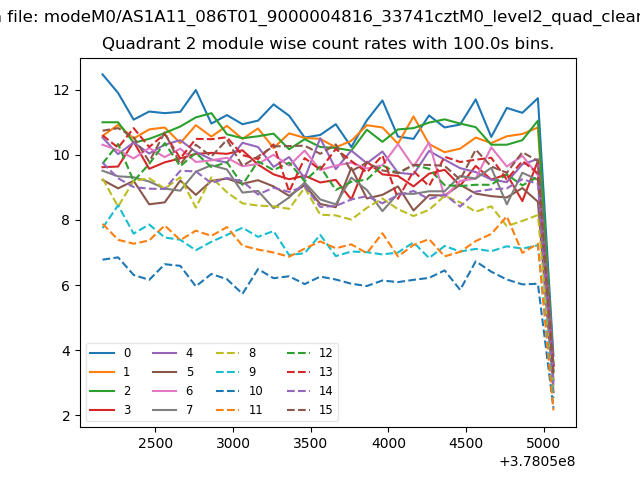
| Module-wise count rates for Quadrant B Data is divided into 100 sec bins |
 |
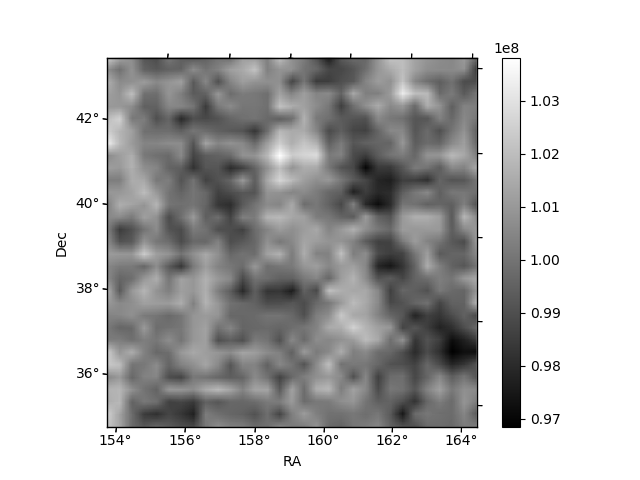 |
| Module-wise count rates for Quadrant C Data is divided into 100 sec bins |
 |
 |
| Module-wise count rates for Quadrant D Data is divided into 100 sec bins |
 |
 |
| Parameter | Plot |
|---|---|
| CZT HV Monitor | 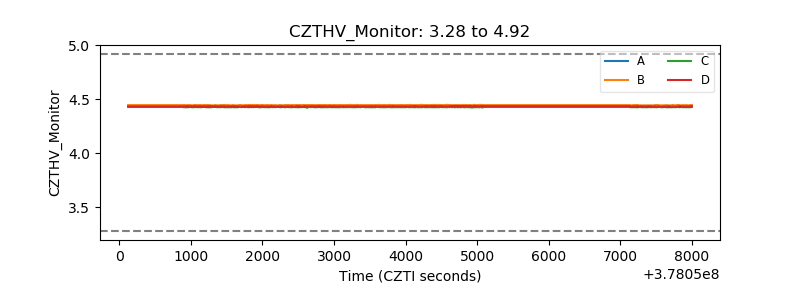 |
| D_VDD | 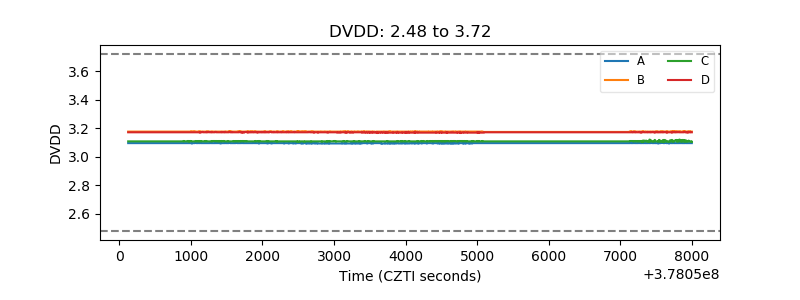 |
| Temperature 1 | 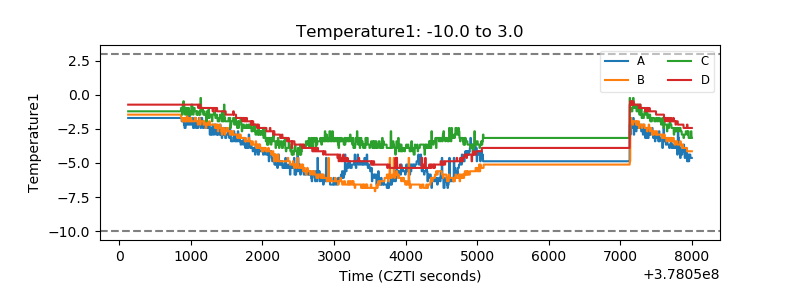 |
| Veto HV Monitor |  |
| Veto LLD | 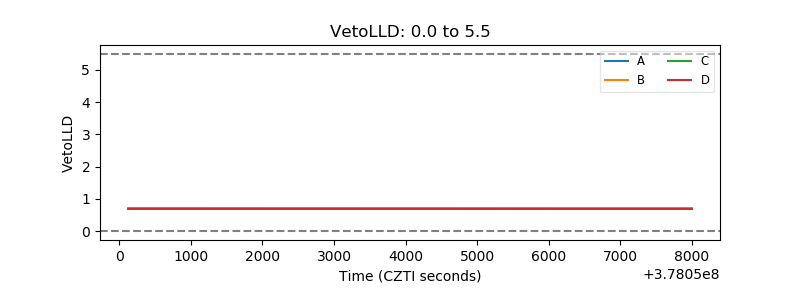 |
| Alpha Counter | 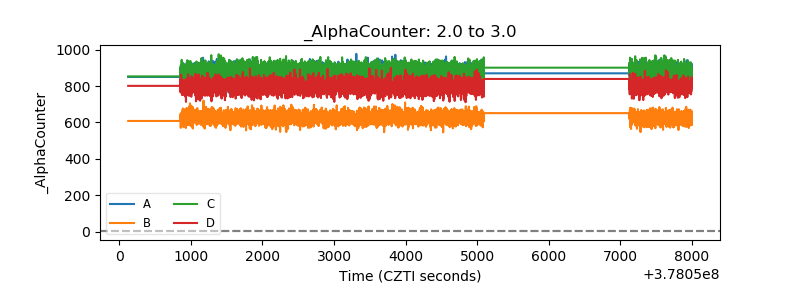 |
| _CPM_Rate | 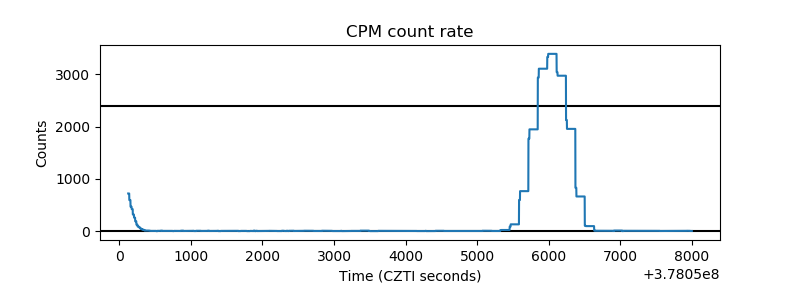 |
| CZT Counter | 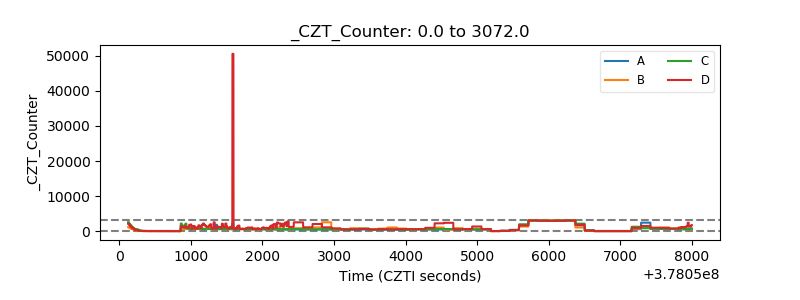 |
| +2.5 Volts monitor |  |
| +5 Volts monitor |  |
| _ROLL_ROT | 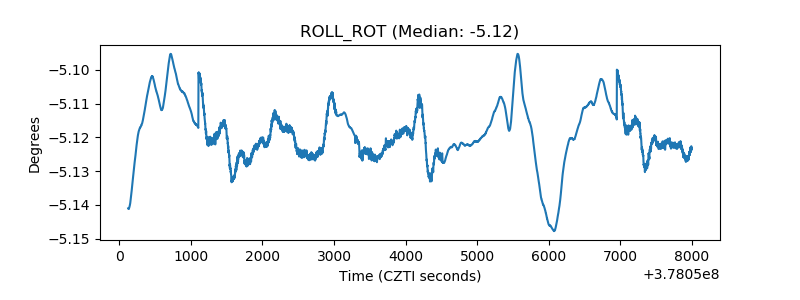 |
| _Roll_DEC | 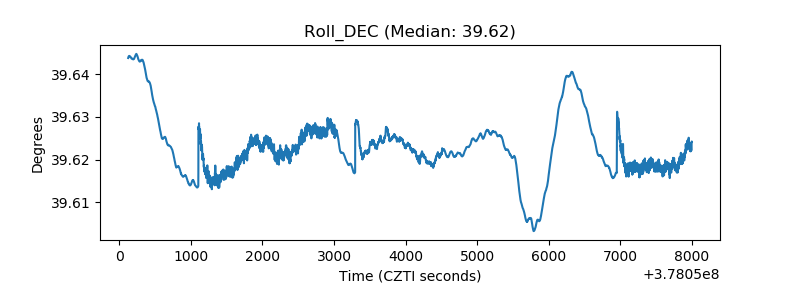 |
| _Roll_RA | 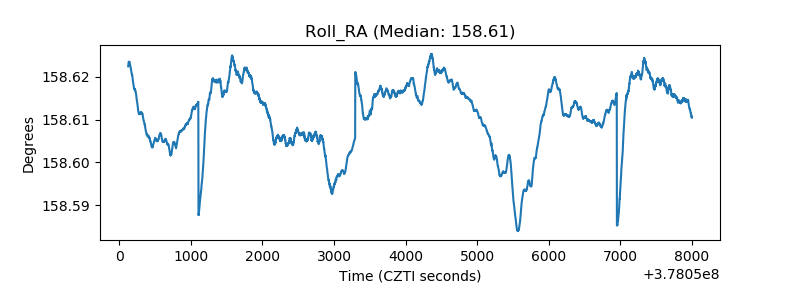 |
| Veto Counter | 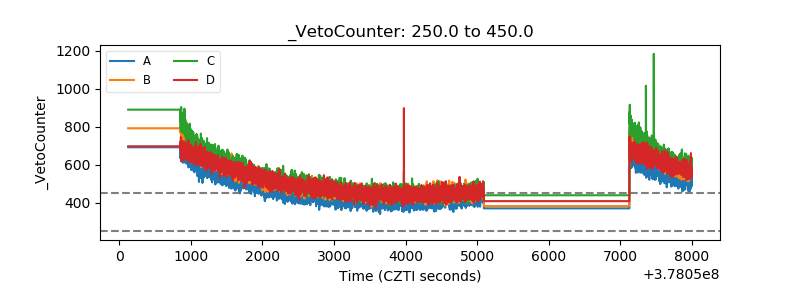 |