| Param | Original file | Final file |
|---|---|---|
| Filename | modeM0/AS1A11_086T01_9000004816_33742cztM0_level2.evt | modeM0/AS1A11_086T01_9000004816_33742cztM0_level2_quad_clean.evt |
| Size (bytes) | 499,734,720 | 79,741,440 |
| Size | 476.6 MB | 76.0 MB |
| Events in quadrant A | 2,638,580 | 528,306 |
| Events in quadrant B | 4,028,124 | 512,675 |
| Events in quadrant C | 3,073,398 | 538,244 |
| Events in quadrant D | 5,066,047 | 494,899 |
| Mode SS | |||
|---|---|---|---|
| Quadrant | BADHDUFLAG | Total packets | Discarded packets |
| A | 0 | 98 | 0 |
| B | 0 | 98 | 0 |
| C | 0 | 98 | 0 |
| D | 0 | 98 | 0 |
| Mode M9 | |||
|---|---|---|---|
| Quadrant | BADHDUFLAG | Total packets | Discarded packets |
| A | 0 | 22 | 0 |
| B | 0 | 22 | 0 |
| C | 0 | 22 | 0 |
| D | 0 | 23 | 0 |
| Mode M0 | |||
|---|---|---|---|
| Quadrant | BADHDUFLAG | Total packets | Discarded packets |
| A | 0 | 10889 | 2 |
| B | 0 | 15168 | 1 |
| C | 0 | 12224 | 1 |
| D | 0 | 18511 | 1 |
| Quadrant | Total seconds | Saturated seconds | Saturation percentage |
|---|---|---|---|
| A | 4856 | 38 | 0.782537% |
| B | 4856 | 388 | 7.990115% |
| C | 4856 | 120 | 2.471170% |
| D | 4856 | 282 | 5.807249% |
Noise dominated data is calculated using 1-second bins in cleaned event files. If a bin has >2000 counts, and if more than 50% of those come from <1% of pixels, then it is considered to be noise-dominated and hence unusable.
| Quadrant | # 1 sec bins | Bins with >0 counts | Bins with >2000 counts | High rate bins dominated by noise | Noise dominated (total time) | Noise dominated (detector-on time) | Marked lightcurve |
|---|---|---|---|---|---|---|---|
| A | 6979 | 4857 | 21 | 21 | 0.30% | 0.43% | 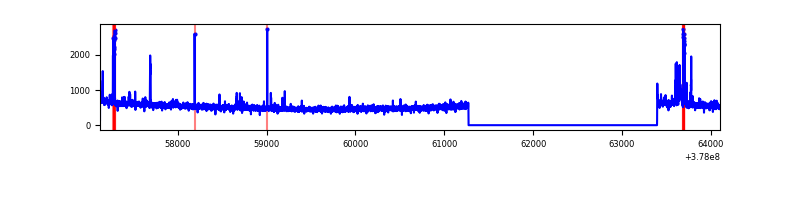 |
| B | 6979 | 4857 | 322 | 322 | 4.61% | 6.63% | 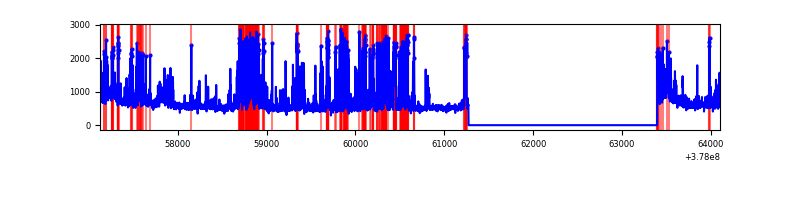 |
| C | 6979 | 4857 | 96 | 96 | 1.38% | 1.98% | 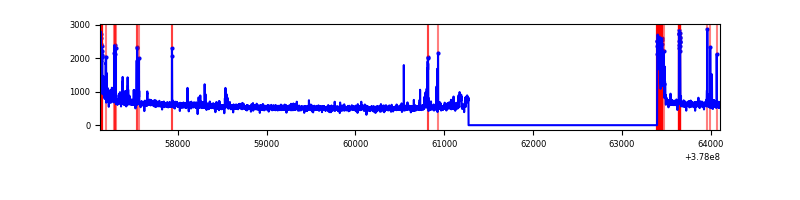 |
| D | 6979 | 4857 | 287 | 287 | 4.11% | 5.91% | 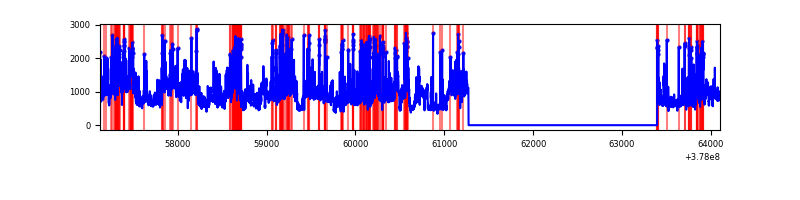 |
Top three noisy pixels from each quadrant. If the there are fewer than three noisy pixels in the level2.evt file, extra rows are filled as -1
| Pixel properties | Quadrant properties | ||||||
|---|---|---|---|---|---|---|---|
| Quadrant | DetID | PixID | Counts | Sigma | Mean | Median | Sigma |
| A | 14 | 4 | 69529 | 549.46 | 639 | 629 | 125.4 |
| A | 15 | 237 | 53736 | 423.52 | 639 | 629 | 125.4 |
| A | 15 | 169 | 23311 | 180.88 | 639 | 629 | 125.4 |
| B | 5 | 172 | 1249718 | 10830.79 | 623 | 609 | 115.3 |
| B | 0 | 213 | 59496 | 510.6 | 623 | 609 | 115.3 |
| B | 12 | 1 | 58548 | 502.38 | 623 | 609 | 115.3 |
| C | 0 | 10 | 214025 | 1477.12 | 632 | 640 | 144.5 |
| C | 15 | 214 | 211761 | 1461.45 | 632 | 640 | 144.5 |
| C | 9 | 187 | 153453 | 1057.82 | 632 | 640 | 144.5 |
| D | 8 | 195 | 1325139 | 7971.45 | 617 | 609 | 166.2 |
| D | 2 | 250 | 313662 | 1884.05 | 617 | 609 | 166.2 |
| D | 1 | 47 | 254595 | 1528.57 | 617 | 609 | 166.2 |
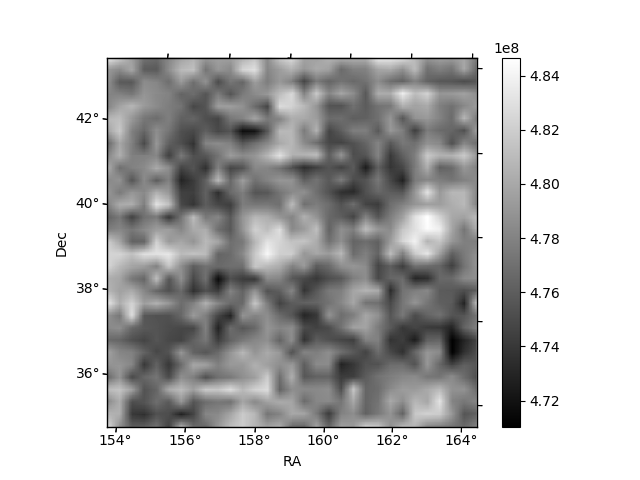
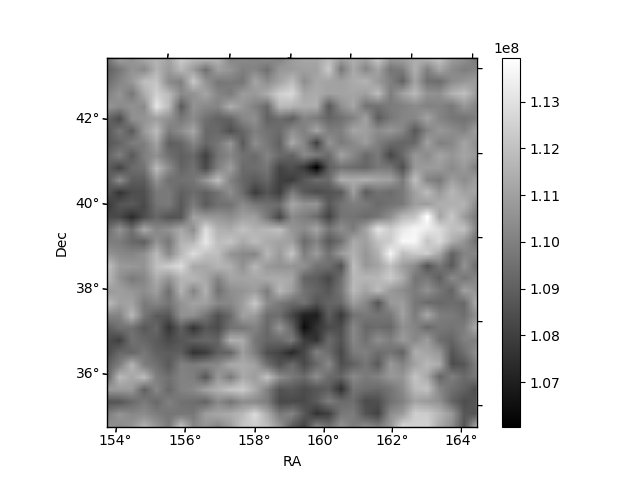
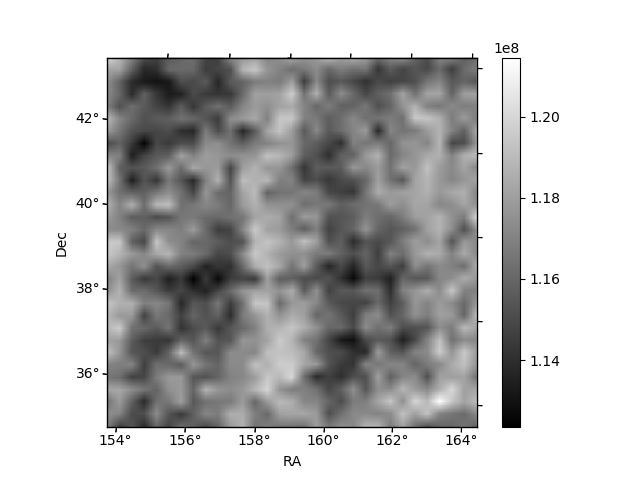
Histogram calculated using DETX and DETY for each event in the final _common_clean file
| Quadrant A | 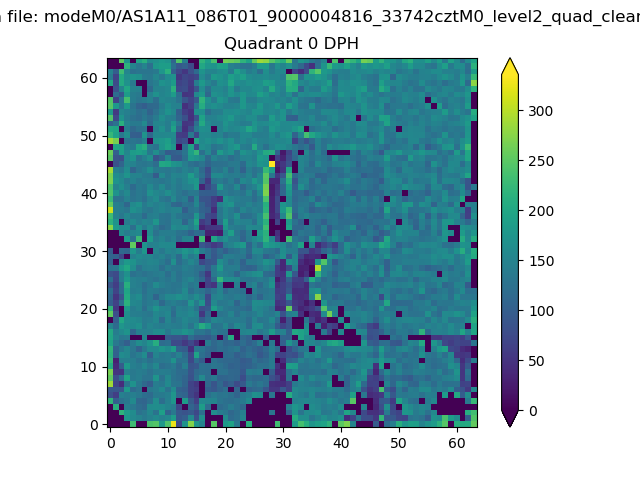 |
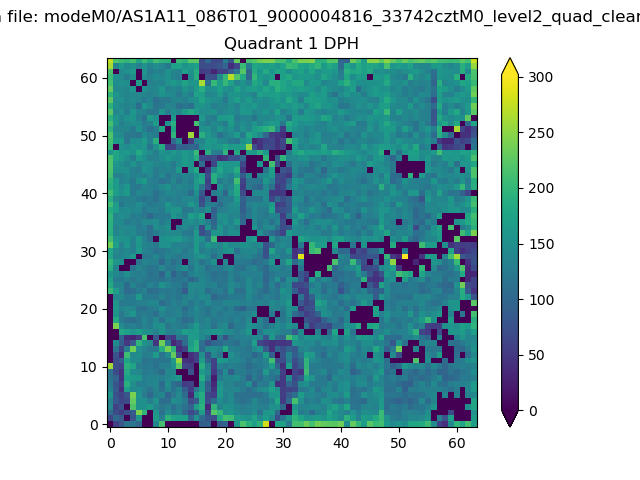 |
Quadrant B |
|---|---|---|---|
| Quadrant D | 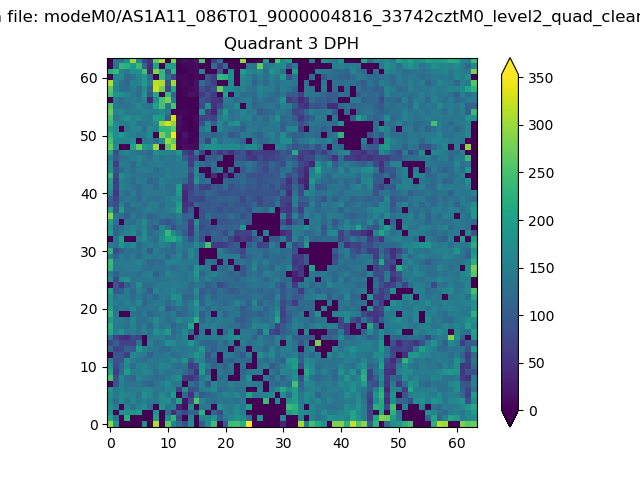 |
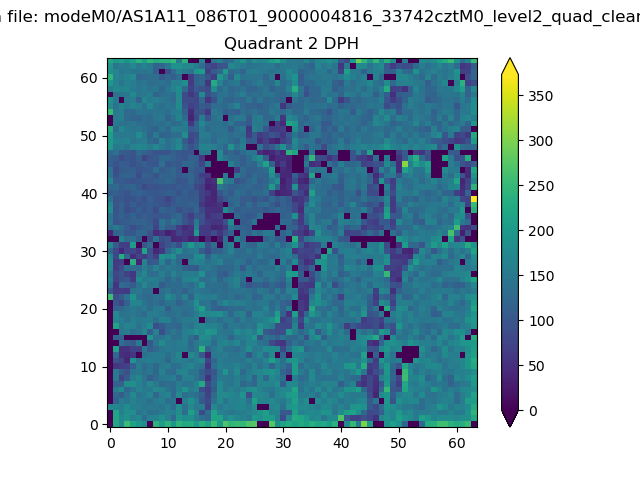 |
Quadrant C |
| Plot type | Count rate plots | Images |
|---|---|---|
| Comparison with Poisson distribution Blue bars denote a histogram of data divided into 1 sec bins. Red curve is a Poisson curve with rate = median count rate of data. |
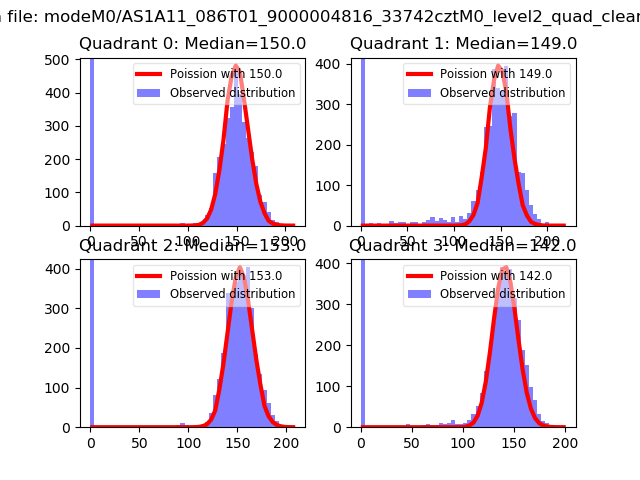 |
 |
| Quadrant-wise count rates Data is divided into 100 sec bins |
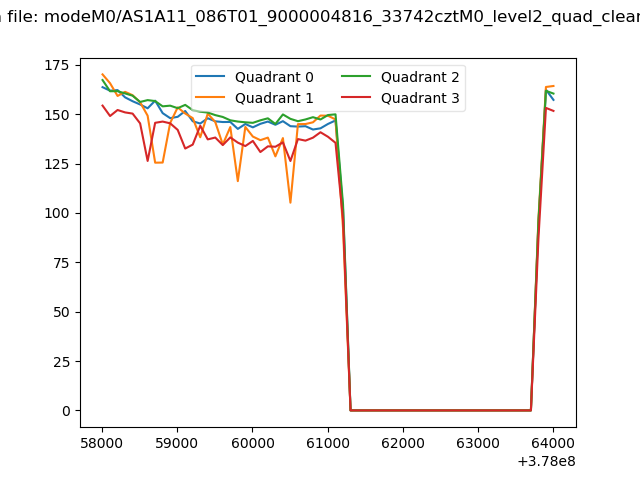 |
|
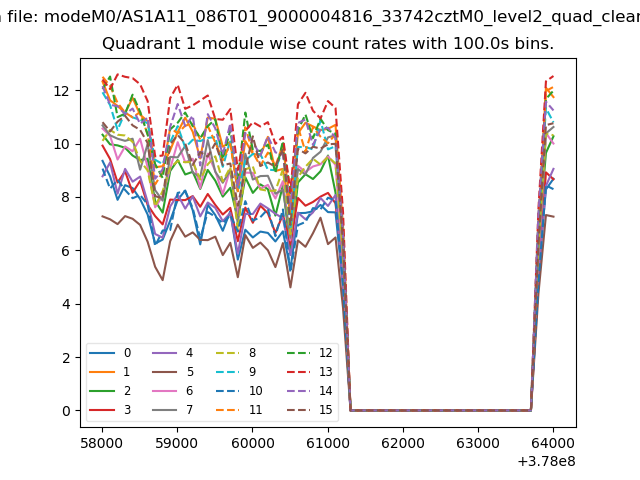
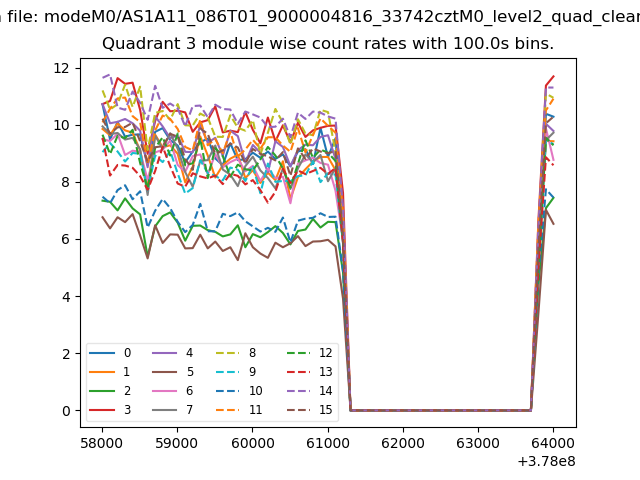
| Module-wise count rates for Quadrant A Data is divided into 100 sec bins |
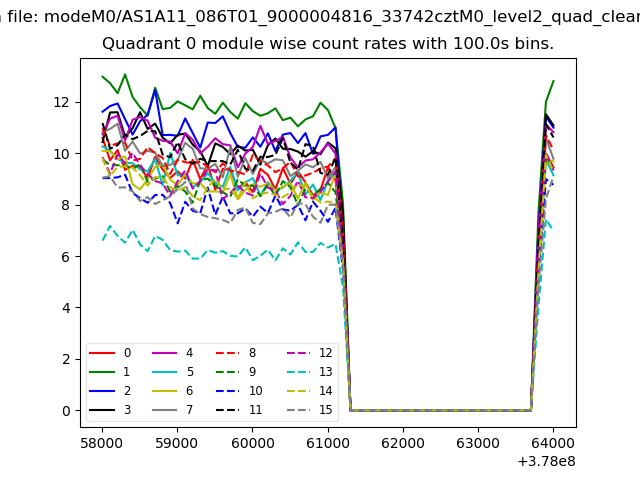 |
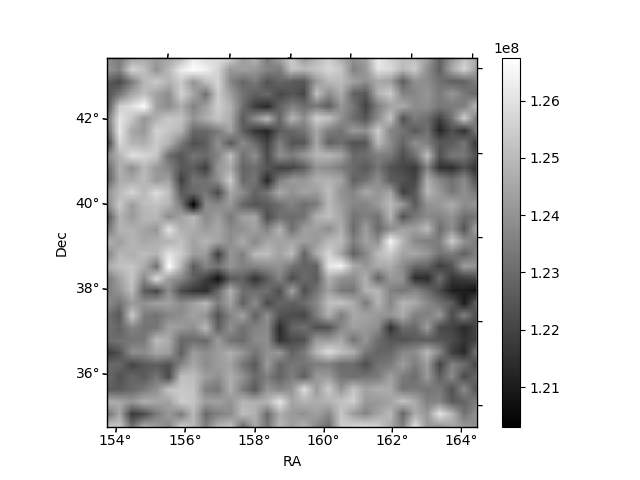 |
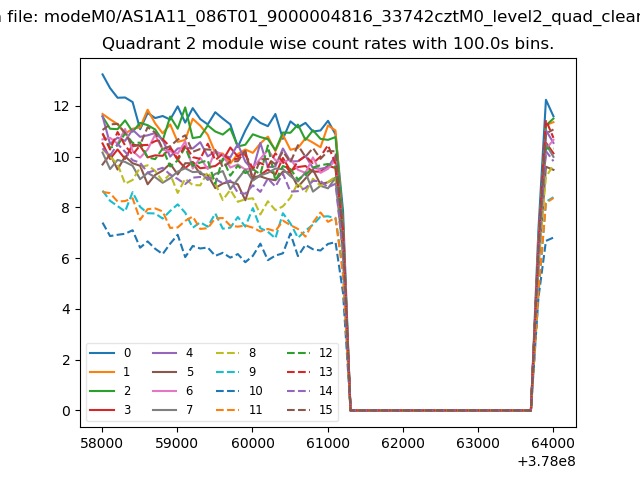
| Module-wise count rates for Quadrant B Data is divided into 100 sec bins |
 |
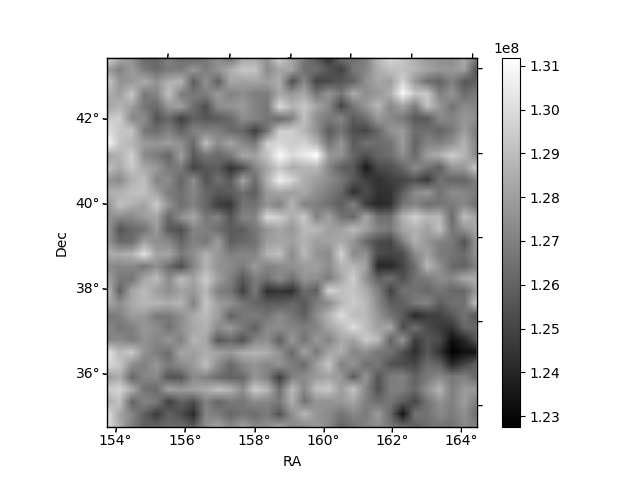 |
| Module-wise count rates for Quadrant C Data is divided into 100 sec bins |
 |
 |
| Module-wise count rates for Quadrant D Data is divided into 100 sec bins |
 |
 |
| Parameter | Plot |
|---|---|
| CZT HV Monitor | 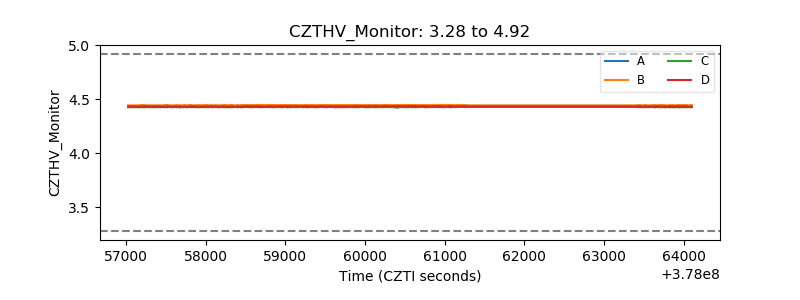 |
| D_VDD |  |
| Temperature 1 | 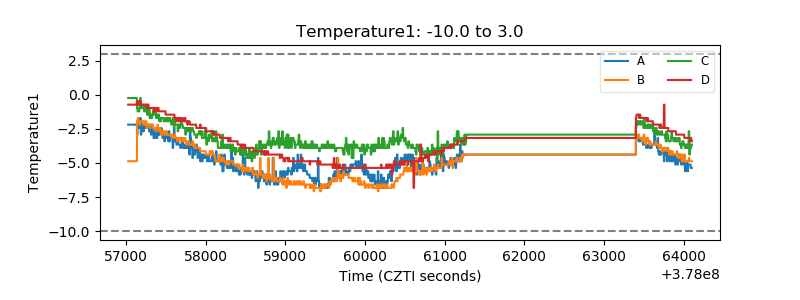 |
| Veto HV Monitor | 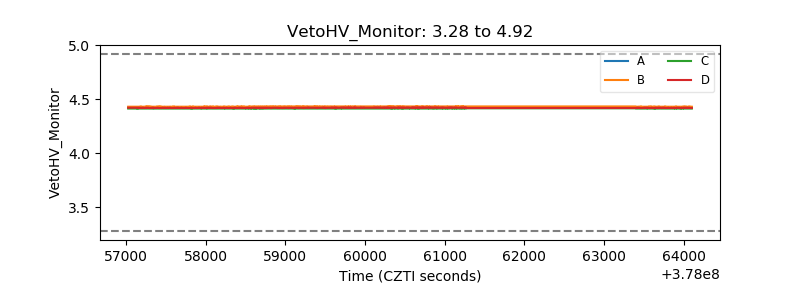 |
| Veto LLD | 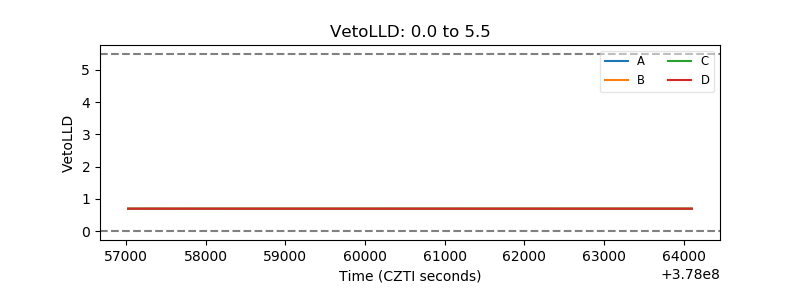 |
| Alpha Counter | 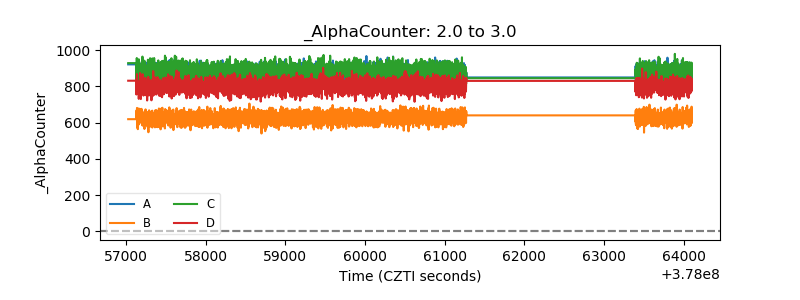 |
| _CPM_Rate | 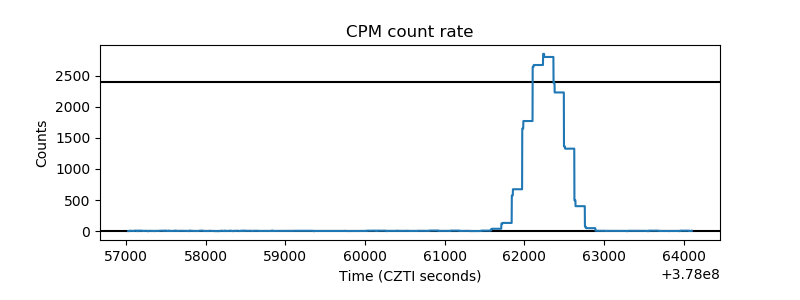 |
| CZT Counter | 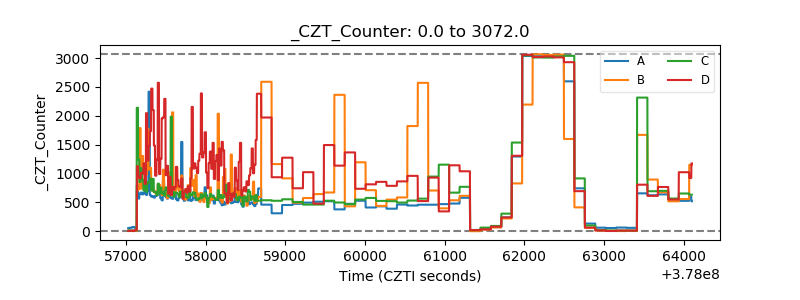 |
| +2.5 Volts monitor |  |
| +5 Volts monitor |  |
| _ROLL_ROT | 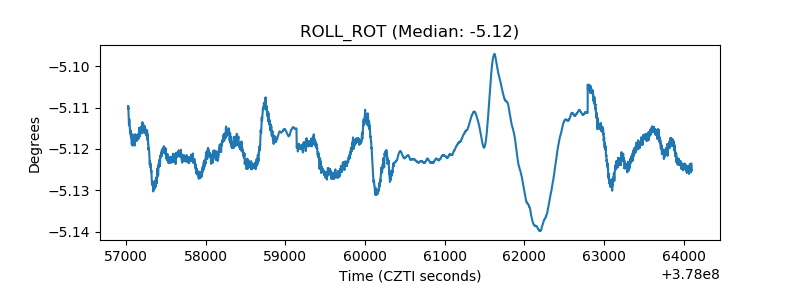 |
| _Roll_DEC | 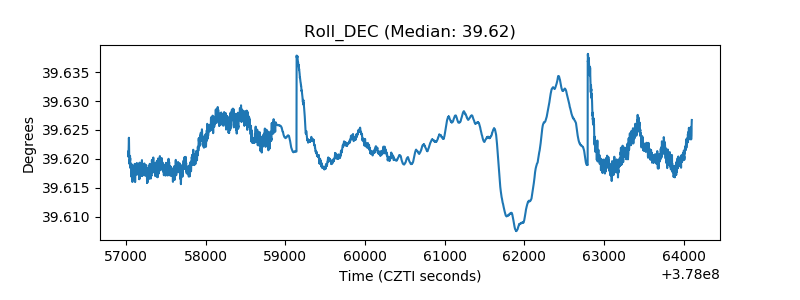 |
| _Roll_RA | 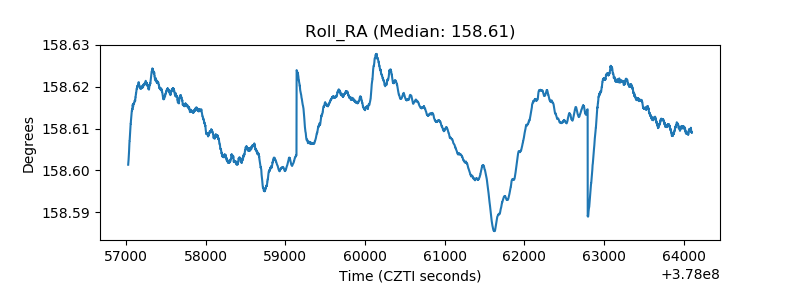 |
| Veto Counter | 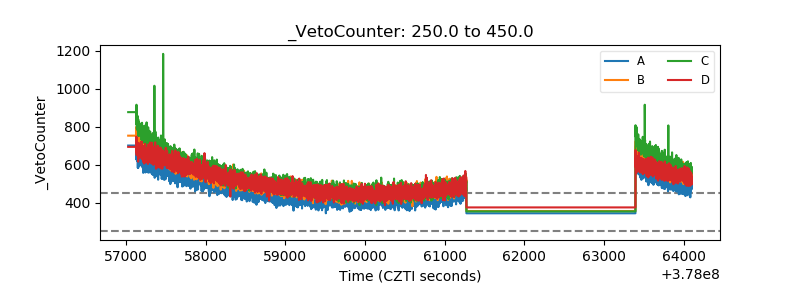 |