| Param | Original file | Final file |
|---|---|---|
| Filename | modeM0/AS1A11_086T01_9000004816_33743cztM0_level2.evt | modeM0/AS1A11_086T01_9000004816_33743cztM0_level2_quad_clean.evt |
| Size (bytes) | 486,227,520 | 94,464,000 |
| Size | 463.7 MB | 90.1 MB |
| Events in quadrant A | 2,584,845 | 639,742 |
| Events in quadrant B | 4,304,820 | 623,253 |
| Events in quadrant C | 3,042,969 | 654,255 |
| Events in quadrant D | 4,461,939 | 600,713 |
| Mode SS | |||
|---|---|---|---|
| Quadrant | BADHDUFLAG | Total packets | Discarded packets |
| A | 0 | 100 | 0 |
| B | 0 | 100 | 0 |
| C | 0 | 100 | 0 |
| D | 0 | 100 | 0 |
| Mode M9 | |||
|---|---|---|---|
| Quadrant | BADHDUFLAG | Total packets | Discarded packets |
| A | 0 | 41 | 0 |
| B | 0 | 41 | 0 |
| C | 0 | 41 | 0 |
| D | 0 | 41 | 0 |
| Mode M0 | |||
|---|---|---|---|
| Quadrant | BADHDUFLAG | Total packets | Discarded packets |
| A | 0 | 10749 | 3 |
| B | 0 | 16126 | 2 |
| C | 0 | 12043 | 2 |
| D | 0 | 16679 | 2 |
| Quadrant | Total seconds | Saturated seconds | Saturation percentage |
|---|---|---|---|
| A | 4883 | 58 | 1.187794% |
| B | 4883 | 451 | 9.236125% |
| C | 4883 | 119 | 2.437026% |
| D | 4883 | 291 | 5.959451% |
Noise dominated data is calculated using 1-second bins in cleaned event files. If a bin has >2000 counts, and if more than 50% of those come from <1% of pixels, then it is considered to be noise-dominated and hence unusable.
| Quadrant | # 1 sec bins | Bins with >0 counts | Bins with >2000 counts | High rate bins dominated by noise | Noise dominated (total time) | Noise dominated (detector-on time) | Marked lightcurve |
|---|---|---|---|---|---|---|---|
| A | 7004 | 4884 | 44 | 44 | 0.63% | 0.90% | 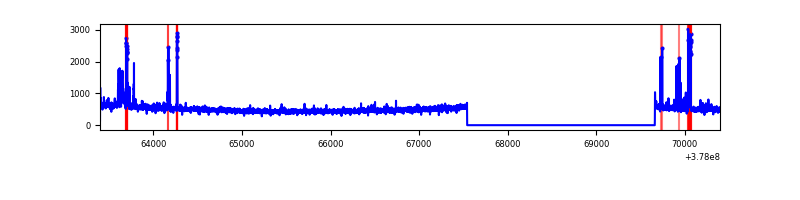 |
| B | 7004 | 4884 | 382 | 382 | 5.45% | 7.82% | 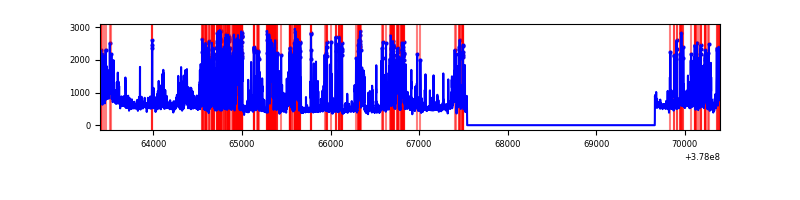 |
| C | 7004 | 4884 | 103 | 103 | 1.47% | 2.11% | 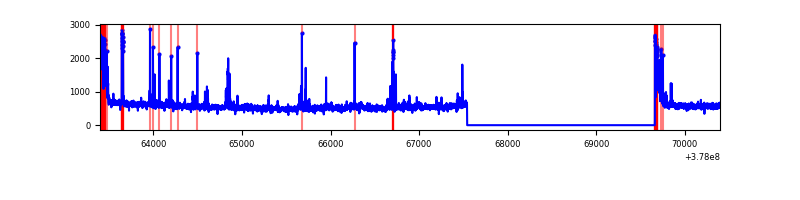 |
| D | 7004 | 4884 | 299 | 299 | 4.27% | 6.12% | 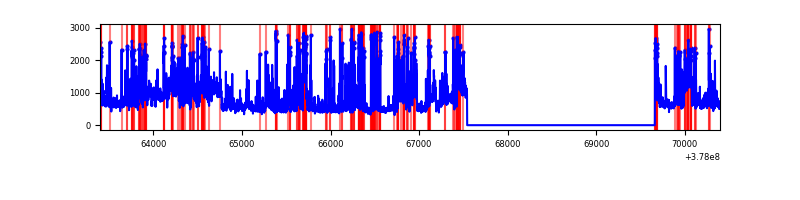 |
Top three noisy pixels from each quadrant. If the there are fewer than three noisy pixels in the level2.evt file, extra rows are filled as -1
| Pixel properties | Quadrant properties | ||||||
|---|---|---|---|---|---|---|---|
| Quadrant | DetID | PixID | Counts | Sigma | Mean | Median | Sigma |
| A | 14 | 4 | 114902 | 940.96 | 611 | 600 | 121.5 |
| A | 15 | 237 | 91549 | 748.71 | 611 | 600 | 121.5 |
| A | 10 | 83 | 9842 | 76.08 | 611 | 600 | 121.5 |
| B | 5 | 172 | 1600305 | 14233.69 | 598 | 583 | 112.4 |
| B | 12 | 1 | 68302 | 602.53 | 598 | 583 | 112.4 |
| B | 0 | 213 | 41614 | 365.07 | 598 | 583 | 112.4 |
| C | 0 | 10 | 235231 | 1684.29 | 605 | 612 | 139.3 |
| C | 15 | 214 | 209910 | 1502.52 | 605 | 612 | 139.3 |
| C | 9 | 187 | 161670 | 1156.21 | 605 | 612 | 139.3 |
| D | 8 | 195 | 768575 | 4880.87 | 590 | 579 | 157.3 |
| D | 1 | 47 | 633040 | 4019.5 | 590 | 579 | 157.3 |
| D | 2 | 250 | 249083 | 1579.33 | 590 | 579 | 157.3 |
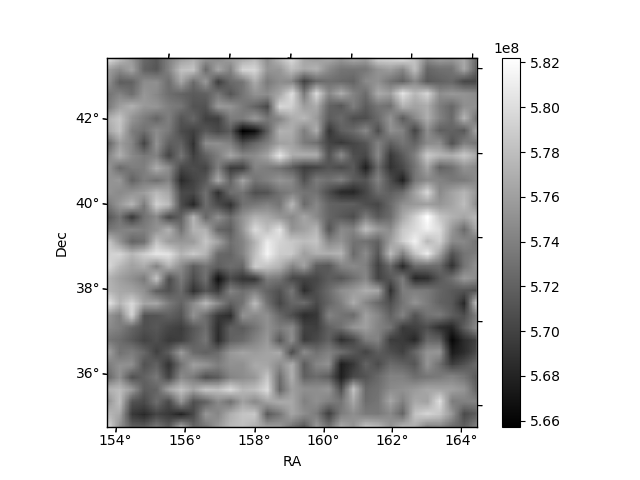
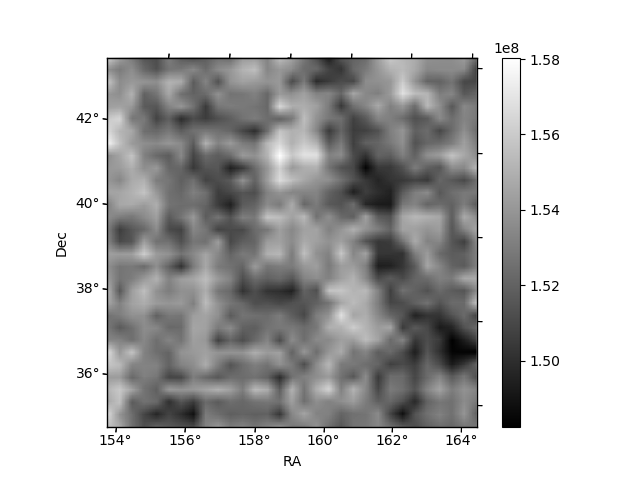
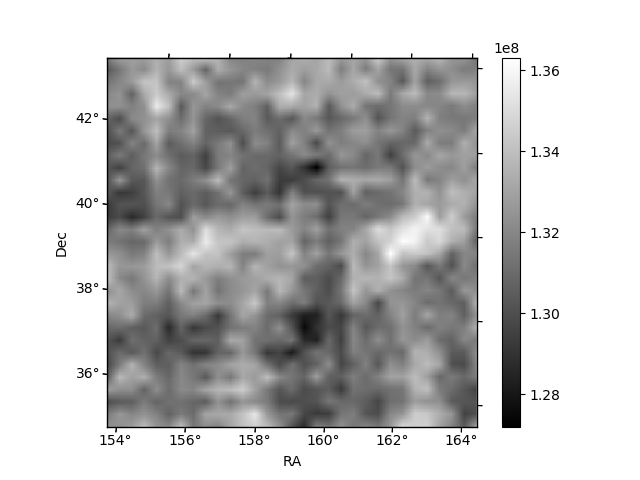
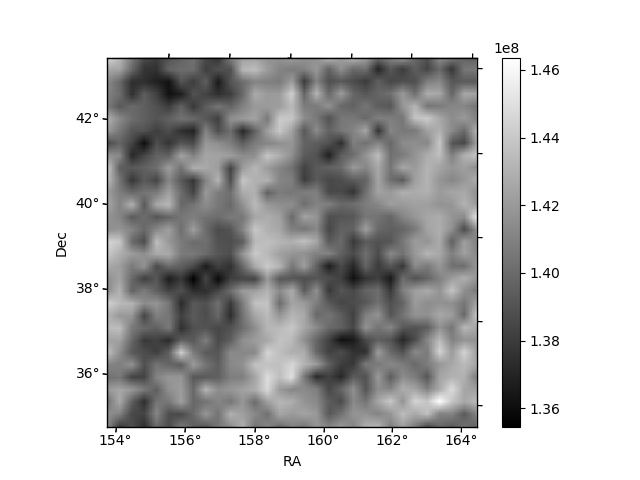
Histogram calculated using DETX and DETY for each event in the final _common_clean file
| Quadrant A | 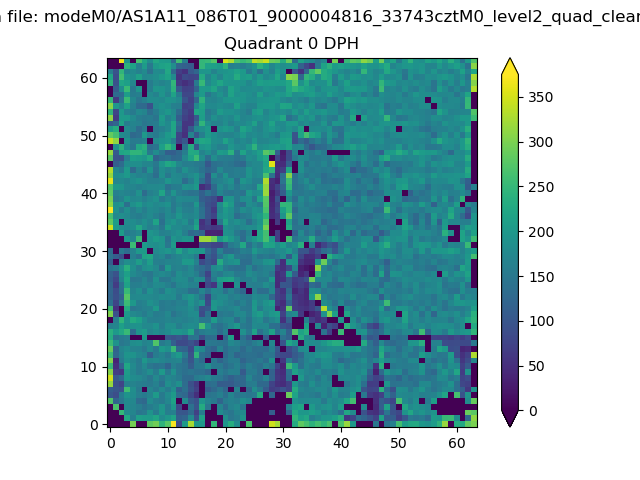 |
 |
Quadrant B |
|---|---|---|---|
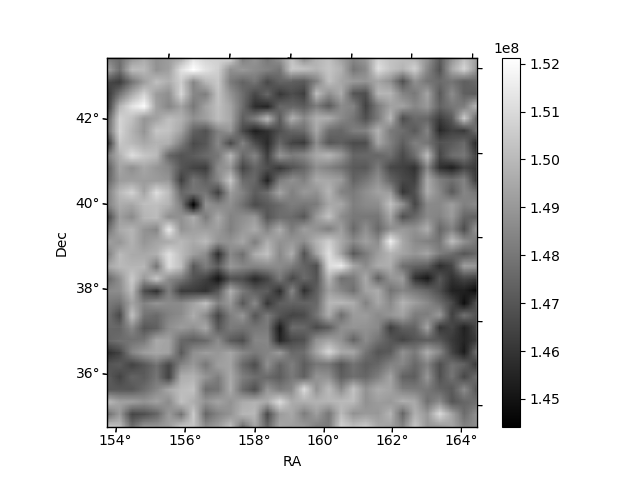
| Quadrant D | 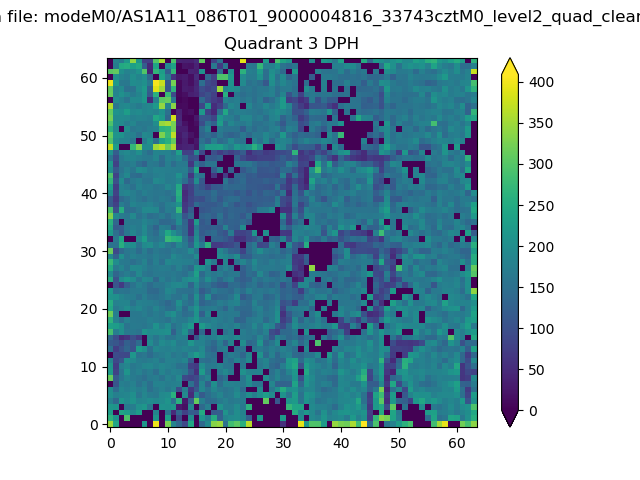 |
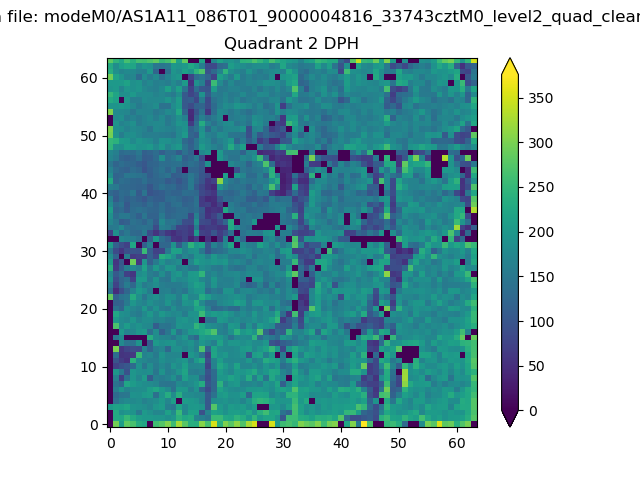 |
Quadrant C |
| Plot type | Count rate plots | Images |
|---|---|---|
| Comparison with Poisson distribution Blue bars denote a histogram of data divided into 1 sec bins. Red curve is a Poisson curve with rate = median count rate of data. |
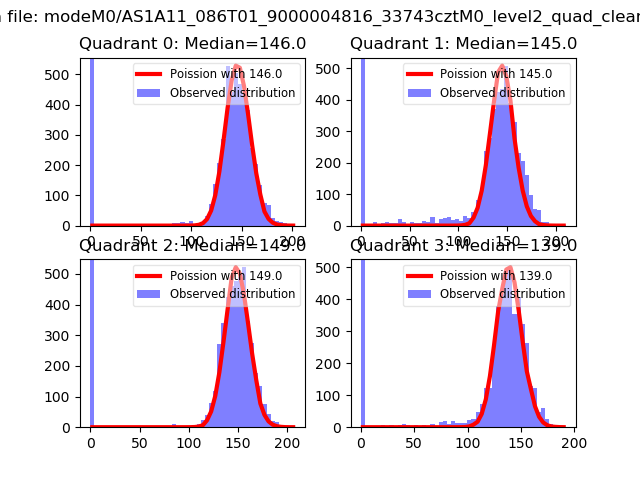 |
 |
| Quadrant-wise count rates Data is divided into 100 sec bins |
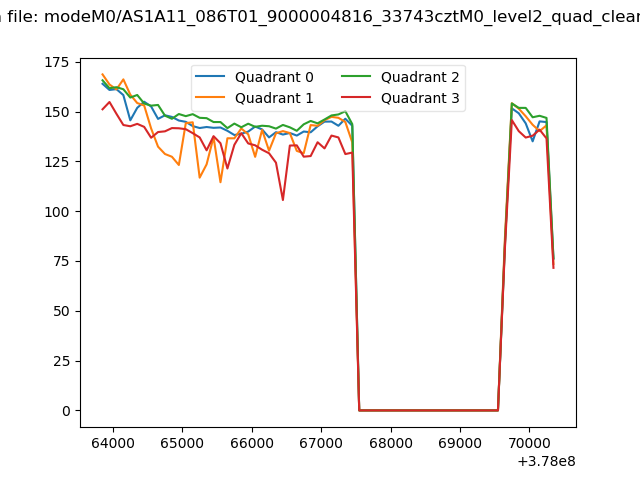 |
|
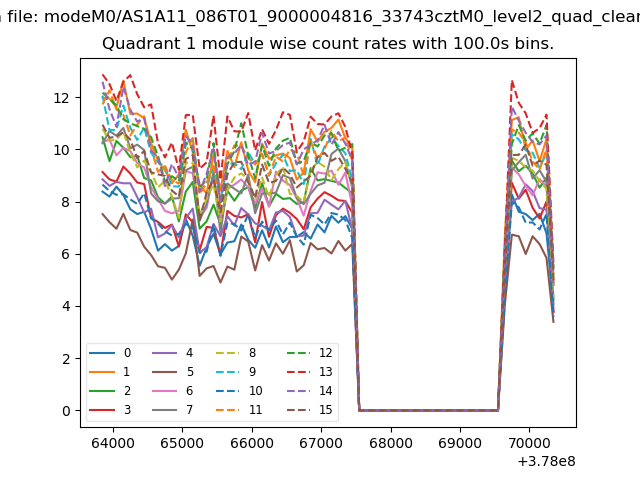
| Module-wise count rates for Quadrant A Data is divided into 100 sec bins |
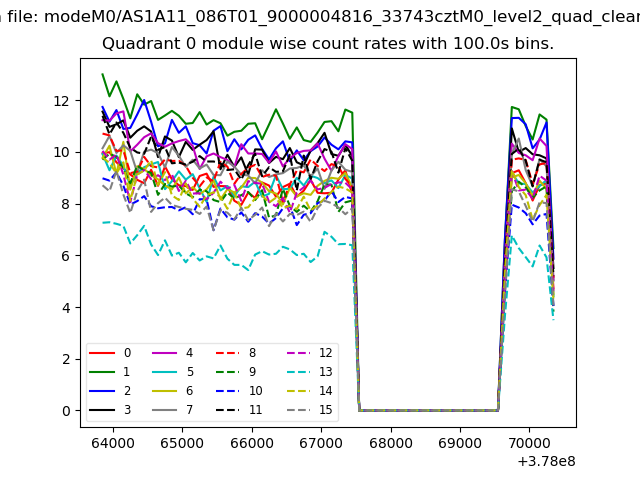 |
 |
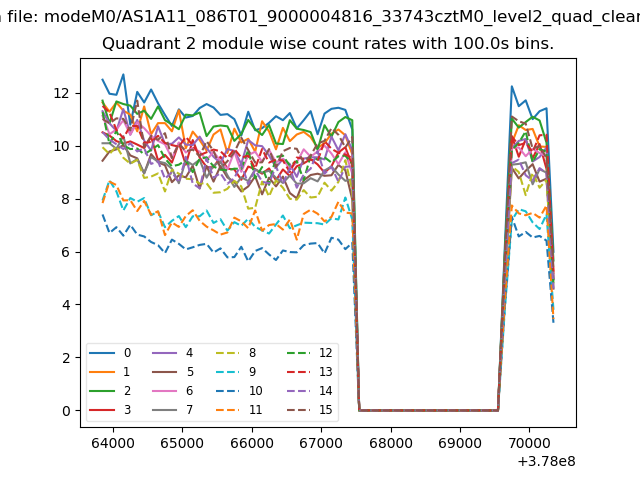
| Module-wise count rates for Quadrant B Data is divided into 100 sec bins |
 |
 |
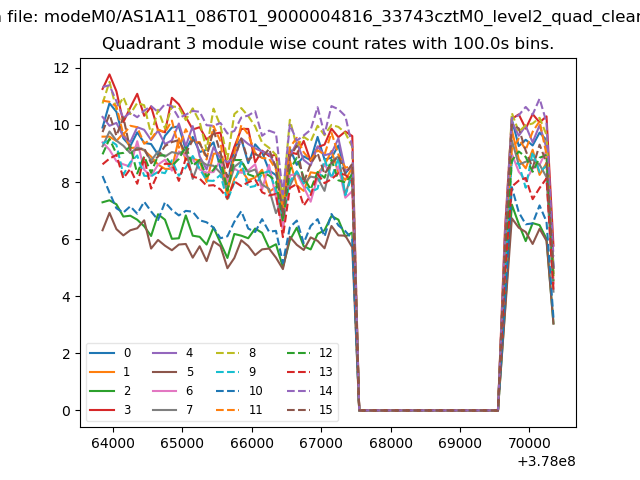
| Module-wise count rates for Quadrant C Data is divided into 100 sec bins |
 |
 |
| Module-wise count rates for Quadrant D Data is divided into 100 sec bins |
 |
 |
| Parameter | Plot |
|---|---|
| CZT HV Monitor | 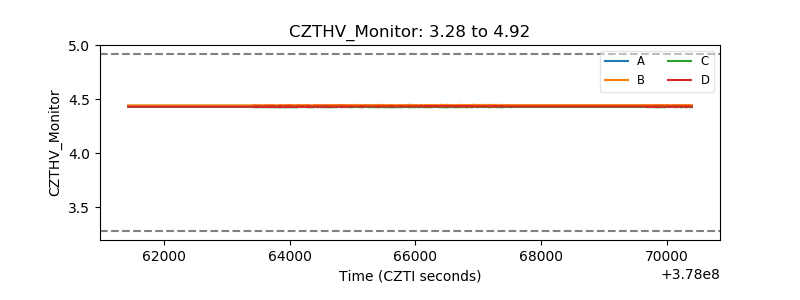 |
| D_VDD | 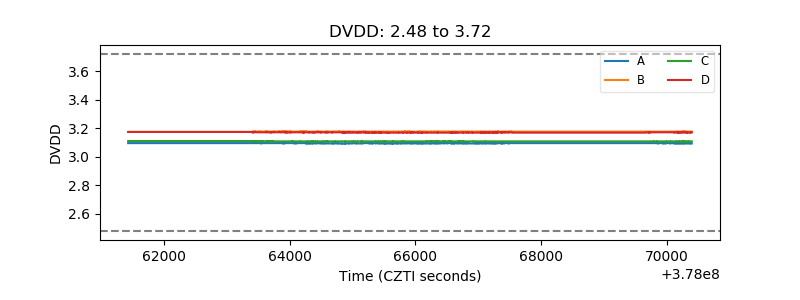 |
| Temperature 1 | 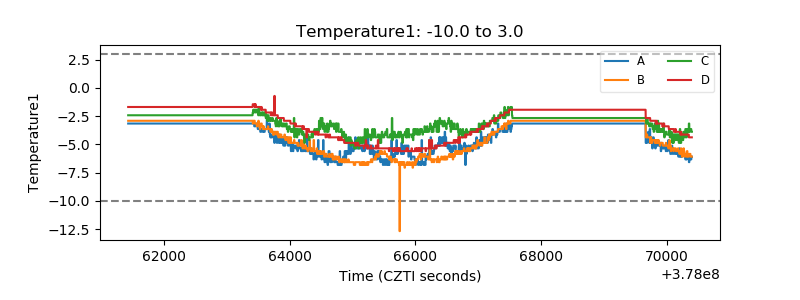 |
| Veto HV Monitor |  |
| Veto LLD | 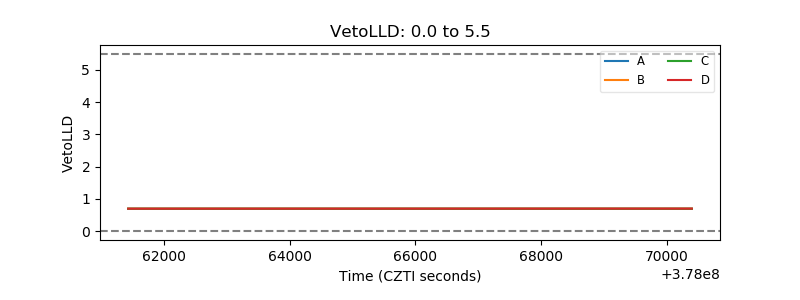 |
| Alpha Counter | 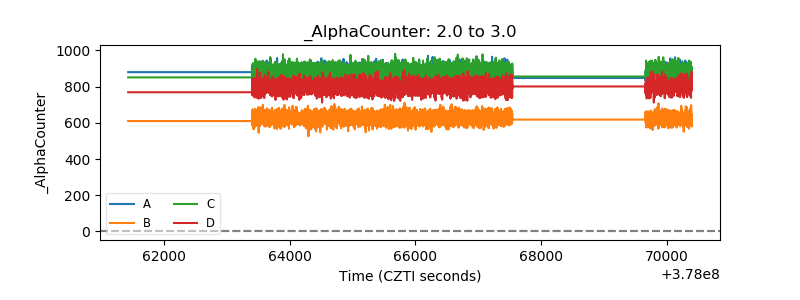 |
| _CPM_Rate | 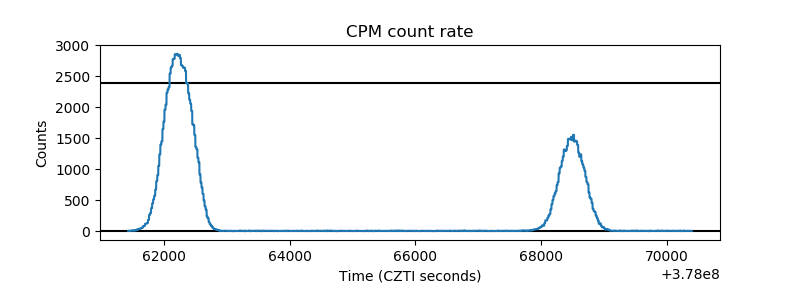 |
| CZT Counter | 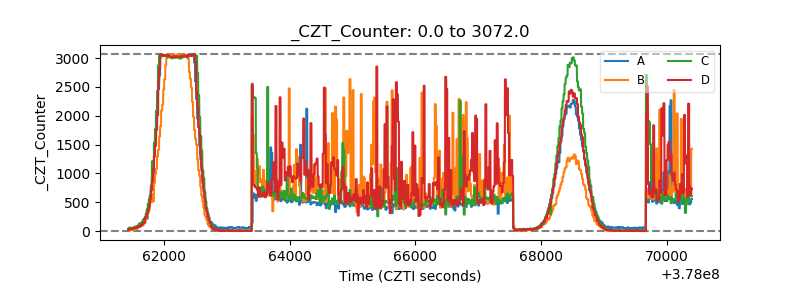 |
| +2.5 Volts monitor |  |
| +5 Volts monitor |  |
| _ROLL_ROT | 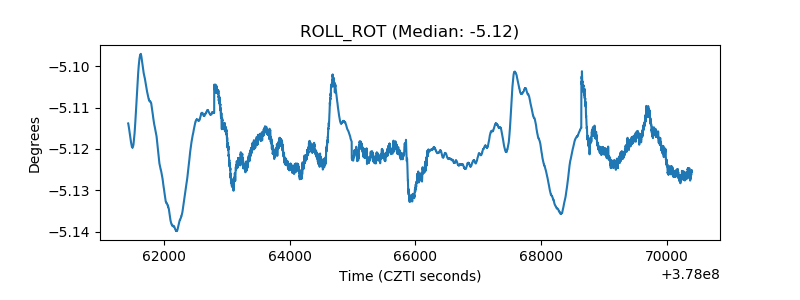 |
| _Roll_DEC | 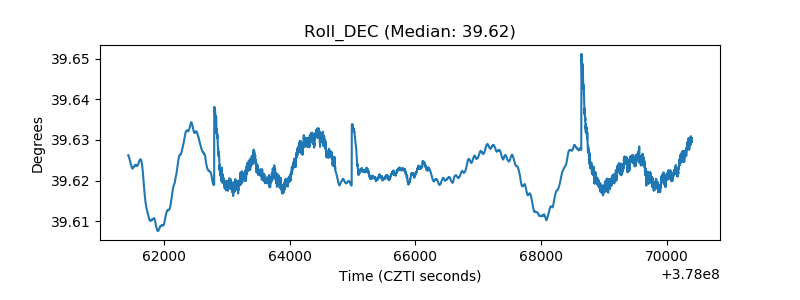 |
| _Roll_RA | 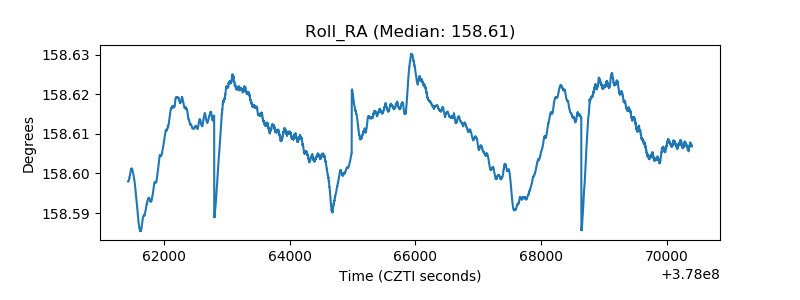 |
| Veto Counter | 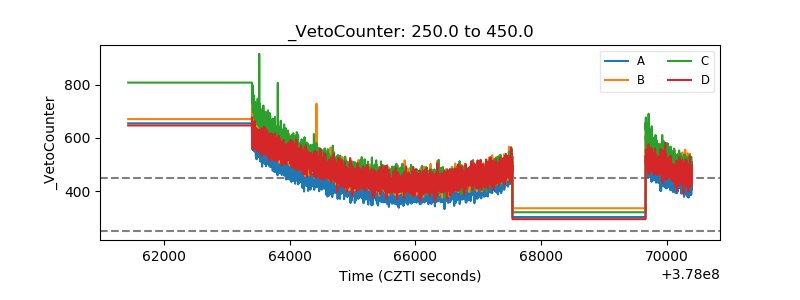 |