| Param | Original file | Final file |
|---|---|---|
| Filename | modeM0/AS1A11_086T01_9000004816_33744cztM0_level2.evt | modeM0/AS1A11_086T01_9000004816_33744cztM0_level2_quad_clean.evt |
| Size (bytes) | 495,627,840 | 94,115,520 |
| Size | 472.7 MB | 89.8 MB |
| Events in quadrant A | 2,493,169 | 633,154 |
| Events in quadrant B | 4,472,247 | 617,673 |
| Events in quadrant C | 2,927,165 | 642,668 |
| Events in quadrant D | 4,770,555 | 597,569 |
| Mode SS | |||
|---|---|---|---|
| Quadrant | BADHDUFLAG | Total packets | Discarded packets |
| A | 0 | 106 | 0 |
| B | 0 | 106 | 0 |
| C | 0 | 106 | 0 |
| D | 0 | 106 | 0 |
| Mode M9 | |||
|---|---|---|---|
| Quadrant | BADHDUFLAG | Total packets | Discarded packets |
| A | 0 | 42 | 0 |
| B | 0 | 42 | 0 |
| C | 0 | 42 | 0 |
| D | 0 | 42 | 0 |
| Mode M0 | |||
|---|---|---|---|
| Quadrant | BADHDUFLAG | Total packets | Discarded packets |
| A | 0 | 10700 | 3 |
| B | 0 | 16824 | 2 |
| C | 0 | 11755 | 2 |
| D | 0 | 17803 | 2 |
| Quadrant | Total seconds | Saturated seconds | Saturation percentage |
|---|---|---|---|
| A | 5126 | 34 | 0.663285% |
| B | 5126 | 416 | 8.115490% |
| C | 5126 | 78 | 1.521654% |
| D | 5126 | 143 | 2.789700% |
Noise dominated data is calculated using 1-second bins in cleaned event files. If a bin has >2000 counts, and if more than 50% of those come from <1% of pixels, then it is considered to be noise-dominated and hence unusable.
| Quadrant | # 1 sec bins | Bins with >0 counts | Bins with >2000 counts | High rate bins dominated by noise | Noise dominated (total time) | Noise dominated (detector-on time) | Marked lightcurve |
|---|---|---|---|---|---|---|---|
| A | 9279 | 5128 | 26 | 26 | 0.28% | 0.51% | 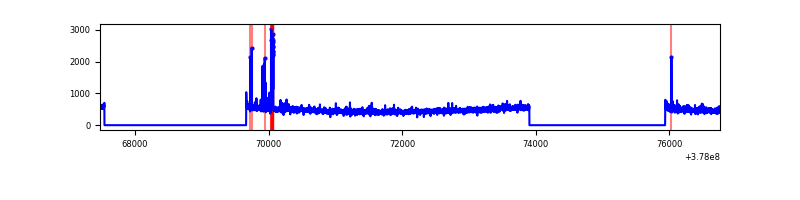 |
| B | 9279 | 5128 | 359 | 359 | 3.87% | 7.00% | 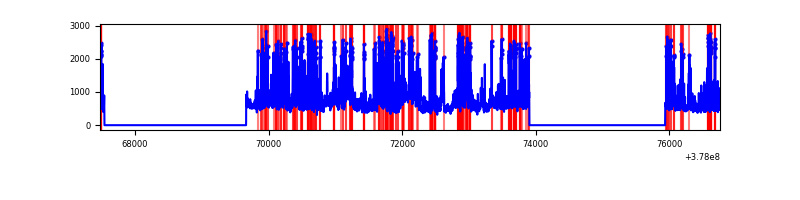 |
| C | 9279 | 5128 | 65 | 65 | 0.70% | 1.27% | 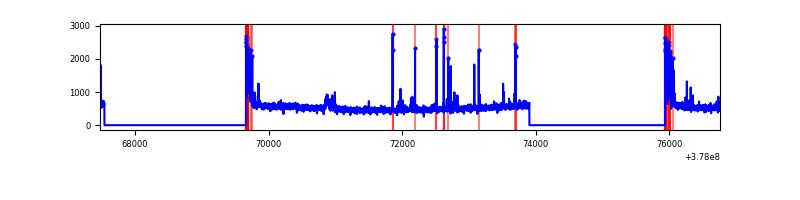 |
| D | 9279 | 5128 | 149 | 149 | 1.61% | 2.91% | 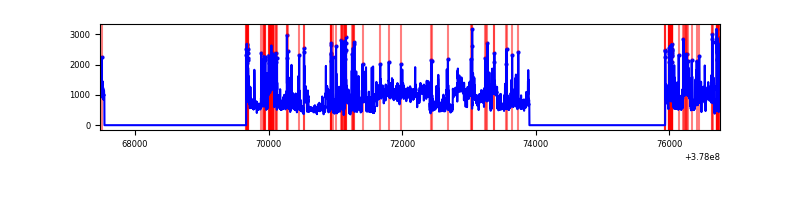 |
Top three noisy pixels from each quadrant. If the there are fewer than three noisy pixels in the level2.evt file, extra rows are filled as -1
| Pixel properties | Quadrant properties | ||||||
|---|---|---|---|---|---|---|---|
| Quadrant | DetID | PixID | Counts | Sigma | Mean | Median | Sigma |
| A | 14 | 4 | 93960 | 764.36 | 610 | 599 | 122.1 |
| A | 15 | 237 | 24040 | 191.92 | 610 | 599 | 122.1 |
| A | 10 | 83 | 9347 | 71.62 | 610 | 599 | 122.1 |
| B | 5 | 172 | 1294032 | 11320.05 | 597 | 581 | 114.3 |
| B | 4 | 170 | 296576 | 2590.5 | 597 | 581 | 114.3 |
| B | 5 | 255 | 198724 | 1734.11 | 597 | 581 | 114.3 |
| C | 15 | 214 | 221864 | 1597.23 | 602 | 610 | 138.5 |
| C | 0 | 10 | 210231 | 1513.25 | 602 | 610 | 138.5 |
| C | 9 | 187 | 107798 | 773.79 | 602 | 610 | 138.5 |
| D | 8 | 195 | 1596512 | 9930.67 | 589 | 578 | 160.7 |
| D | 1 | 47 | 218514 | 1356.1 | 589 | 578 | 160.7 |
| D | 2 | 249 | 160867 | 997.4 | 589 | 578 | 160.7 |
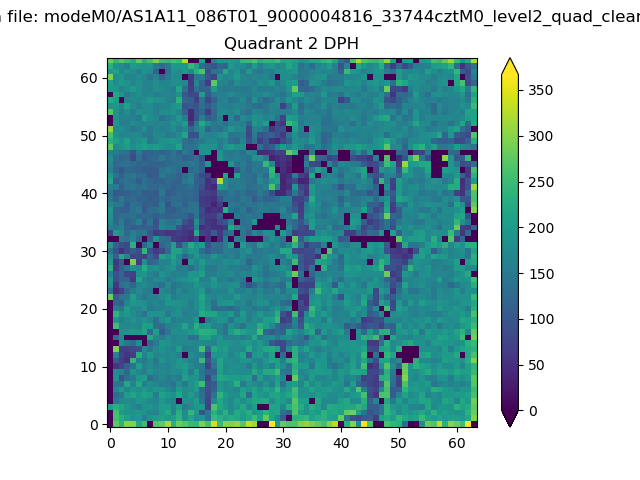
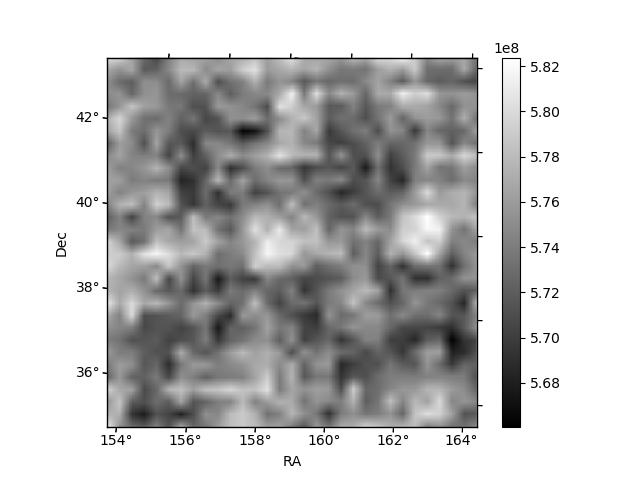
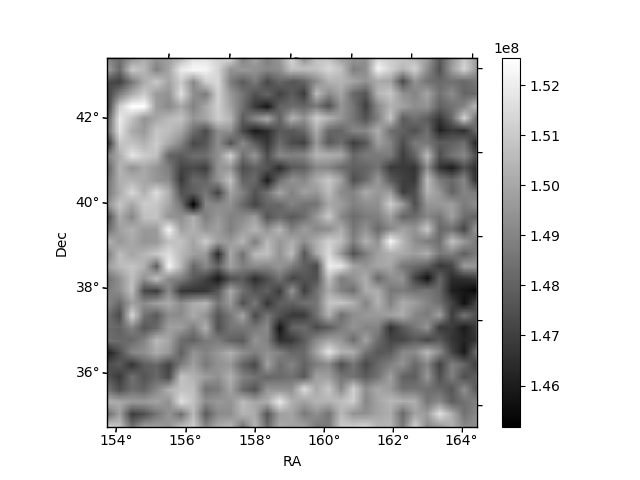
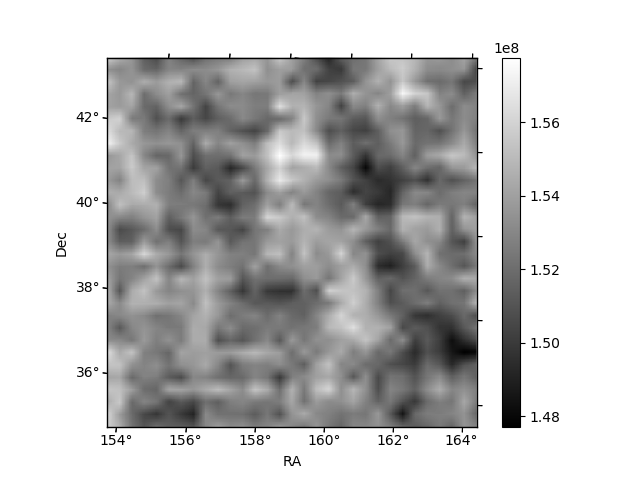
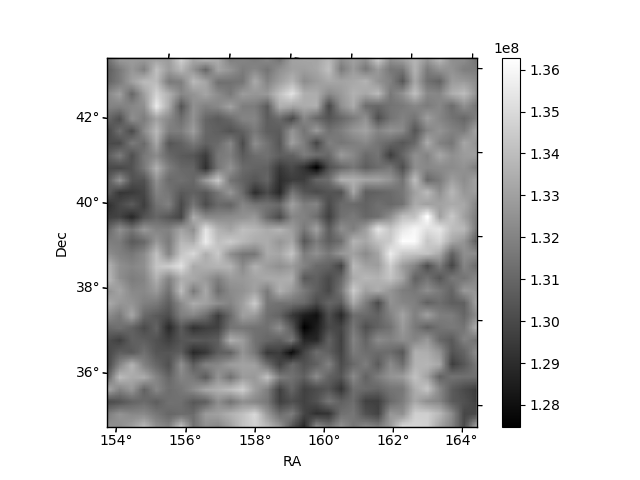
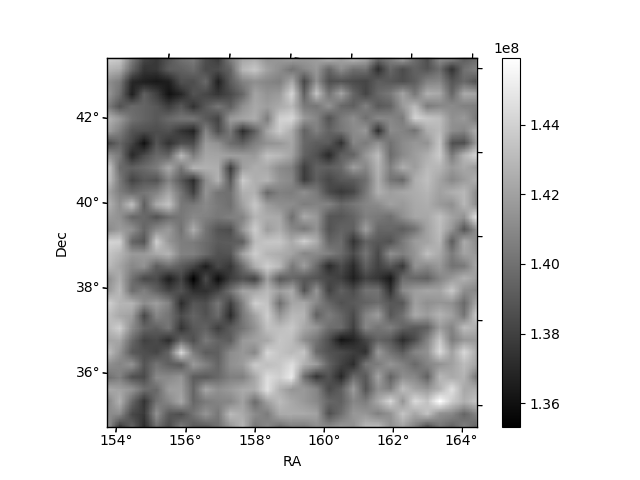
Histogram calculated using DETX and DETY for each event in the final _common_clean file
| Quadrant A | 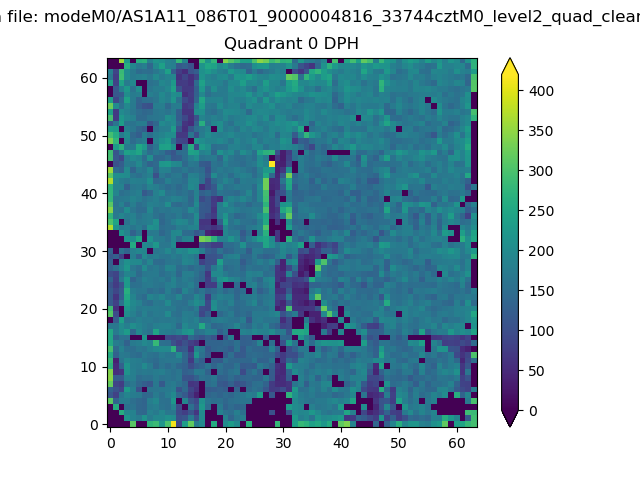 |
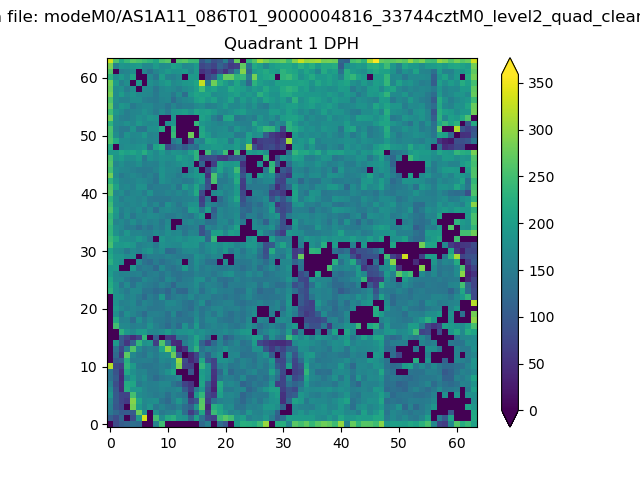 |
Quadrant B |
|---|---|---|---|
| Quadrant D | 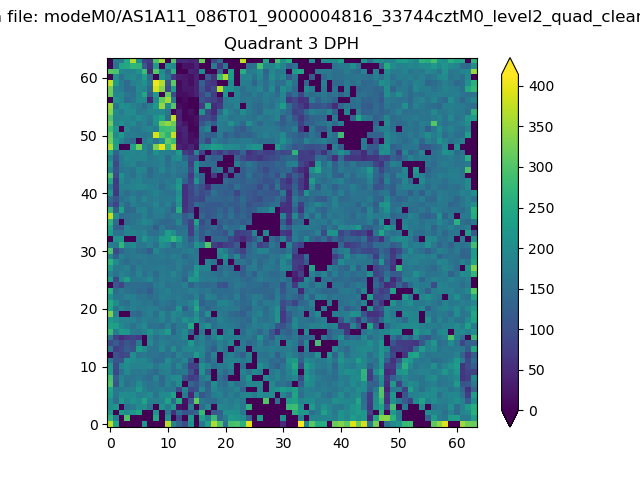 |
 |
Quadrant C |
| Plot type | Count rate plots | Images |
|---|---|---|
| Comparison with Poisson distribution Blue bars denote a histogram of data divided into 1 sec bins. Red curve is a Poisson curve with rate = median count rate of data. |
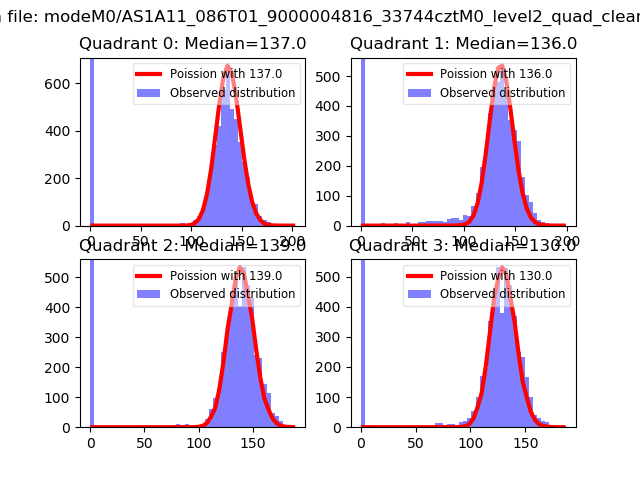 |
 |
| Quadrant-wise count rates Data is divided into 100 sec bins |
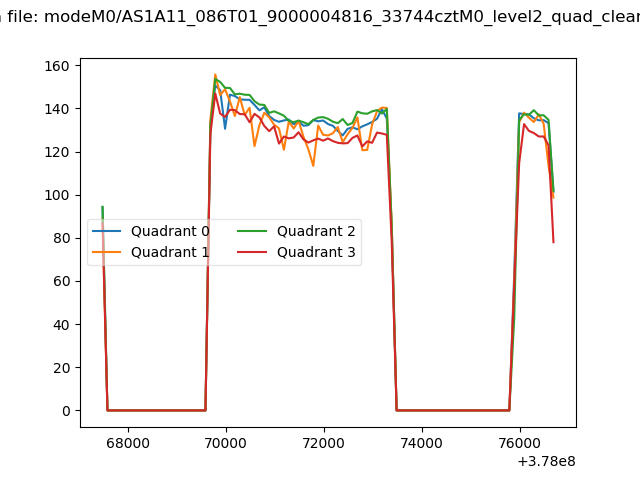 |
|
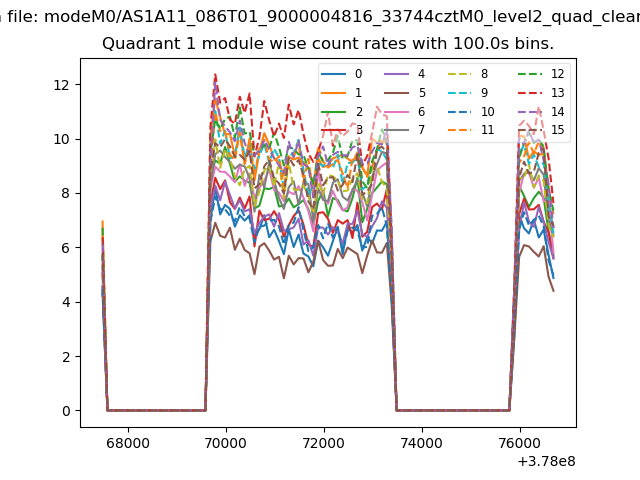
| Module-wise count rates for Quadrant A Data is divided into 100 sec bins |
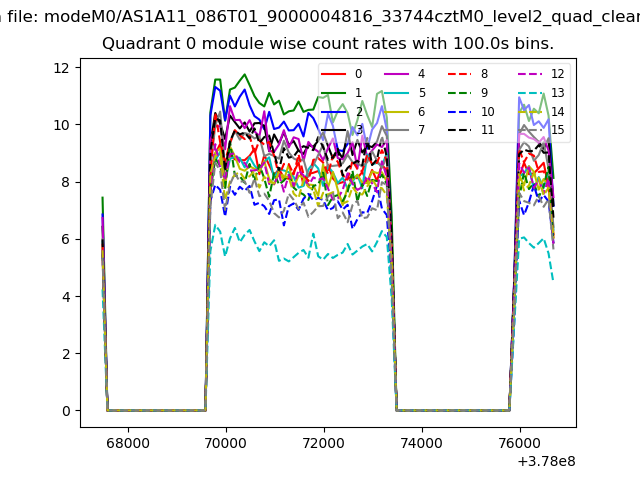 |
 |
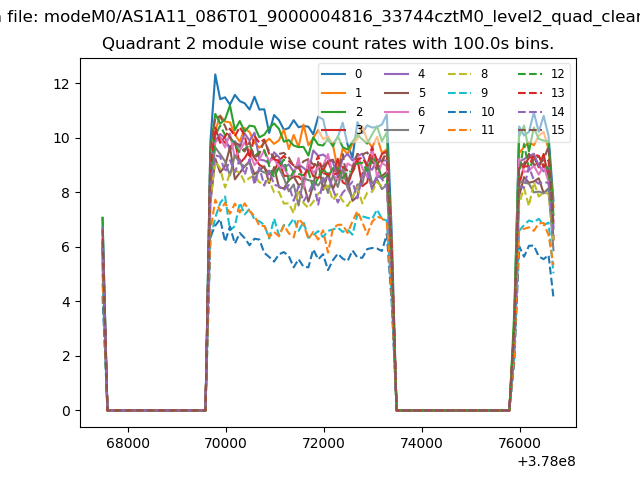
| Module-wise count rates for Quadrant B Data is divided into 100 sec bins |
 |
 |
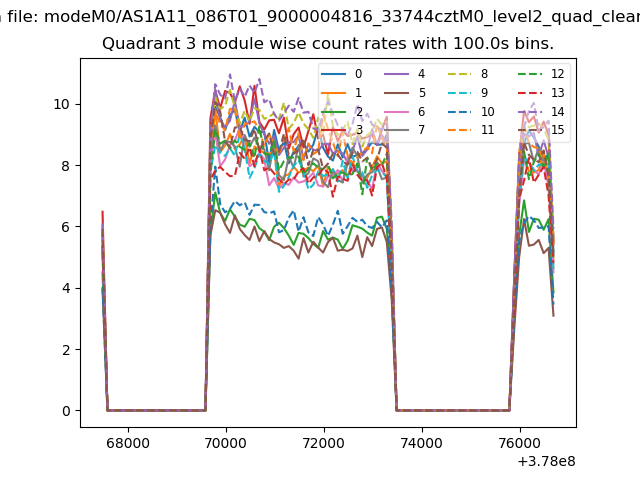
| Module-wise count rates for Quadrant C Data is divided into 100 sec bins |
 |
 |
| Module-wise count rates for Quadrant D Data is divided into 100 sec bins |
 |
 |
| Parameter | Plot |
|---|---|
| CZT HV Monitor | 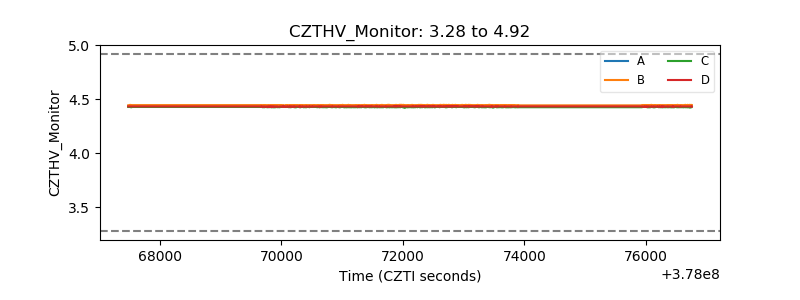 |
| D_VDD | 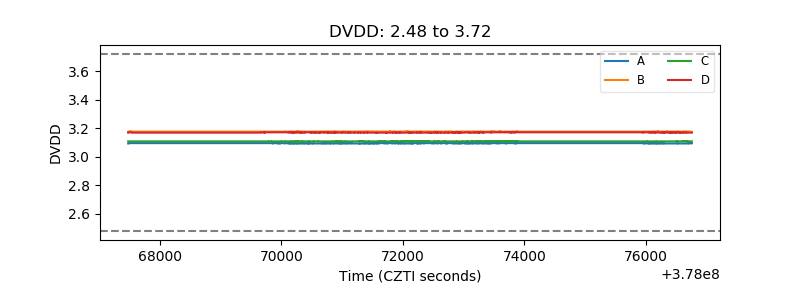 |
| Temperature 1 | 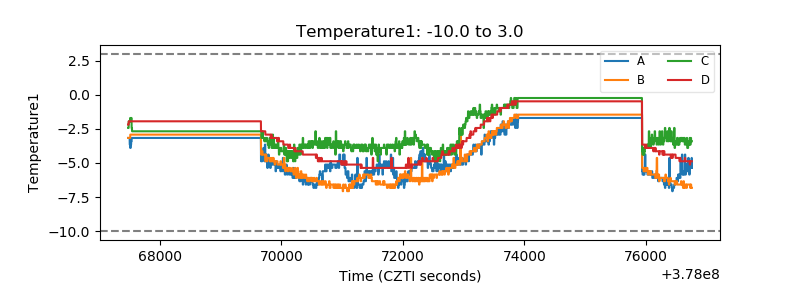 |
| Veto HV Monitor | 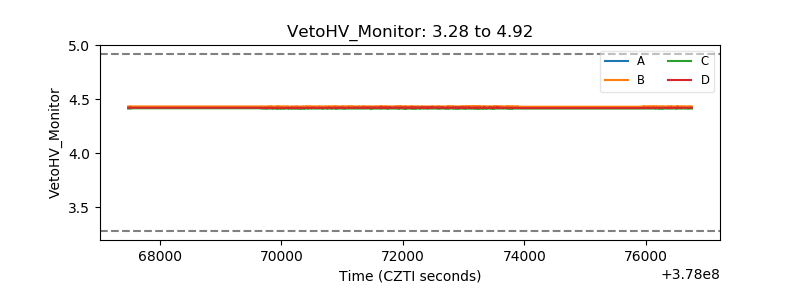 |
| Veto LLD | 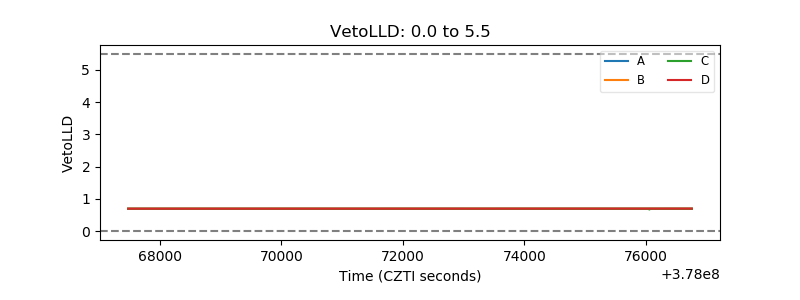 |
| Alpha Counter | 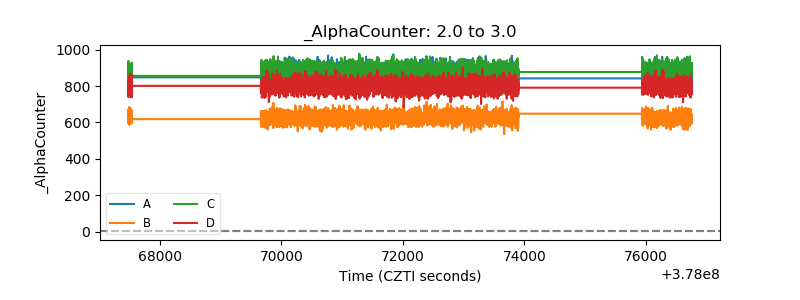 |
| _CPM_Rate | 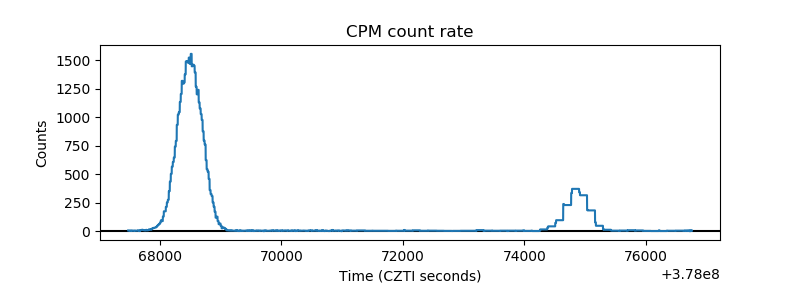 |
| CZT Counter | 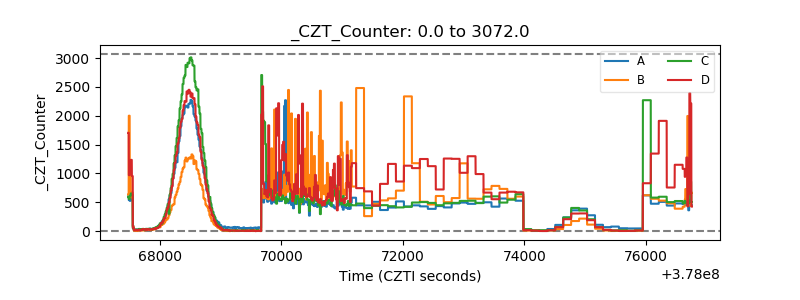 |
| +2.5 Volts monitor | 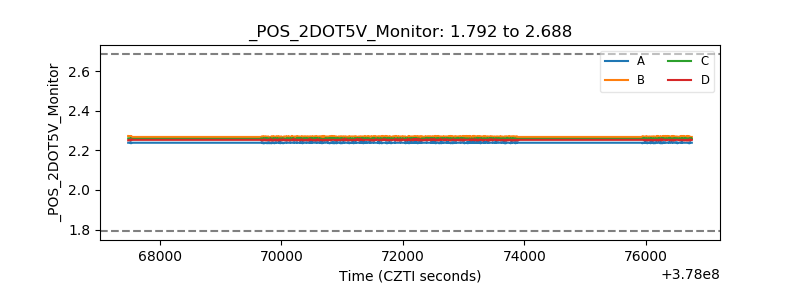 |
| +5 Volts monitor | 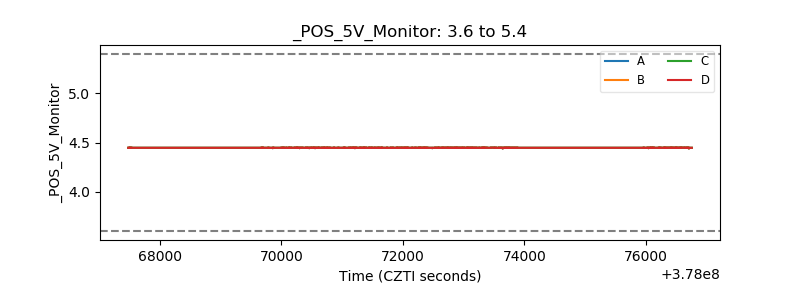 |
| _ROLL_ROT | 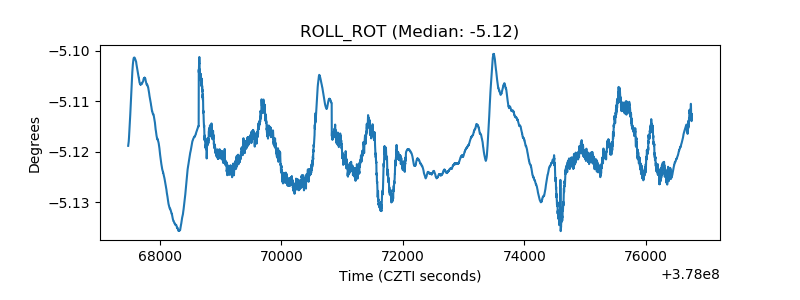 |
| _Roll_DEC |  |
| _Roll_RA | 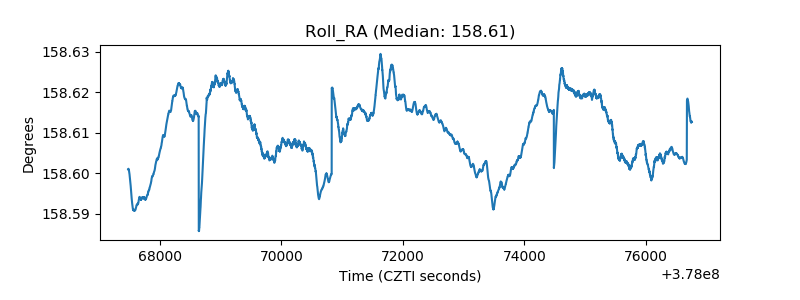 |
| Veto Counter | 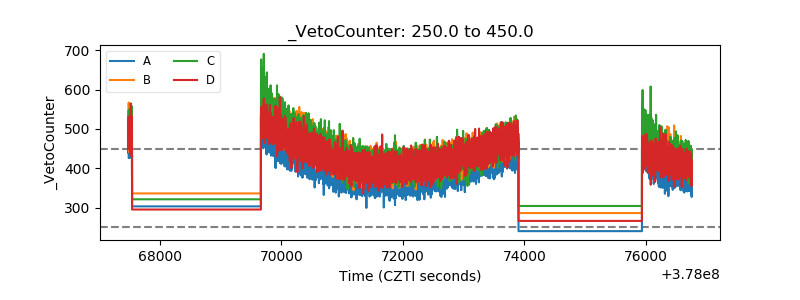 |