| Param | Original file | Final file |
|---|---|---|
| Filename | modeM0/AS1A11_086T01_9000004816_33745cztM0_level2.evt | modeM0/AS1A11_086T01_9000004816_33745cztM0_level2_quad_clean.evt |
| Size (bytes) | 264,784,320 | 56,468,160 |
| Size | 252.5 MB | 53.9 MB |
| Events in quadrant A | 1,337,071 | 382,393 |
| Events in quadrant B | 2,002,496 | 373,643 |
| Events in quadrant C | 1,710,756 | 380,579 |
| Events in quadrant D | 2,762,309 | 358,214 |
| Mode SS | |||
|---|---|---|---|
| Quadrant | BADHDUFLAG | Total packets | Discarded packets |
| A | 0 | 60 | 0 |
| B | 0 | 60 | 0 |
| C | 0 | 60 | 0 |
| D | 0 | 60 | 0 |
| Mode M9 | |||
|---|---|---|---|
| Quadrant | BADHDUFLAG | Total packets | Discarded packets |
| A | 0 | 21 | 0 |
| B | 0 | 21 | 0 |
| C | 0 | 21 | 0 |
| D | 0 | 21 | 0 |
| Mode M0 | |||
|---|---|---|---|
| Quadrant | BADHDUFLAG | Total packets | Discarded packets |
| A | 0 | 6155 | 1 |
| B | 0 | 8043 | 1 |
| C | 0 | 6913 | 1 |
| D | 0 | 10295 | 1 |
| Quadrant | Total seconds | Saturated seconds | Saturation percentage |
|---|---|---|---|
| A | 3025 | 3 | 0.099174% |
| B | 3025 | 169 | 5.586777% |
| C | 3025 | 71 | 2.347107% |
| D | 3025 | 112 | 3.702479% |
Noise dominated data is calculated using 1-second bins in cleaned event files. If a bin has >2000 counts, and if more than 50% of those come from <1% of pixels, then it is considered to be noise-dominated and hence unusable.
| Quadrant | # 1 sec bins | Bins with >0 counts | Bins with >2000 counts | High rate bins dominated by noise | Noise dominated (total time) | Noise dominated (detector-on time) | Marked lightcurve |
|---|---|---|---|---|---|---|---|
| A | 5057 | 3026 | 1 | 1 | 0.02% | 0.03% | 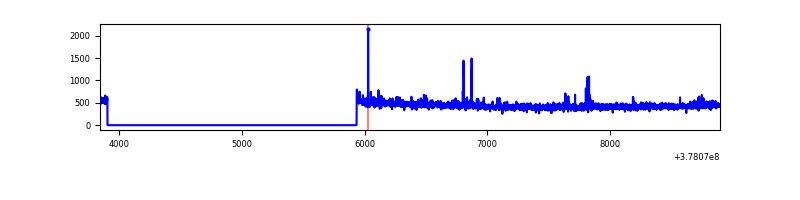 |
| B | 5057 | 3026 | 137 | 137 | 2.71% | 4.53% | 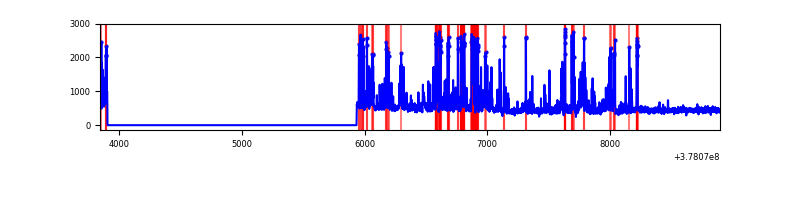 |
| C | 5057 | 3026 | 63 | 63 | 1.25% | 2.08% | 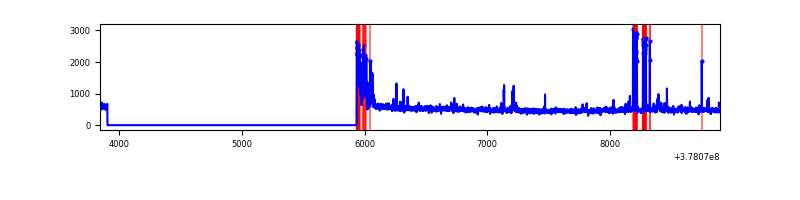 |
| D | 5056 | 3025 | 119 | 119 | 2.35% | 3.93% | 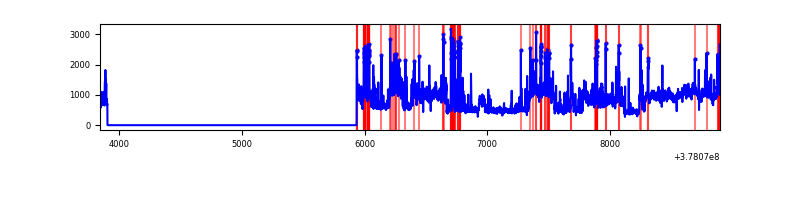 |
Top three noisy pixels from each quadrant. If the there are fewer than three noisy pixels in the level2.evt file, extra rows are filled as -1
| Pixel properties | Quadrant properties | ||||||
|---|---|---|---|---|---|---|---|
| Quadrant | DetID | PixID | Counts | Sigma | Mean | Median | Sigma |
| A | 14 | 4 | 41000 | 598.09 | 334 | 328 | 68.0 |
| A | 13 | 254 | 5545 | 76.72 | 334 | 328 | 68.0 |
| A | 10 | 83 | 4653 | 63.6 | 334 | 328 | 68.0 |
| B | 5 | 172 | 482848 | 7656.36 | 327 | 319 | 63.0 |
| B | 5 | 255 | 148824 | 2356.35 | 327 | 319 | 63.0 |
| B | 4 | 81 | 22513 | 352.16 | 327 | 319 | 63.0 |
| C | 9 | 187 | 132249 | 1722.25 | 325 | 329 | 76.6 |
| C | 15 | 214 | 130096 | 1694.14 | 325 | 329 | 76.6 |
| C | 0 | 10 | 110852 | 1442.91 | 325 | 329 | 76.6 |
| D | 8 | 195 | 991990 | 11324.06 | 316 | 311 | 87.6 |
| D | 13 | 249 | 217950 | 2485.24 | 316 | 311 | 87.6 |
| D | 1 | 47 | 101898 | 1160.03 | 316 | 311 | 87.6 |
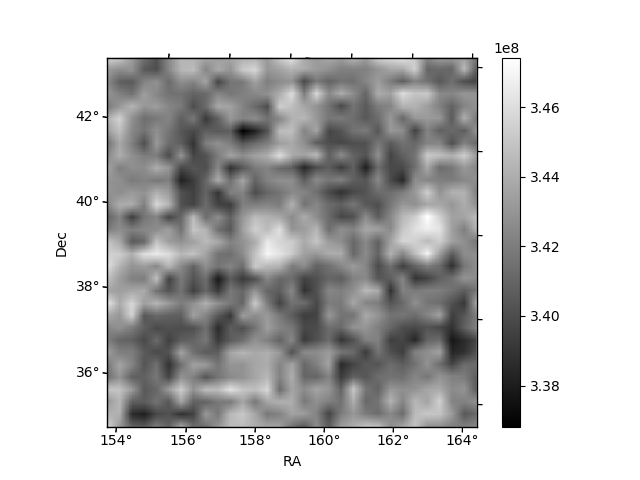
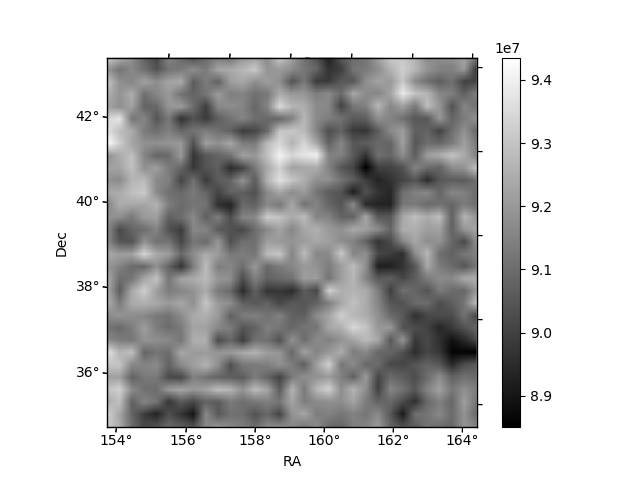
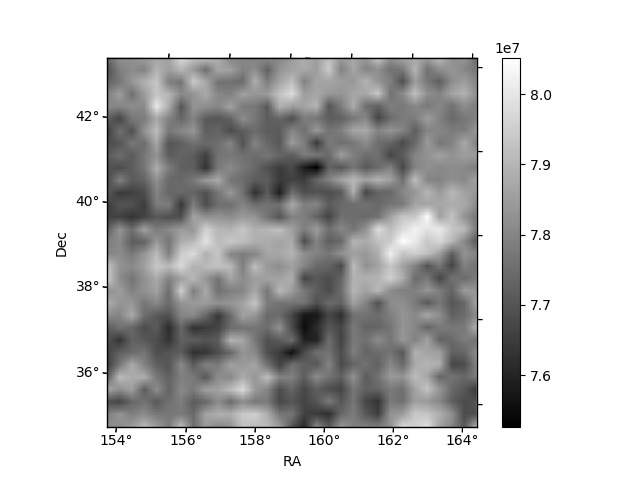
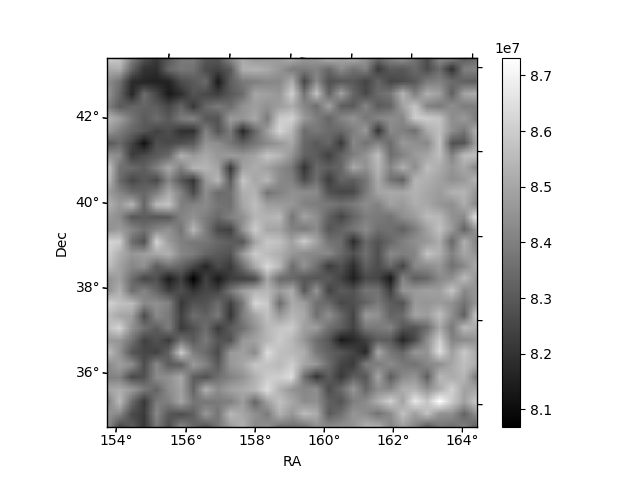
Histogram calculated using DETX and DETY for each event in the final _common_clean file
| Quadrant A | 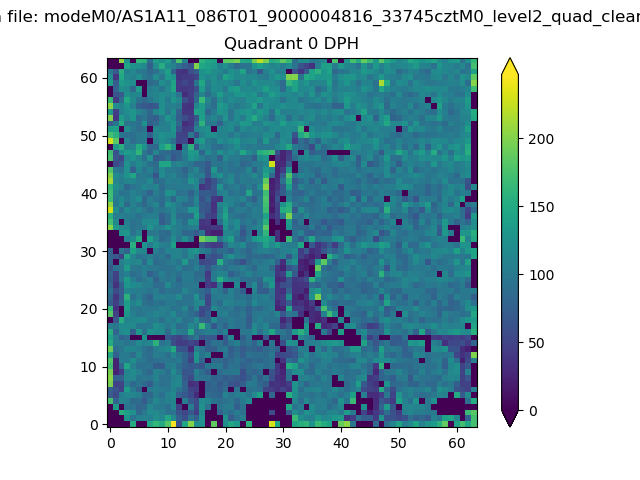 |
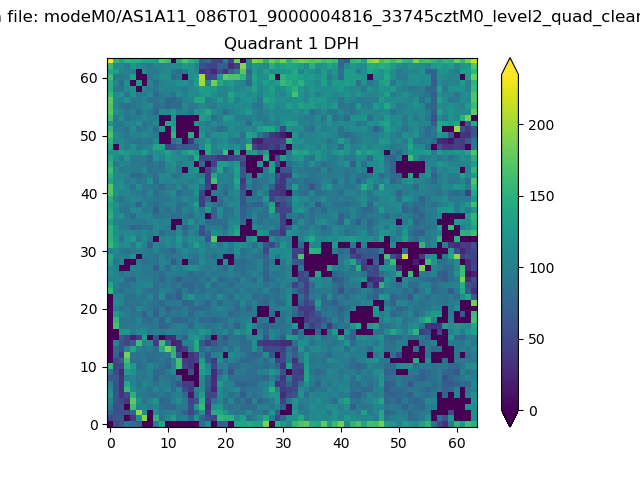 |
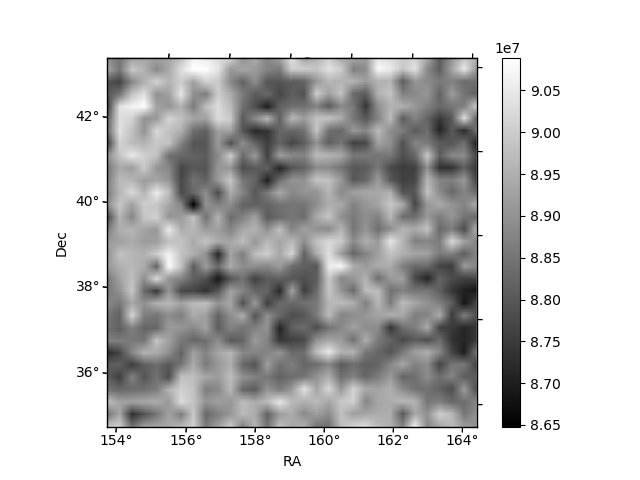
Quadrant B |
|---|---|---|---|
| Quadrant D | 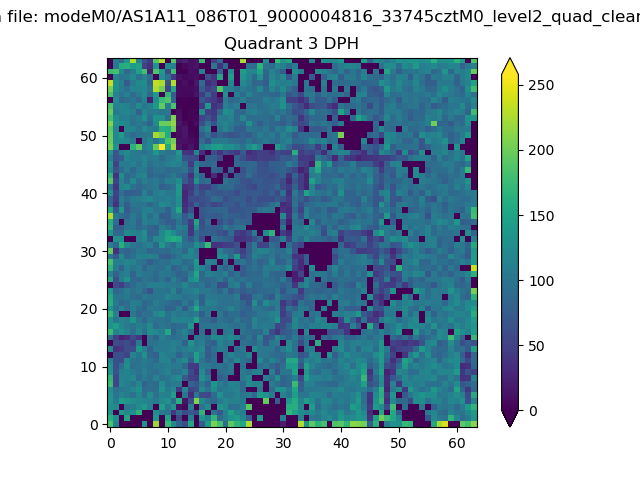 |
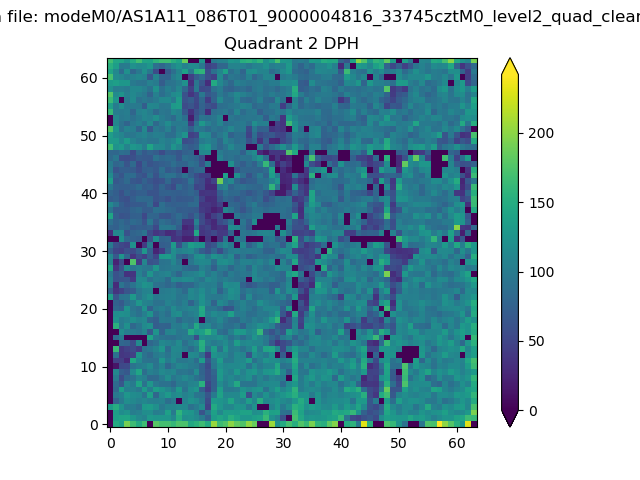 |
Quadrant C |
| Plot type | Count rate plots | Images |
|---|---|---|
| Comparison with Poisson distribution Blue bars denote a histogram of data divided into 1 sec bins. Red curve is a Poisson curve with rate = median count rate of data. |
 |
 |
| Quadrant-wise count rates Data is divided into 100 sec bins |
 |
|
| Module-wise count rates for Quadrant A Data is divided into 100 sec bins |
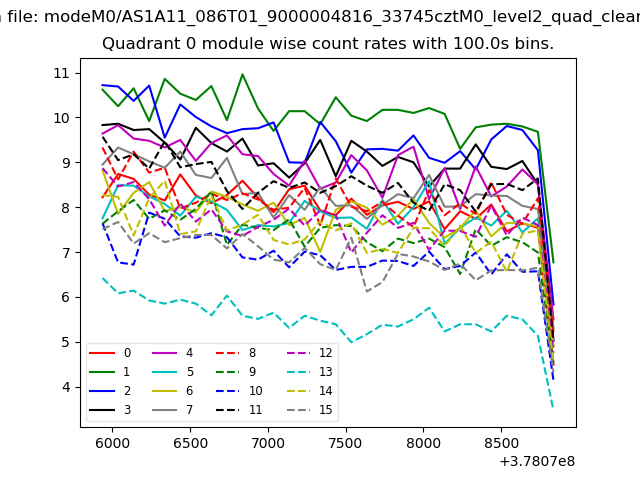 |
 |
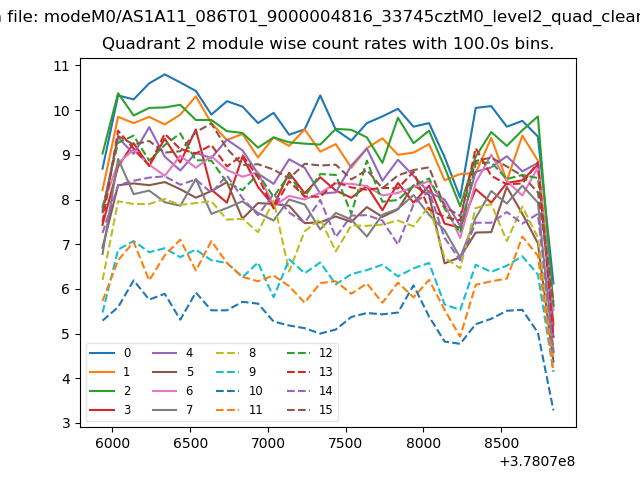
| Module-wise count rates for Quadrant B Data is divided into 100 sec bins |
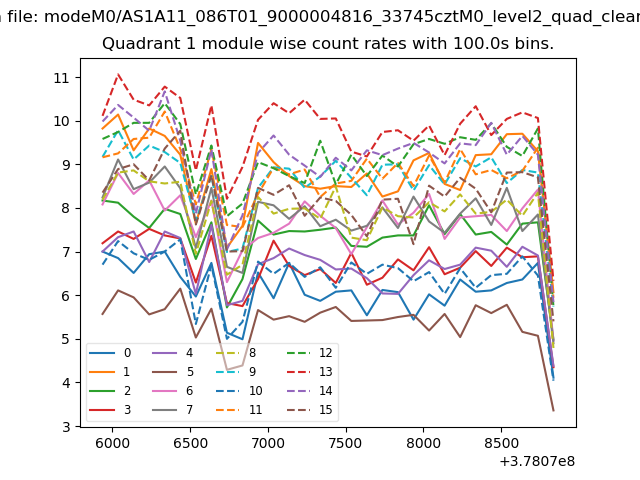 |
 |
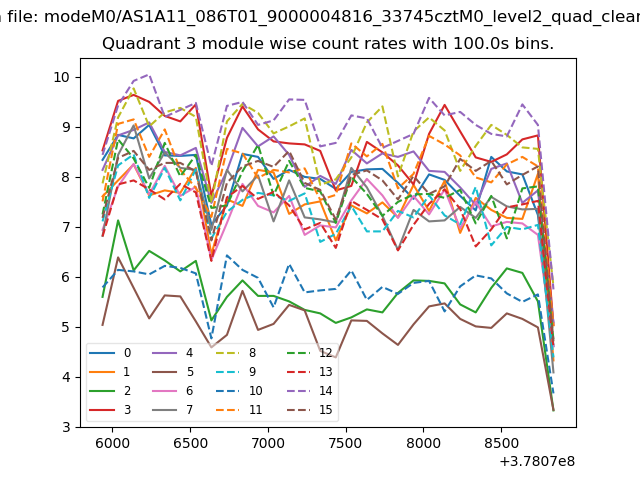
| Module-wise count rates for Quadrant C Data is divided into 100 sec bins |
 |
 |
| Module-wise count rates for Quadrant D Data is divided into 100 sec bins |
 |
 |
| Parameter | Plot |
|---|---|
| CZT HV Monitor | 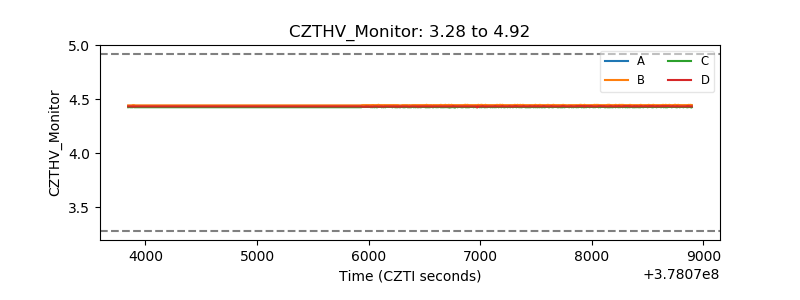 |
| D_VDD | 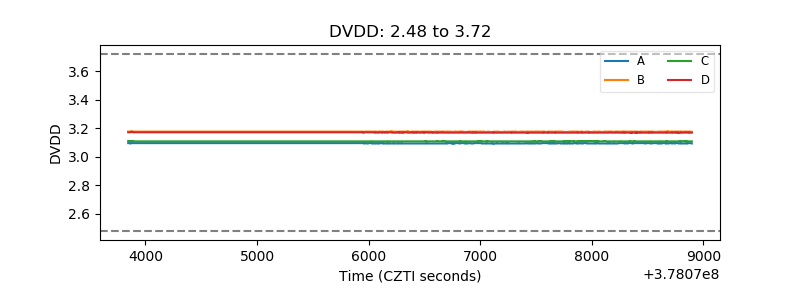 |
| Temperature 1 | 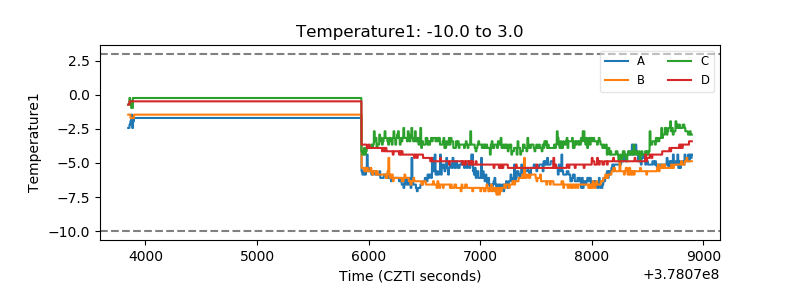 |
| Veto HV Monitor | 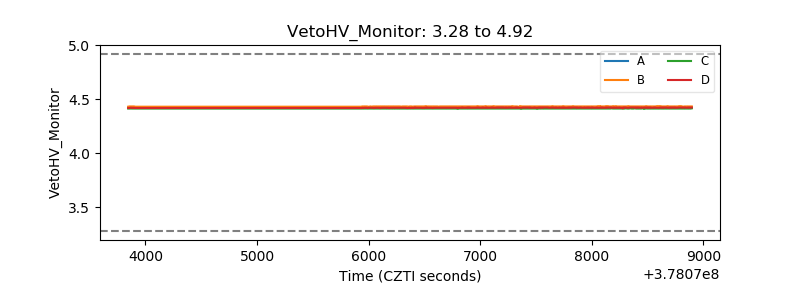 |
| Veto LLD | 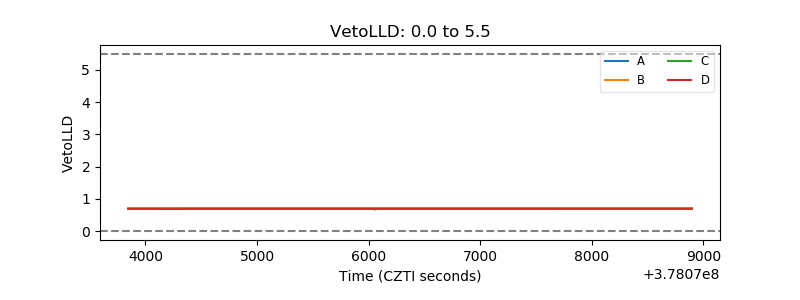 |
| Alpha Counter | 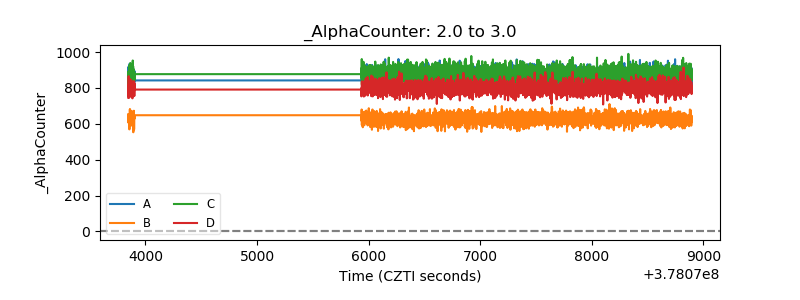 |
| _CPM_Rate |  |
| CZT Counter | 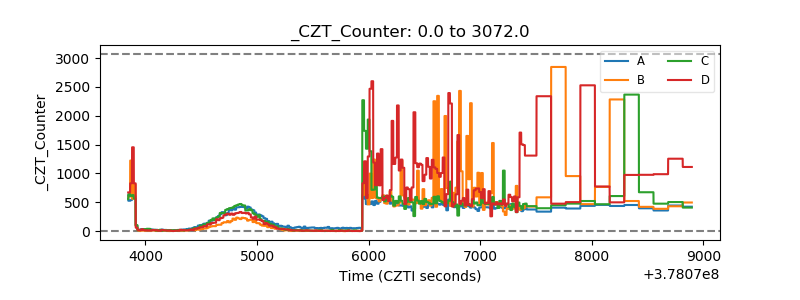 |
| +2.5 Volts monitor |  |
| +5 Volts monitor |  |
| _ROLL_ROT | 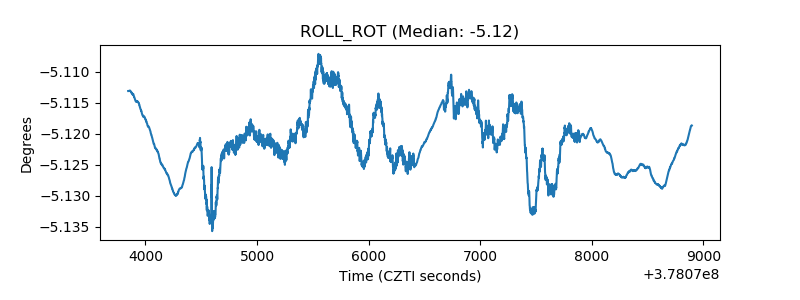 |
| _Roll_DEC | 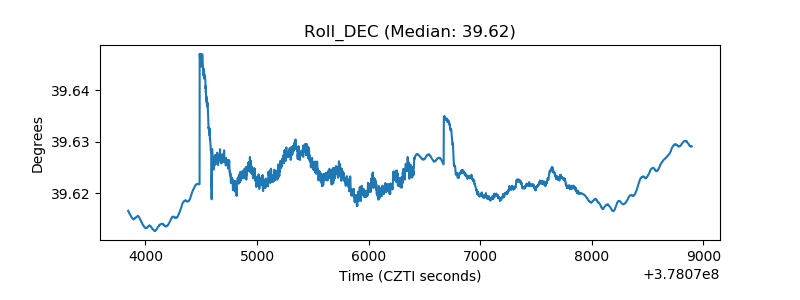 |
| _Roll_RA | 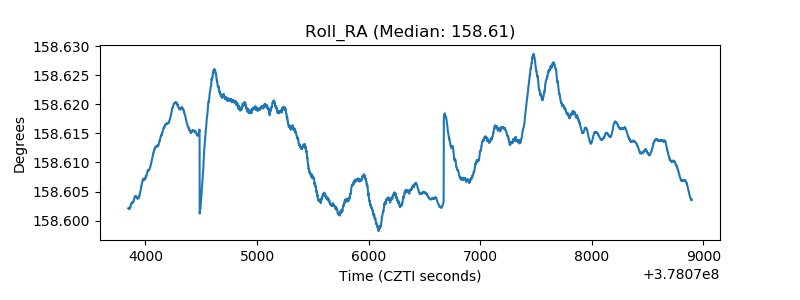 |
| Veto Counter | 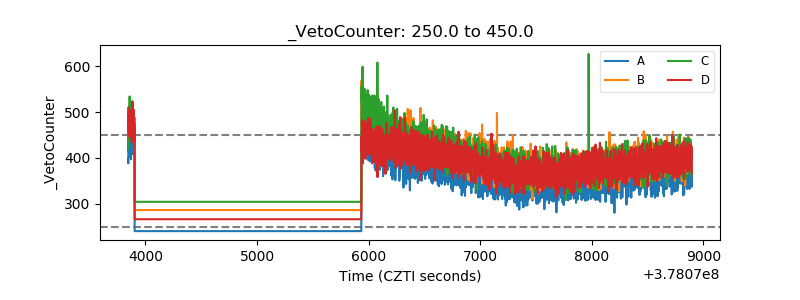 |