| Param | Original file | Final file |
|---|---|---|
| Filename | modeM0/AS1T04_088T01_9000004814cztM0_level2.fits | modeM0/AS1T04_088T01_9000004814cztM0_level2_quad_clean.evt |
| Size (bytes) | 277,560,000 | 245,436,480 |
| Size | 264.7 MB | 234.1 MB |
| Events in quadrant A | 1,742,394 | 1,459,271 |
| Events in quadrant B | 1,614,790 | 1,412,110 |
| Events in quadrant C | 1,729,352 | 1,427,378 |
| Events in quadrant D | 1,452,384 | 1,266,776 |
| Mode SS | |||
|---|---|---|---|
| Quadrant | BADHDUFLAG | Total packets | Discarded packets |
| A | 0 | 552 | 0 |
| B | 0 | 552 | 0 |
| C | 0 | 552 | 0 |
| D | 0 | 552 | 0 |
| Mode M0 | |||
|---|---|---|---|
| Quadrant | BADHDUFLAG | Total packets | Discarded packets |
| A | 0 | 62530 | 0 |
| B | 0 | 77985 | 0 |
| C | 0 | 63898 | 0 |
| D | 0 | 94069 | 0 |
| Mode M9 | |||
|---|---|---|---|
| Quadrant | BADHDUFLAG | Total packets | Discarded packets |
| A | 0 | 131 | 0 |
| B | 0 | 131 | 0 |
| C | 0 | 131 | 0 |
| D | 0 | 131 | 0 |
| Quadrant | Total seconds | Saturated seconds | Saturation percentage |
|---|---|---|---|
| A | 27148 | 654 | 2.409017% |
| B | 27148 | 2120 | 7.809047% |
| C | 27148 | 405 | 1.491823% |
| D | 27148 | 1172 | 4.317077% |
Noise dominated data is calculated using 1-second bins in cleaned event files. If a bin has >2000 counts, and if more than 50% of those come from <1% of pixels, then it is considered to be noise-dominated and hence unusable.
| Quadrant | # 1 sec bins | Bins with >0 counts | Bins with >2000 counts | High rate bins dominated by noise | Noise dominated (total time) | Noise dominated (detector-on time) | Marked lightcurve |
|---|---|---|---|---|---|---|---|
| A | 38893 | 27106 | 0 | 0 | 0.00% | 0.00% | 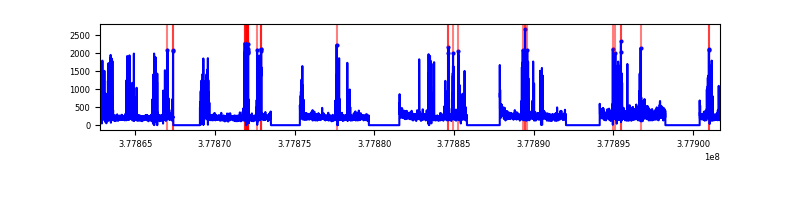 |
| B | 38893 | 27116 | 0 | 0 | 0.00% | 0.00% | 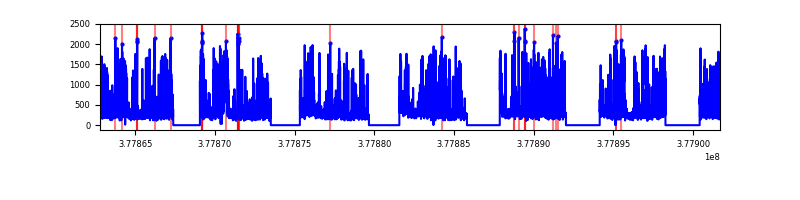 |
| C | 38895 | 27129 | 0 | 0 | 0.00% | 0.00% |  |
| D | 38895 | 27131 | 0 | 0 | 0.00% | 0.00% | 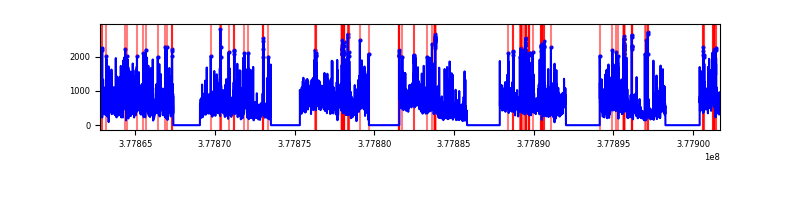 |
Top three noisy pixels from each quadrant. If the there are fewer than three noisy pixels in the level2.evt file, extra rows are filled as -1
| Pixel properties | Quadrant properties | ||||||
|---|---|---|---|---|---|---|---|
| Quadrant | DetID | PixID | Counts | Sigma | Mean | Median | Sigma |
| A | 9 | 19 | 1412 | 8.79 | 455 | 432 | 111.5 |
| A | 7 | 110 | 1380 | 8.5 | 455 | 432 | 111.5 |
| A | 14 | 95 | 1332 | 8.07 | 455 | 432 | 111.5 |
| B | 2 | 9 | 1312 | 10.59 | 428 | 412 | 84.9 |
| B | 3 | 80 | 1303 | 10.49 | 428 | 412 | 84.9 |
| B | 5 | 128 | 1146 | 8.64 | 428 | 412 | 84.9 |
| C | 1 | 81 | 1458 | 8.82 | 458 | 436 | 115.9 |
| C | 1 | 80 | 1361 | 7.98 | 458 | 436 | 115.9 |
| C | 3 | 203 | 1320 | 7.63 | 458 | 436 | 115.9 |
| D | 10 | 189 | 1109 | 6.68 | 416 | 382 | 108.7 |
| D | 10 | 113 | 1064 | 6.27 | 416 | 382 | 108.7 |
| D | 7 | 3 | 1057 | 6.21 | 416 | 382 | 108.7 |
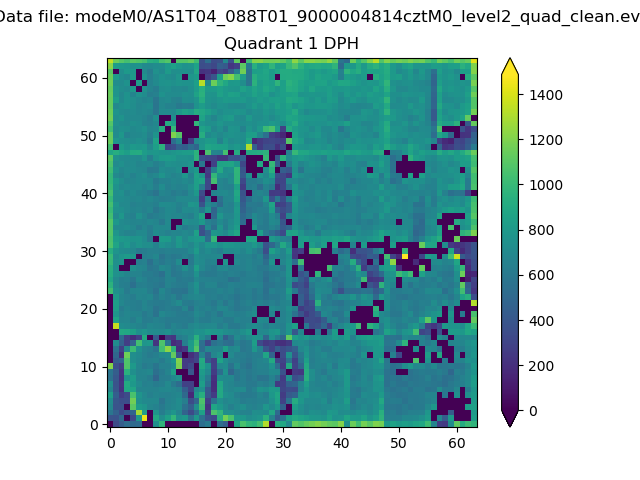
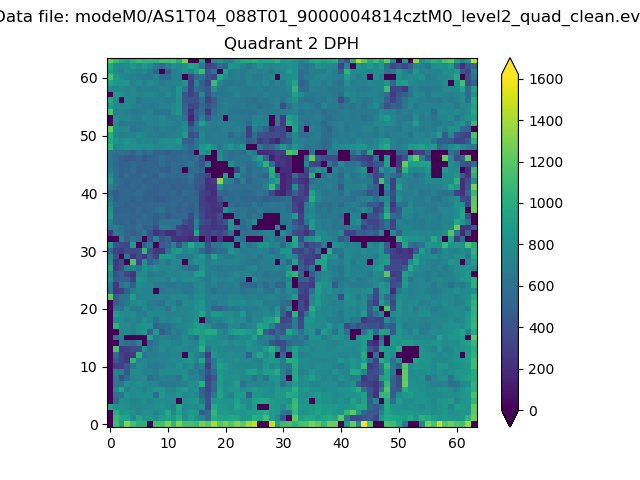
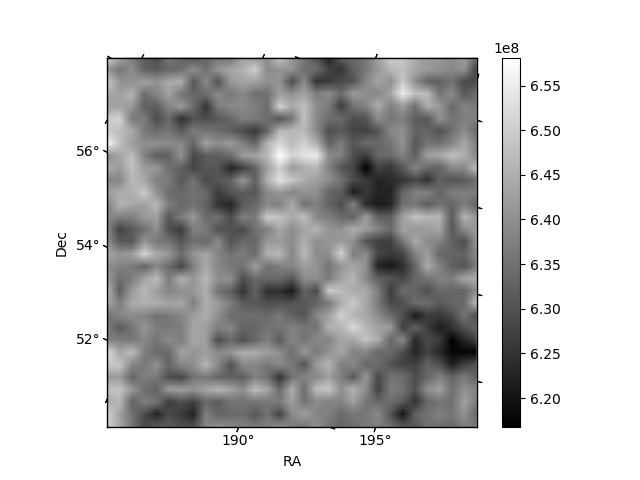
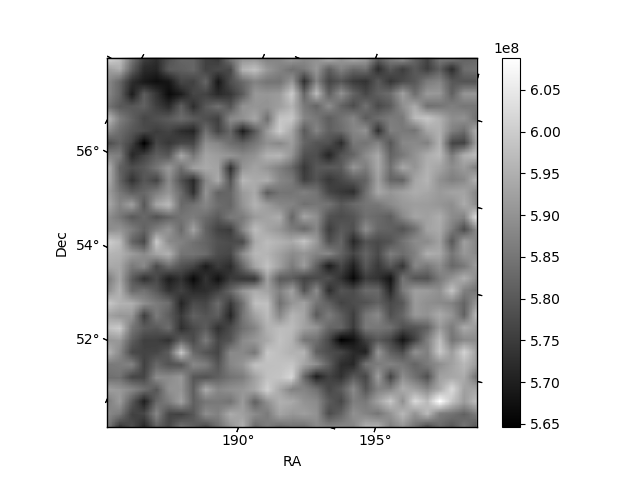
Histogram calculated using DETX and DETY for each event in the final _common_clean file
| Quadrant A | 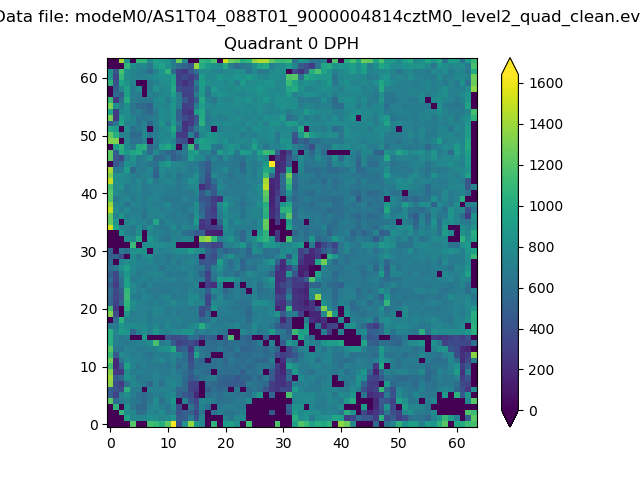 |
 |
Quadrant B |
|---|---|---|---|
| Quadrant D | 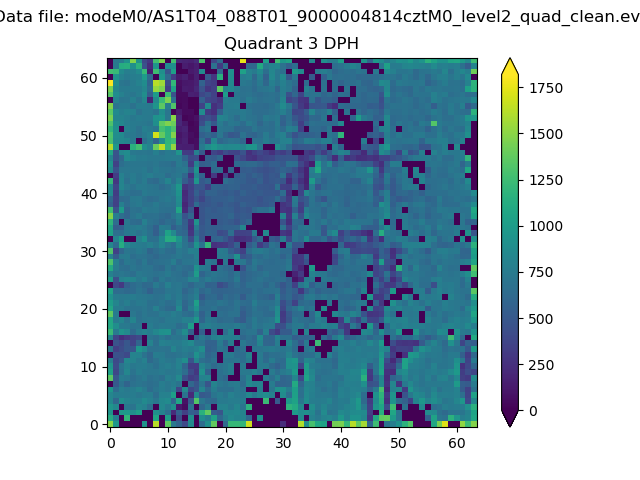 |
 |
Quadrant C |
| Plot type | Count rate plots | Images |
|---|---|---|
| Comparison with Poisson distribution Blue bars denote a histogram of data divided into 1 sec bins. Red curve is a Poisson curve with rate = median count rate of data. |
 |
 |
| Quadrant-wise count rates Data is divided into 100 sec bins |
 |
|
| Module-wise count rates for Quadrant A Data is divided into 100 sec bins |
 |
 |
| Module-wise count rates for Quadrant B Data is divided into 100 sec bins |
 |
 |
| Module-wise count rates for Quadrant C Data is divided into 100 sec bins |
 |
 |
| Module-wise count rates for Quadrant D Data is divided into 100 sec bins |
 |
 |
| Parameter | Plot |
|---|---|
| CZT HV Monitor |  |
| D_VDD | 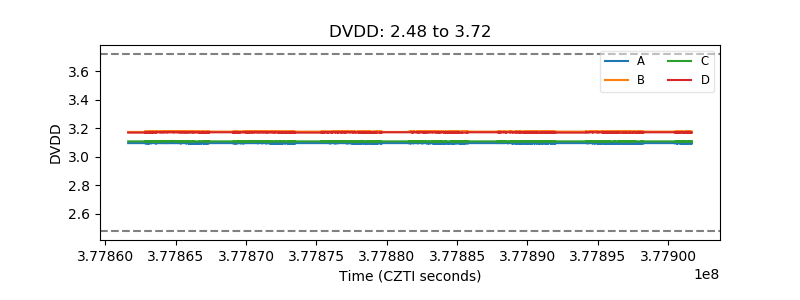 |
| Temperature 1 |  |
| Veto HV Monitor |  |
| Veto LLD | 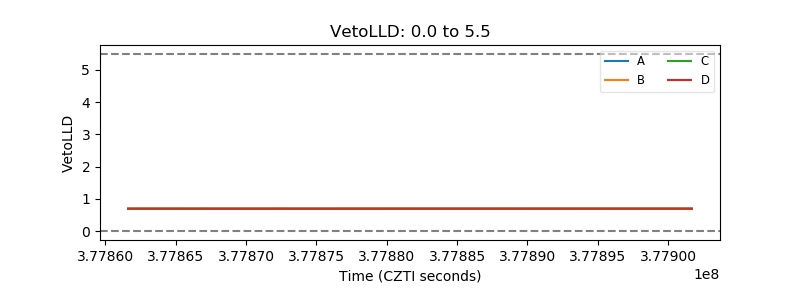 |
| Alpha Counter |  |
| _CPM_Rate | 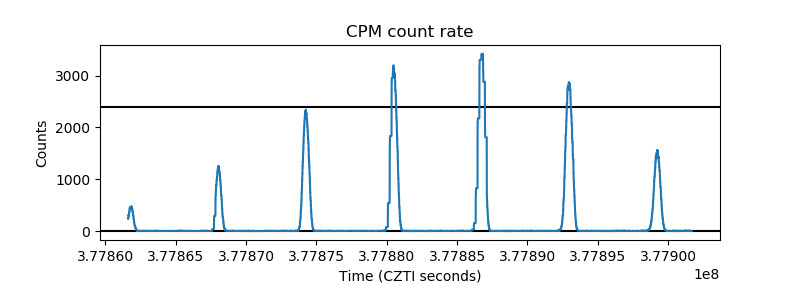 |
| CZT Counter |  |
| +2.5 Volts monitor | 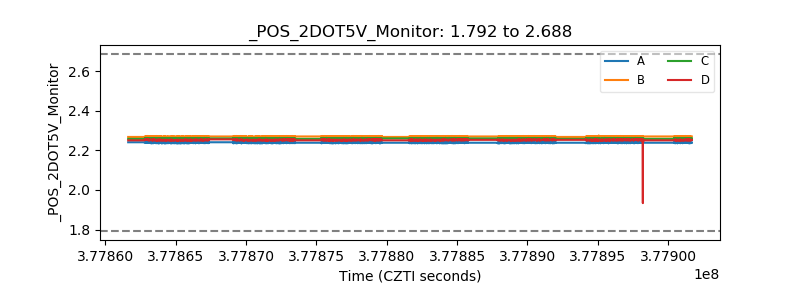 |
| +5 Volts monitor | 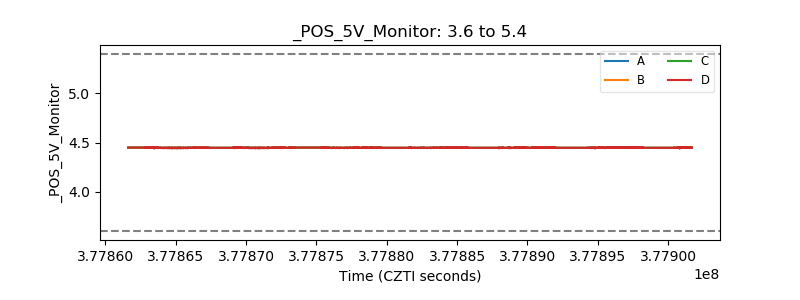 |
| _ROLL_ROT | 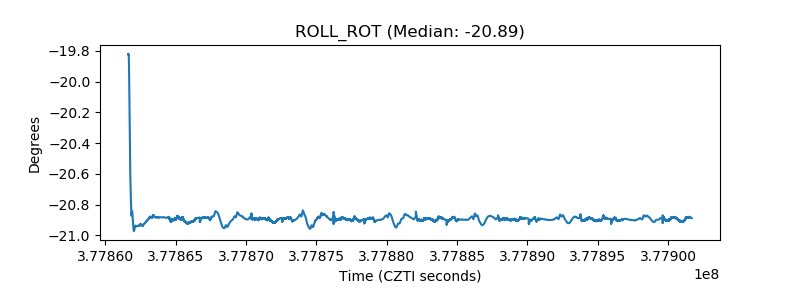 |
| _Roll_DEC | 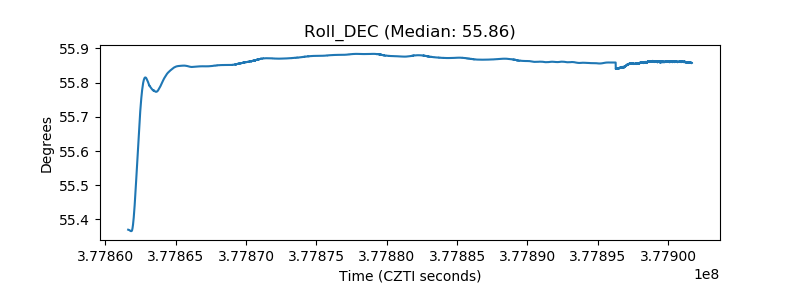 |
| _Roll_RA | 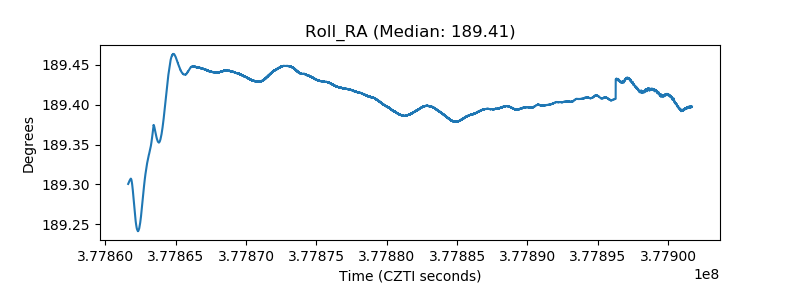 |
| Veto Counter | 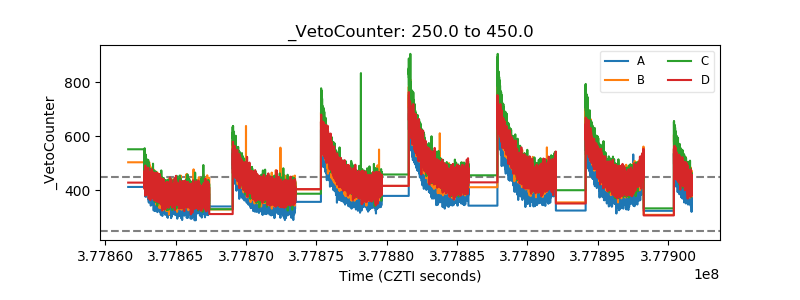 |