| Param | Original file | Final file |
|---|---|---|
| Filename | modeM0/AS1T04_088T01_9000004814_33711cztM0_level2.evt | modeM0/AS1T04_088T01_9000004814_33711cztM0_level2_quad_clean.evt |
| Size (bytes) | 534,329,280 | 58,775,040 |
| Size | 509.6 MB | 56.1 MB |
| Events in quadrant A | 2,898,600 | 356,095 |
| Events in quadrant B | 3,620,045 | 356,789 |
| Events in quadrant C | 3,413,611 | 355,202 |
| Events in quadrant D | 5,884,863 | 333,163 |
| Mode SS | |||
|---|---|---|---|
| Quadrant | BADHDUFLAG | Total packets | Discarded packets |
| A | 0 | 110 | 0 |
| B | 0 | 110 | 0 |
| C | 0 | 110 | 0 |
| D | 0 | 110 | 0 |
| Mode M0 | |||
|---|---|---|---|
| Quadrant | BADHDUFLAG | Total packets | Discarded packets |
| A | 0 | 12046 | 2 |
| B | 0 | 14295 | 1 |
| C | 0 | 13530 | 1 |
| D | 0 | 21306 | 1 |
| Mode M9 | |||
|---|---|---|---|
| Quadrant | BADHDUFLAG | Total packets | Discarded packets |
| A | 0 | 25 | 0 |
| B | 0 | 25 | 0 |
| C | 0 | 25 | 0 |
| D | 0 | 26 | 0 |
| Quadrant | Total seconds | Saturated seconds | Saturation percentage |
|---|---|---|---|
| A | 5398 | 56 | 1.037421% |
| B | 5398 | 176 | 3.260467% |
| C | 5398 | 123 | 2.278622% |
| D | 5398 | 273 | 5.057429% |
Noise dominated data is calculated using 1-second bins in cleaned event files. If a bin has >2000 counts, and if more than 50% of those come from <1% of pixels, then it is considered to be noise-dominated and hence unusable.
| Quadrant | # 1 sec bins | Bins with >0 counts | Bins with >2000 counts | High rate bins dominated by noise | Noise dominated (total time) | Noise dominated (detector-on time) | Marked lightcurve |
|---|---|---|---|---|---|---|---|
| A | 7310 | 5399 | 33 | 33 | 0.45% | 0.61% |  |
| B | 7310 | 5399 | 122 | 122 | 1.67% | 2.26% | 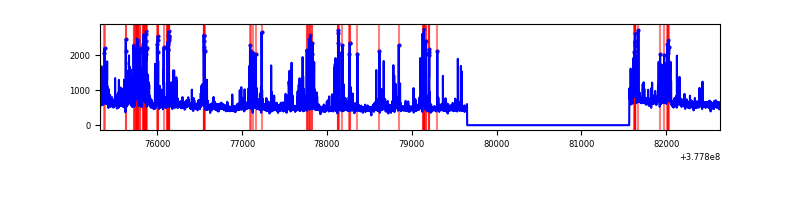 |
| C | 7310 | 5398 | 97 | 97 | 1.33% | 1.80% | 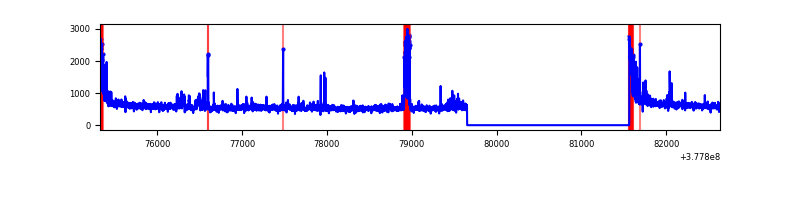 |
| D | 7310 | 5399 | 233 | 233 | 3.19% | 4.32% | 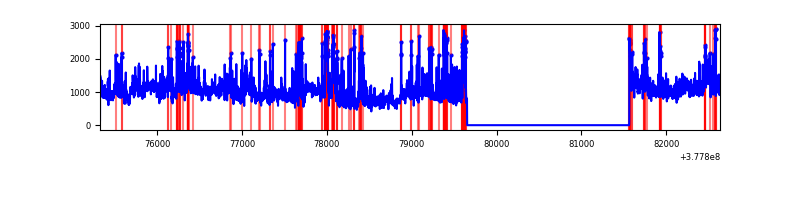 |
Top three noisy pixels from each quadrant. If the there are fewer than three noisy pixels in the level2.evt file, extra rows are filled as -1
| Pixel properties | Quadrant properties | ||||||
|---|---|---|---|---|---|---|---|
| Quadrant | DetID | PixID | Counts | Sigma | Mean | Median | Sigma |
| A | 15 | 237 | 182990 | 1323.69 | 693 | 680 | 137.7 |
| A | 14 | 4 | 17086 | 119.12 | 693 | 680 | 137.7 |
| A | 13 | 6 | 16330 | 113.63 | 693 | 680 | 137.7 |
| B | 5 | 172 | 622144 | 4901.41 | 683 | 669 | 126.8 |
| B | 0 | 219 | 68614 | 535.86 | 683 | 669 | 126.8 |
| B | 5 | 255 | 63351 | 494.36 | 683 | 669 | 126.8 |
| C | 15 | 214 | 248103 | 1608.04 | 676 | 683 | 153.9 |
| C | 0 | 10 | 196309 | 1271.42 | 676 | 683 | 153.9 |
| C | 14 | 254 | 161970 | 1048.24 | 676 | 683 | 153.9 |
| D | 1 | 52 | 1337493 | 7634.85 | 669 | 654 | 175.1 |
| D | 8 | 195 | 875622 | 4997.05 | 669 | 654 | 175.1 |
| D | 2 | 120 | 267821 | 1525.82 | 669 | 654 | 175.1 |
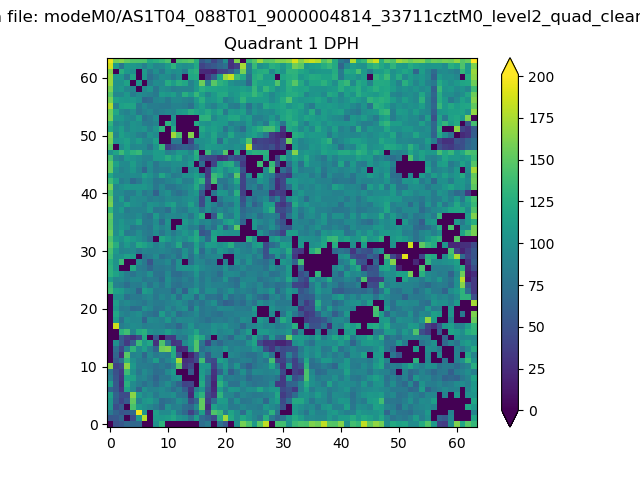
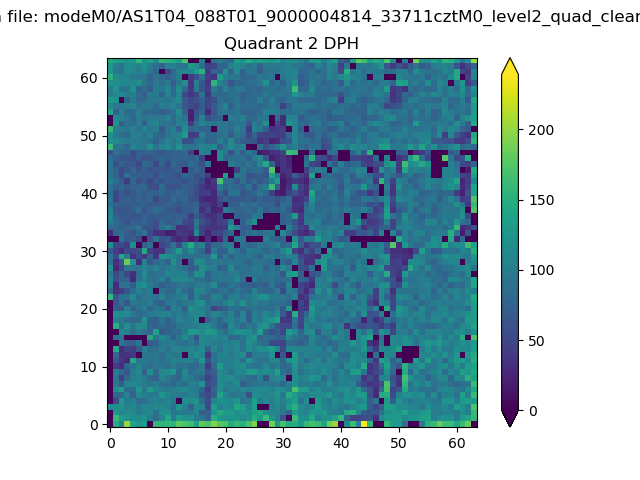
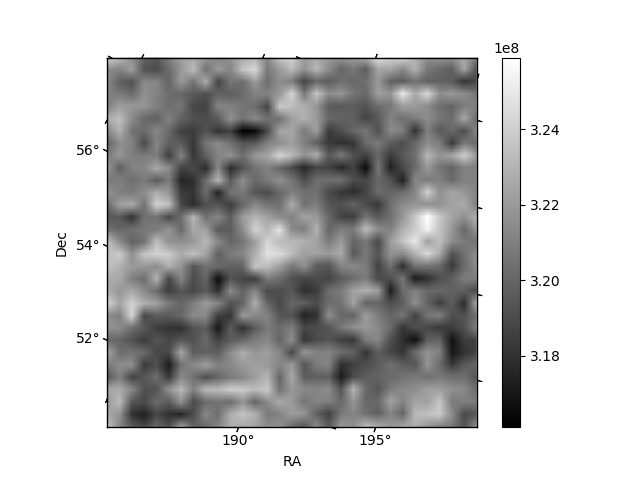
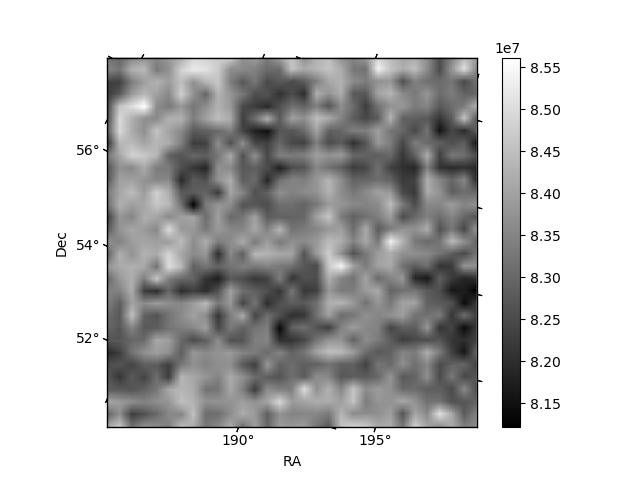
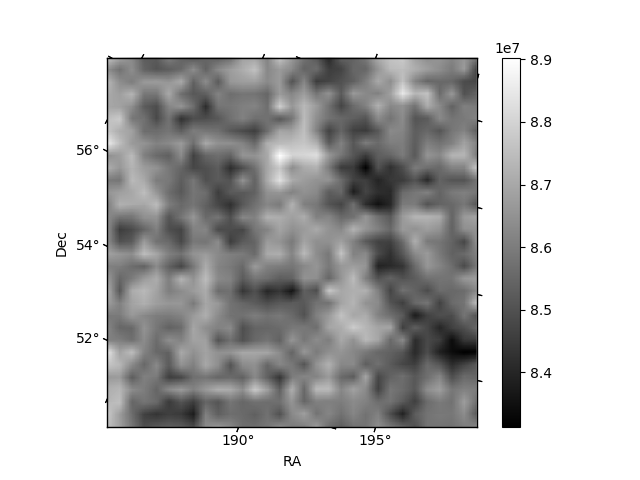
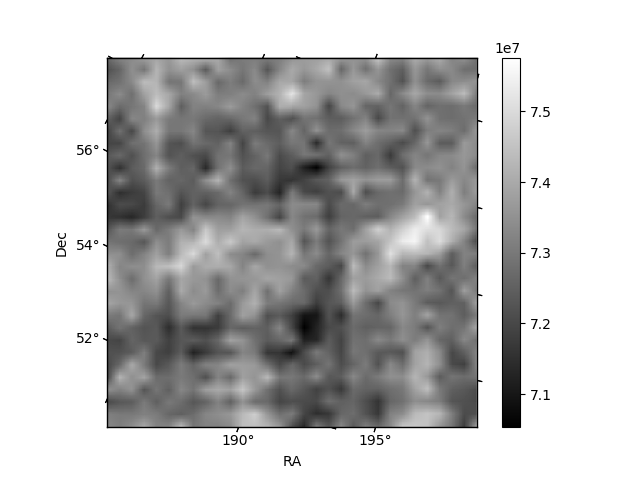
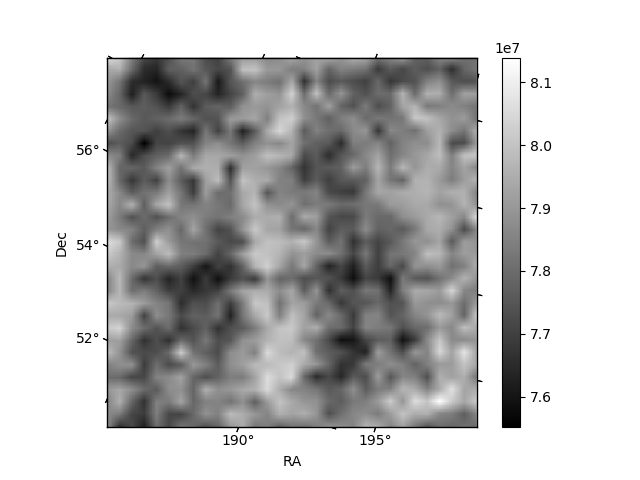
Histogram calculated using DETX and DETY for each event in the final _common_clean file
| Quadrant A | 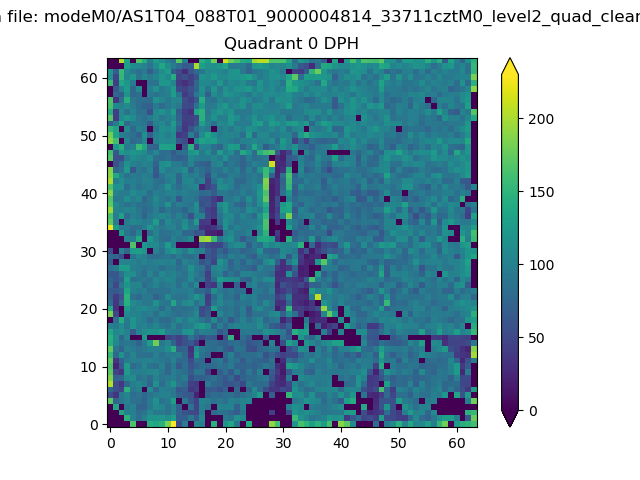 |
 |
Quadrant B |
|---|---|---|---|
| Quadrant D | 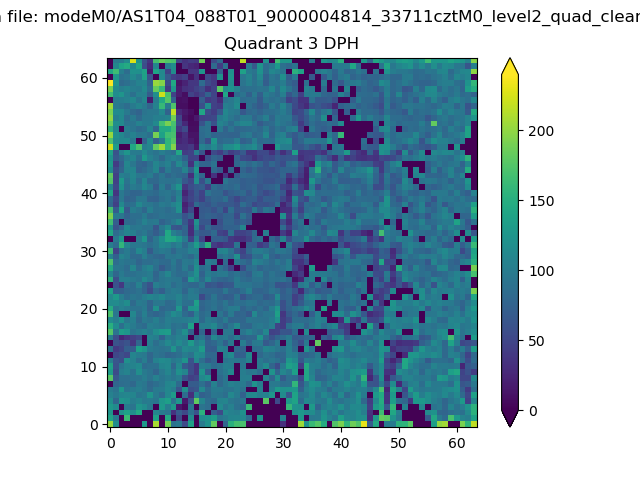 |
 |
Quadrant C |
| Plot type | Count rate plots | Images |
|---|---|---|
| Comparison with Poisson distribution Blue bars denote a histogram of data divided into 1 sec bins. Red curve is a Poisson curve with rate = median count rate of data. |
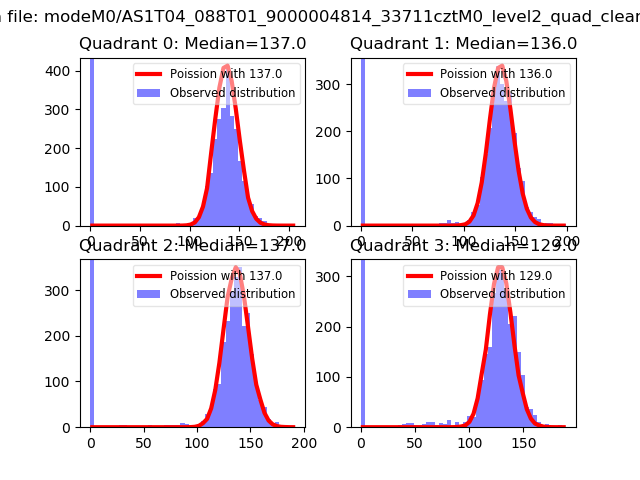 |
 |
| Quadrant-wise count rates Data is divided into 100 sec bins |
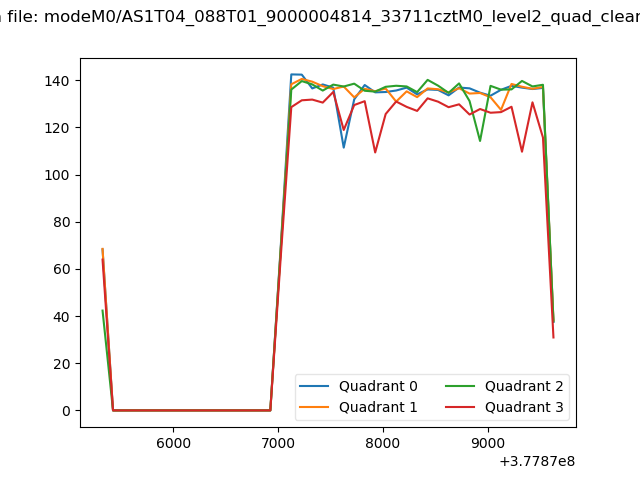 |
|
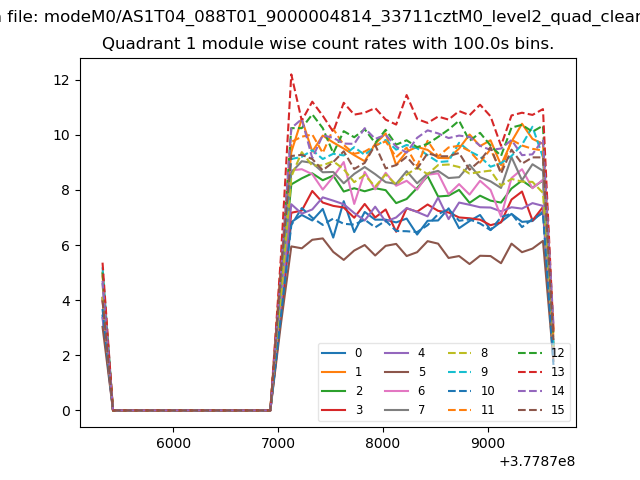
| Module-wise count rates for Quadrant A Data is divided into 100 sec bins |
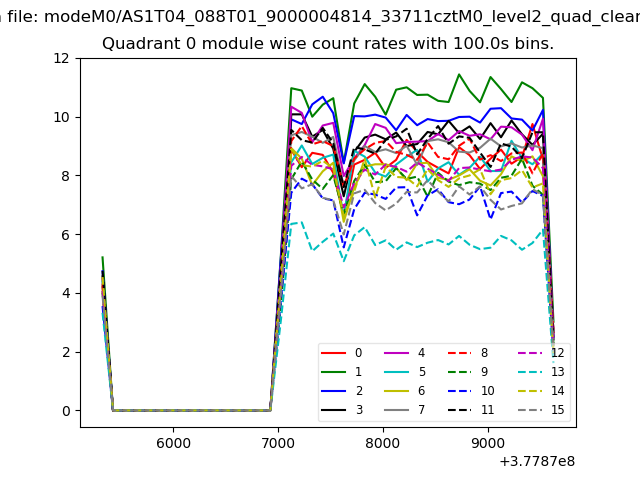 |
 |
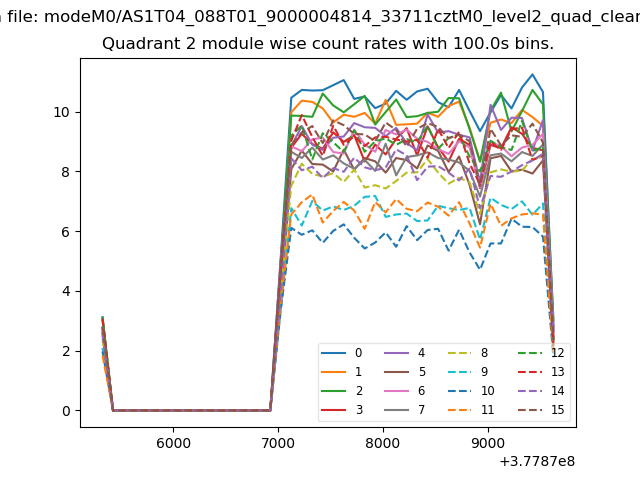
| Module-wise count rates for Quadrant B Data is divided into 100 sec bins |
 |
 |
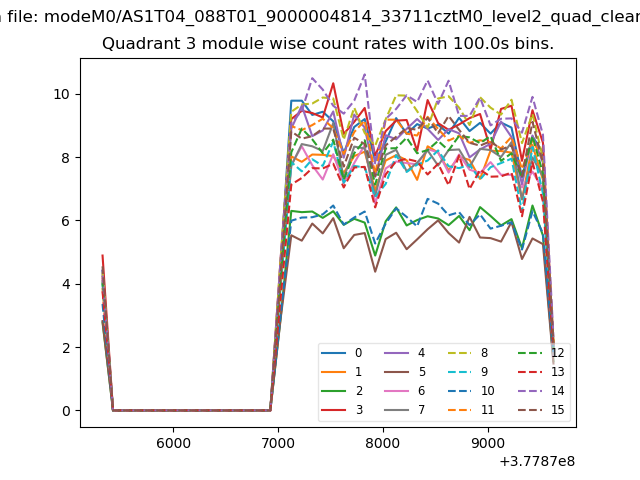
| Module-wise count rates for Quadrant C Data is divided into 100 sec bins |
 |
 |
| Module-wise count rates for Quadrant D Data is divided into 100 sec bins |
 |
 |
| Parameter | Plot |
|---|---|
| CZT HV Monitor | 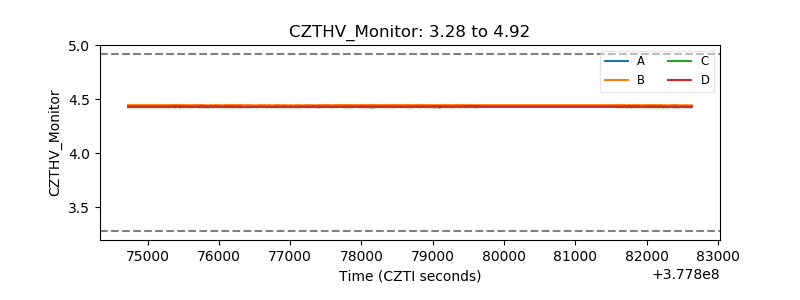 |
| D_VDD |  |
| Temperature 1 | 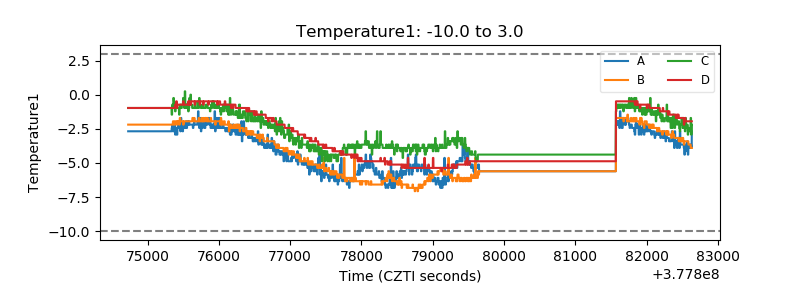 |
| Veto HV Monitor | 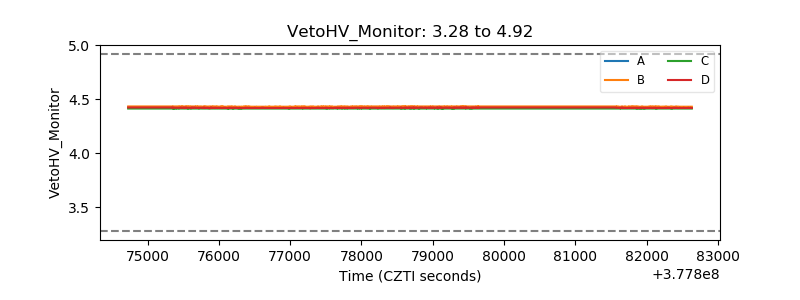 |
| Veto LLD | 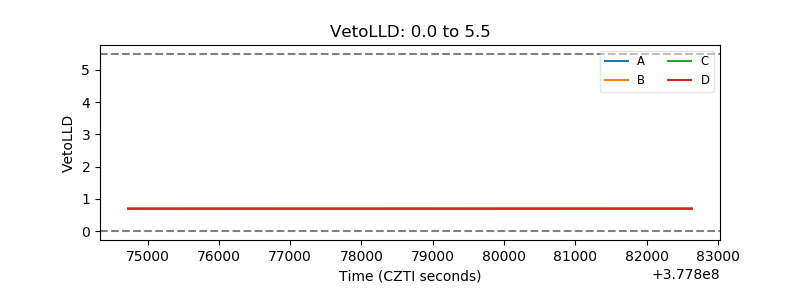 |
| Alpha Counter | 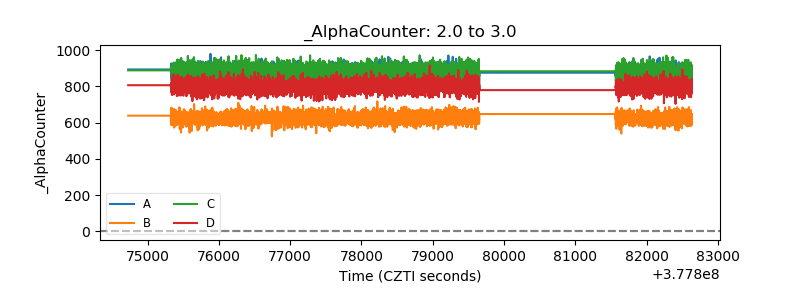 |
| _CPM_Rate | 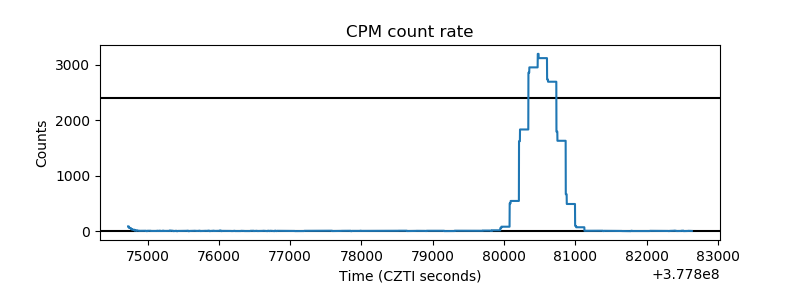 |
| CZT Counter | 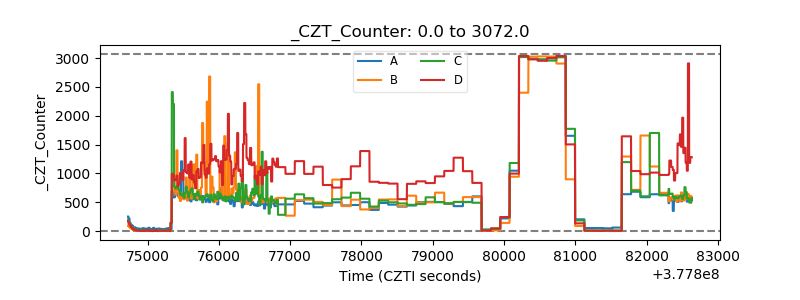 |
| +2.5 Volts monitor |  |
| +5 Volts monitor |  |
| _ROLL_ROT | 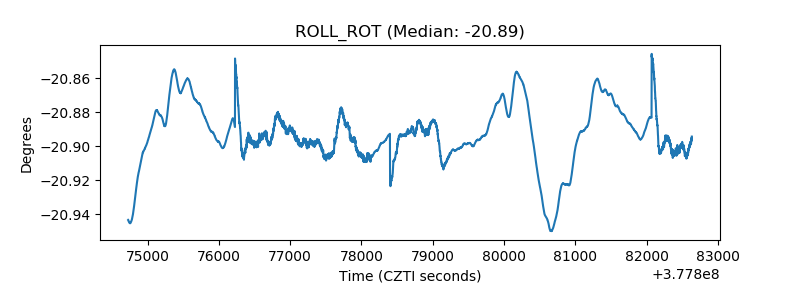 |
| _Roll_DEC | 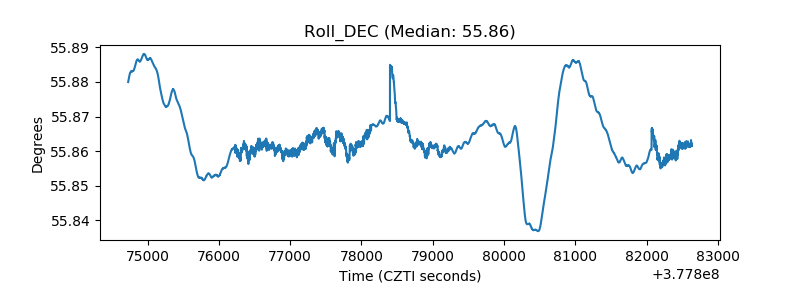 |
| _Roll_RA | 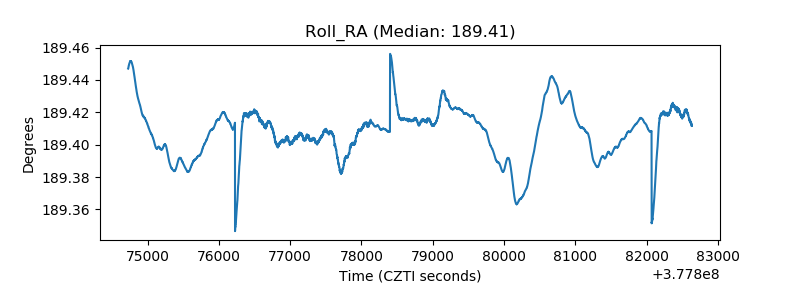 |
| Veto Counter | 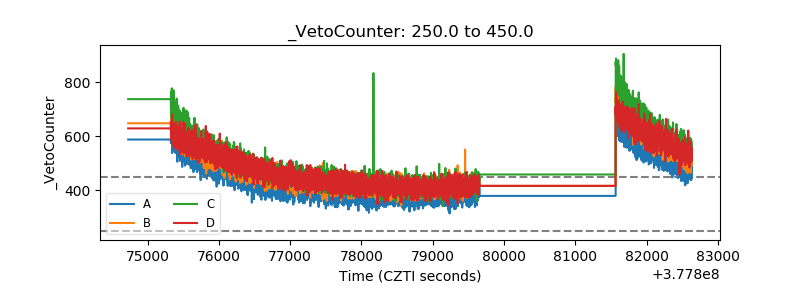 |