| Param | Original file | Final file |
|---|---|---|
| Filename | modeM0/AS1T04_088T01_9000004814_33712cztM0_level2.evt | modeM0/AS1T04_088T01_9000004814_33712cztM0_level2_quad_clean.evt |
| Size (bytes) | 488,764,800 | 65,344,320 |
| Size | 466.1 MB | 62.3 MB |
| Events in quadrant A | 2,913,725 | 409,336 |
| Events in quadrant B | 3,746,257 | 402,128 |
| Events in quadrant C | 3,139,753 | 418,918 |
| Events in quadrant D | 4,662,747 | 396,158 |
| Mode SS | |||
|---|---|---|---|
| Quadrant | BADHDUFLAG | Total packets | Discarded packets |
| A | 0 | 102 | 0 |
| B | 0 | 102 | 0 |
| C | 0 | 102 | 0 |
| D | 0 | 102 | 0 |
| Mode M0 | |||
|---|---|---|---|
| Quadrant | BADHDUFLAG | Total packets | Discarded packets |
| A | 0 | 11924 | 3 |
| B | 0 | 14466 | 2 |
| C | 0 | 12551 | 2 |
| D | 0 | 17310 | 2 |
| Mode M9 | |||
|---|---|---|---|
| Quadrant | BADHDUFLAG | Total packets | Discarded packets |
| A | 0 | 26 | 0 |
| B | 0 | 26 | 0 |
| C | 0 | 26 | 0 |
| D | 0 | 27 | 0 |
| Quadrant | Total seconds | Saturated seconds | Saturation percentage |
|---|---|---|---|
| A | 5019 | 76 | 1.514246% |
| B | 5019 | 314 | 6.256226% |
| C | 5019 | 89 | 1.773262% |
| D | 5019 | 172 | 3.426977% |
Noise dominated data is calculated using 1-second bins in cleaned event files. If a bin has >2000 counts, and if more than 50% of those come from <1% of pixels, then it is considered to be noise-dominated and hence unusable.
| Quadrant | # 1 sec bins | Bins with >0 counts | Bins with >2000 counts | High rate bins dominated by noise | Noise dominated (total time) | Noise dominated (detector-on time) | Marked lightcurve |
|---|---|---|---|---|---|---|---|
| A | 7082 | 5020 | 53 | 53 | 0.75% | 1.06% | 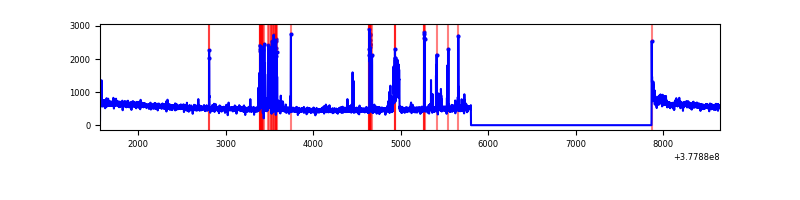 |
| B | 7082 | 5020 | 229 | 229 | 3.23% | 4.56% | 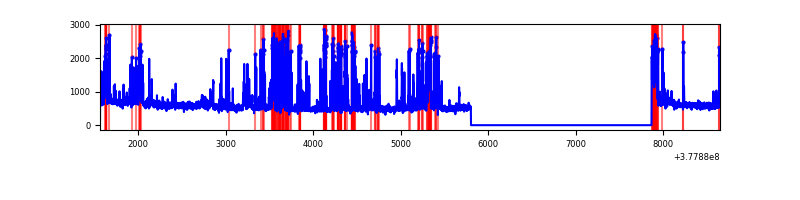 |
| C | 7082 | 5020 | 62 | 62 | 0.88% | 1.24% | 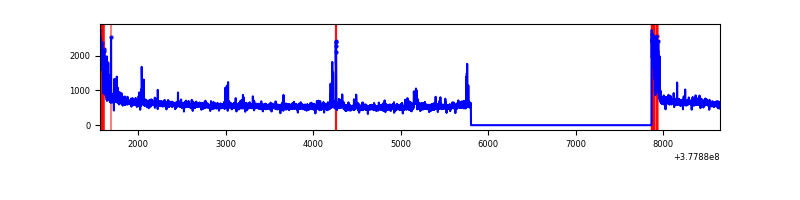 |
| D | 7082 | 5020 | 132 | 132 | 1.86% | 2.63% |  |
Top three noisy pixels from each quadrant. If the there are fewer than three noisy pixels in the level2.evt file, extra rows are filled as -1
| Pixel properties | Quadrant properties | ||||||
|---|---|---|---|---|---|---|---|
| Quadrant | DetID | PixID | Counts | Sigma | Mean | Median | Sigma |
| A | 15 | 237 | 299618 | 2317.53 | 658 | 648 | 129.0 |
| A | 14 | 4 | 56176 | 430.43 | 658 | 648 | 129.0 |
| A | 13 | 6 | 9657 | 69.83 | 658 | 648 | 129.0 |
| B | 5 | 172 | 952280 | 7998.86 | 646 | 632 | 119.0 |
| B | 5 | 255 | 66007 | 549.49 | 646 | 632 | 119.0 |
| B | 0 | 219 | 52681 | 437.49 | 646 | 632 | 119.0 |
| C | 15 | 214 | 233191 | 1587.35 | 649 | 659 | 146.5 |
| C | 0 | 10 | 220446 | 1500.34 | 649 | 659 | 146.5 |
| C | 14 | 67 | 57099 | 385.28 | 649 | 659 | 146.5 |
| D | 1 | 52 | 966817 | 5789.43 | 643 | 633 | 166.9 |
| D | 8 | 195 | 540803 | 3236.73 | 643 | 633 | 166.9 |
| D | 13 | 249 | 163255 | 974.44 | 643 | 633 | 166.9 |
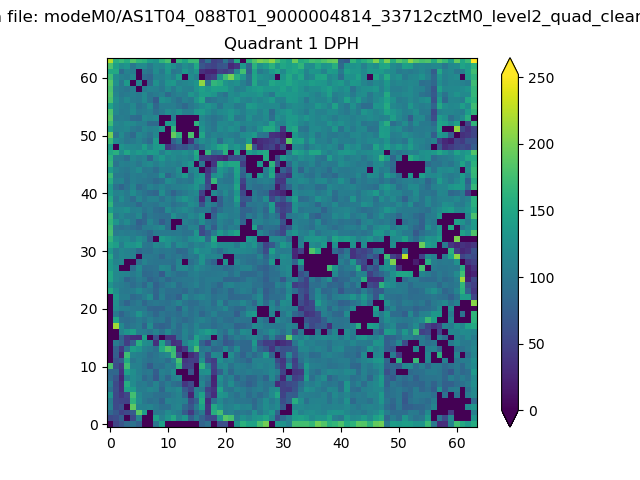
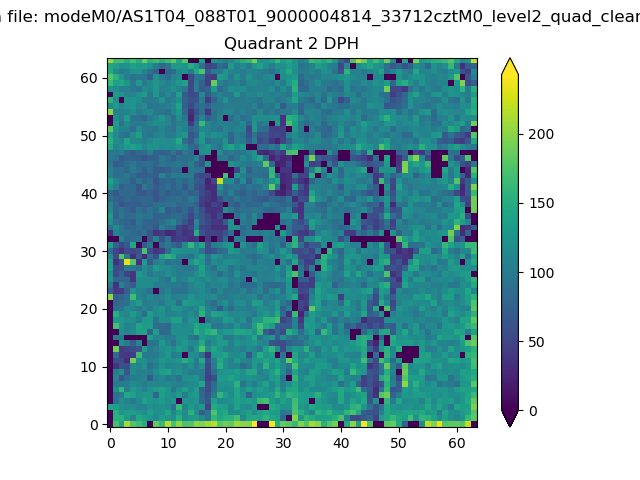
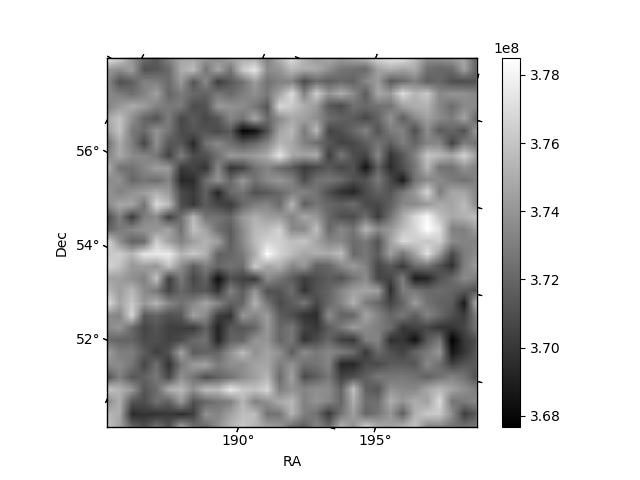
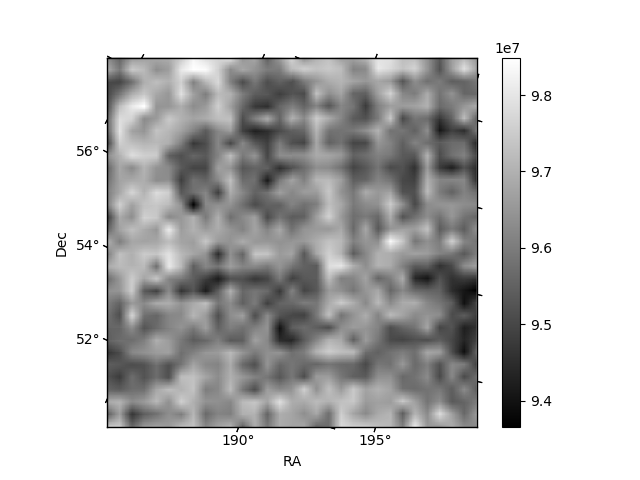
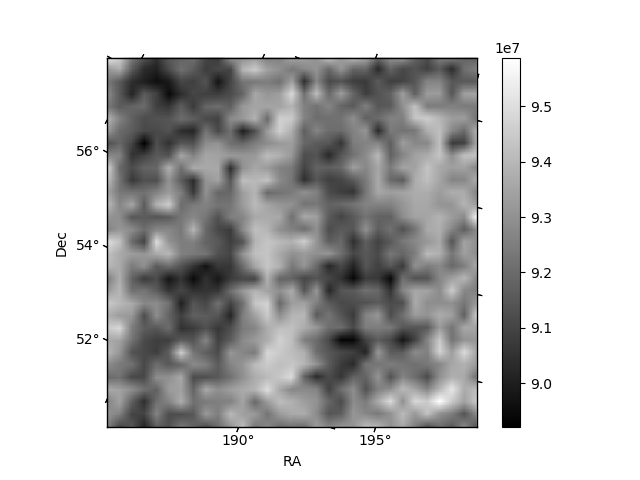
Histogram calculated using DETX and DETY for each event in the final _common_clean file
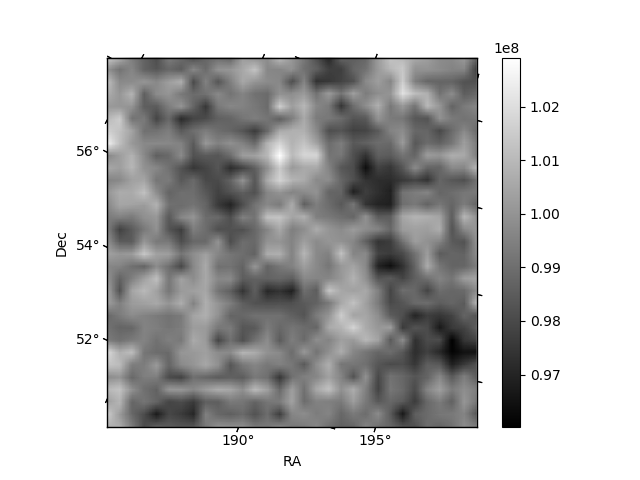
| Quadrant A | 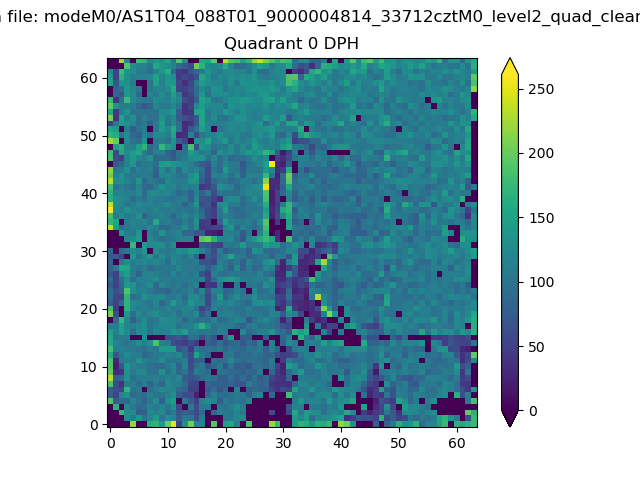 |
 |
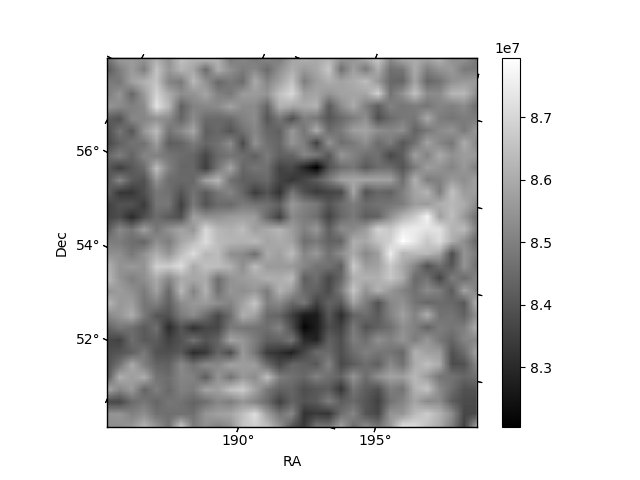
Quadrant B |
|---|---|---|---|
| Quadrant D | 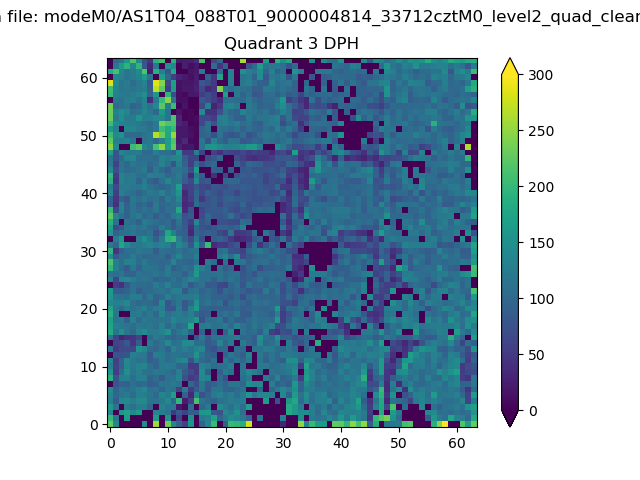 |
 |
Quadrant C |
| Plot type | Count rate plots | Images |
|---|---|---|
| Comparison with Poisson distribution Blue bars denote a histogram of data divided into 1 sec bins. Red curve is a Poisson curve with rate = median count rate of data. |
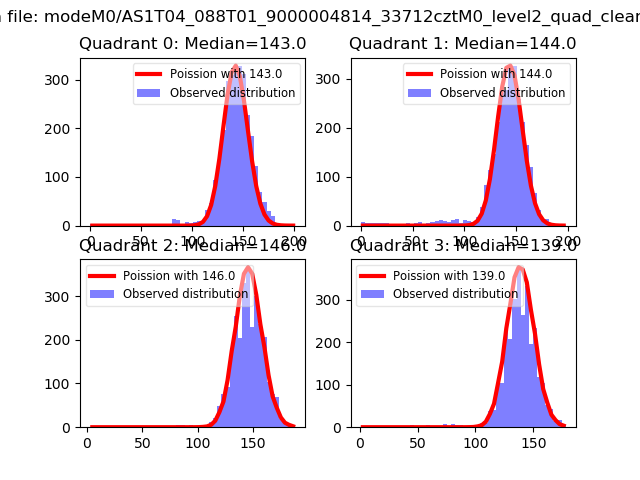 |
 |
| Quadrant-wise count rates Data is divided into 100 sec bins |
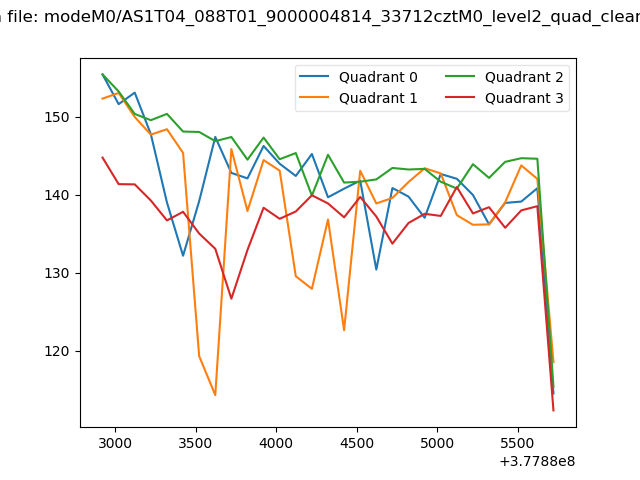 |
|
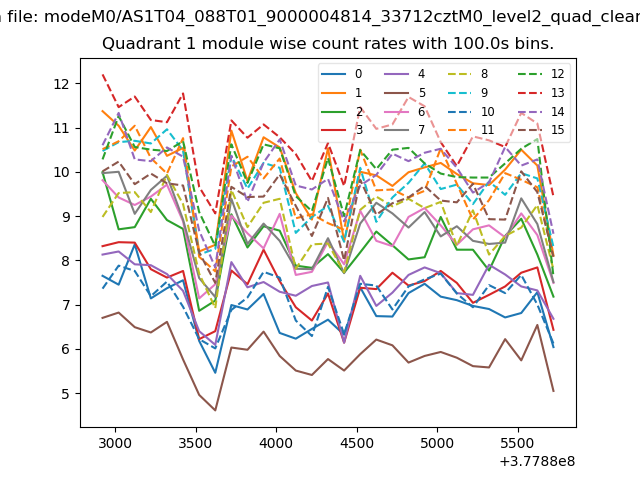
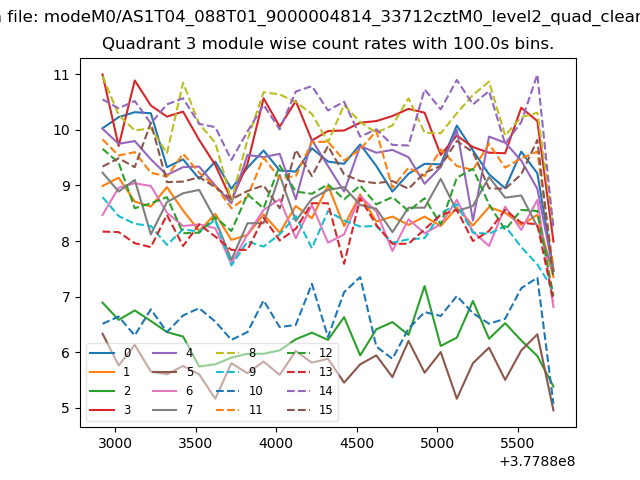
| Module-wise count rates for Quadrant A Data is divided into 100 sec bins |
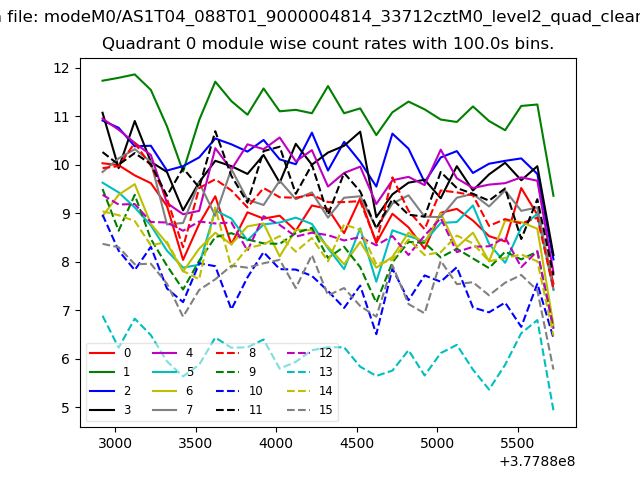 |
 |
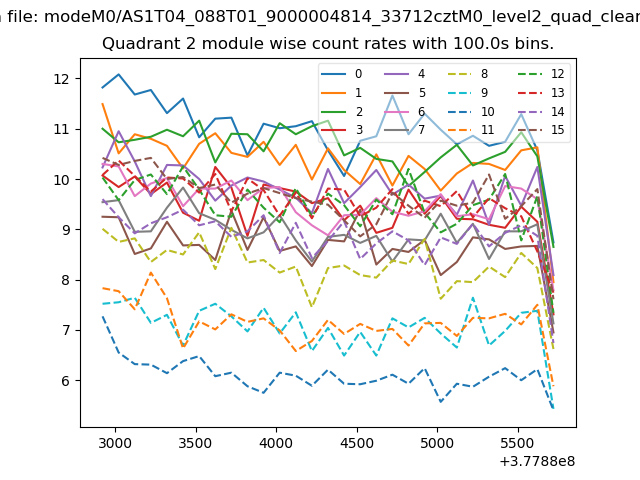
| Module-wise count rates for Quadrant B Data is divided into 100 sec bins |
 |
 |
| Module-wise count rates for Quadrant C Data is divided into 100 sec bins |
 |
 |
| Module-wise count rates for Quadrant D Data is divided into 100 sec bins |
 |
 |
| Parameter | Plot |
|---|---|
| CZT HV Monitor | 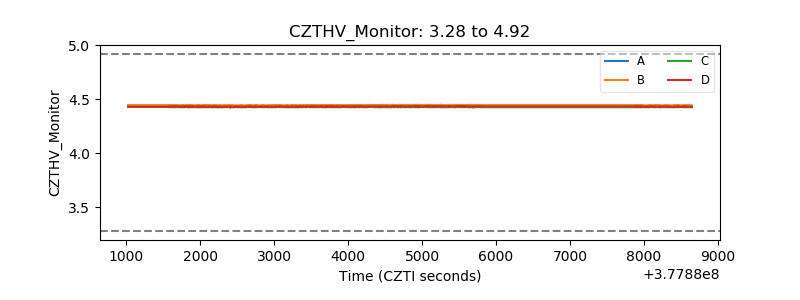 |
| D_VDD |  |
| Temperature 1 | 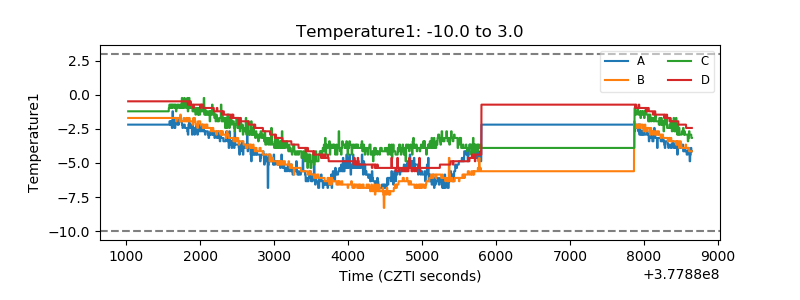 |
| Veto HV Monitor |  |
| Veto LLD | 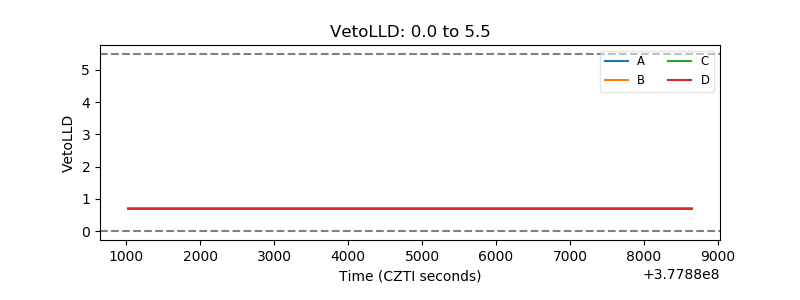 |
| Alpha Counter | 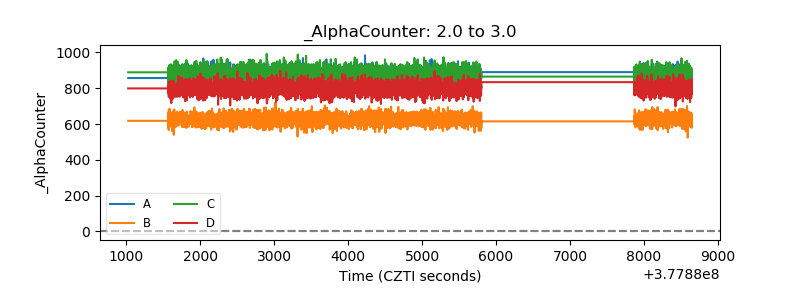 |
| _CPM_Rate | 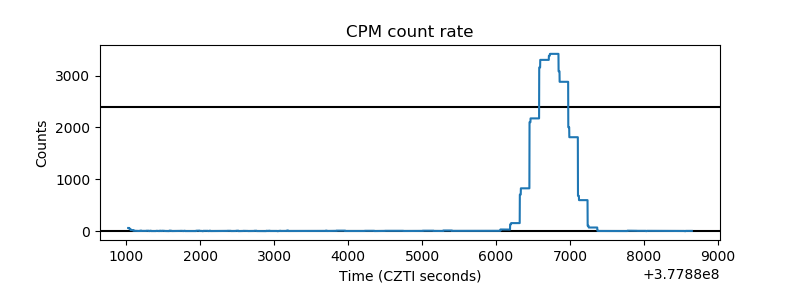 |
| CZT Counter | 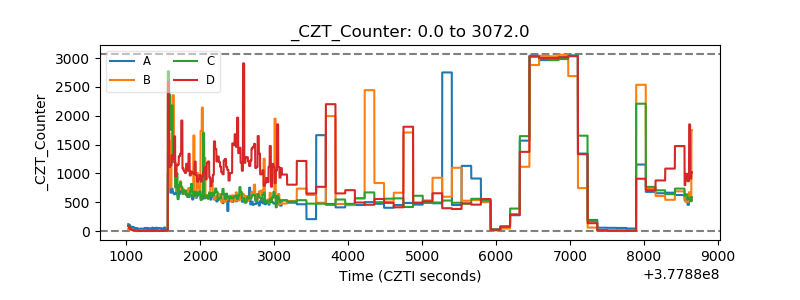 |
| +2.5 Volts monitor |  |
| +5 Volts monitor |  |
| _ROLL_ROT | 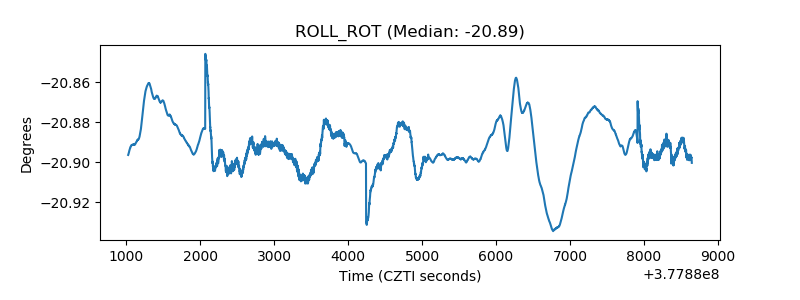 |
| _Roll_DEC | 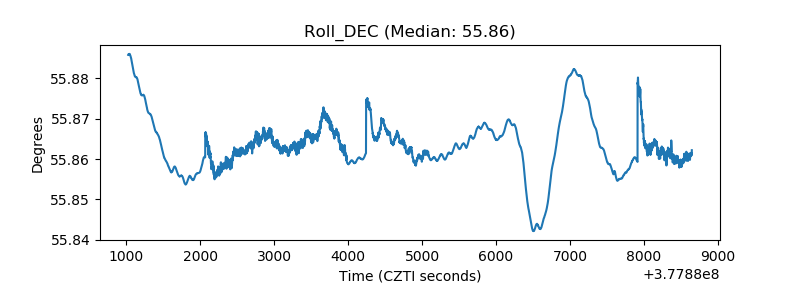 |
| _Roll_RA | 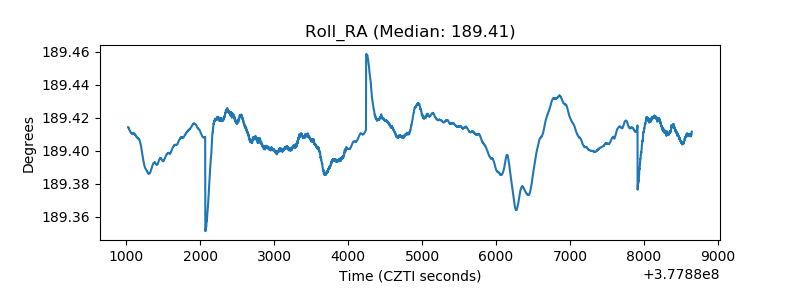 |
| Veto Counter | 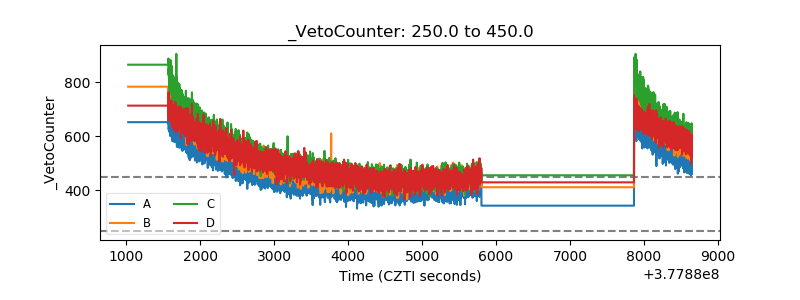 |