| Param | Original file | Final file |
|---|---|---|
| Filename | modeM0/AS1T04_088T01_9000004814_33713cztM0_level2.evt | modeM0/AS1T04_088T01_9000004814_33713cztM0_level2_quad_clean.evt |
| Size (bytes) | 473,797,440 | 78,045,120 |
| Size | 451.8 MB | 74.4 MB |
| Events in quadrant A | 2,716,787 | 512,080 |
| Events in quadrant B | 3,684,276 | 503,122 |
| Events in quadrant C | 2,989,689 | 527,781 |
| Events in quadrant D | 4,629,694 | 479,864 |
| Mode SS | |||
|---|---|---|---|
| Quadrant | BADHDUFLAG | Total packets | Discarded packets |
| A | 0 | 98 | 0 |
| B | 0 | 98 | 0 |
| C | 0 | 98 | 0 |
| D | 0 | 98 | 0 |
| Mode M0 | |||
|---|---|---|---|
| Quadrant | BADHDUFLAG | Total packets | Discarded packets |
| A | 0 | 11091 | 3 |
| B | 0 | 14151 | 2 |
| C | 0 | 11935 | 2 |
| D | 0 | 17348 | 2 |
| Mode M9 | |||
|---|---|---|---|
| Quadrant | BADHDUFLAG | Total packets | Discarded packets |
| A | 0 | 23 | 0 |
| B | 0 | 23 | 0 |
| C | 0 | 23 | 0 |
| D | 0 | 24 | 0 |
| Quadrant | Total seconds | Saturated seconds | Saturation percentage |
|---|---|---|---|
| A | 4854 | 43 | 0.885867% |
| B | 4854 | 331 | 6.819118% |
| C | 4854 | 92 | 1.895344% |
| D | 4854 | 239 | 4.923774% |
Noise dominated data is calculated using 1-second bins in cleaned event files. If a bin has >2000 counts, and if more than 50% of those come from <1% of pixels, then it is considered to be noise-dominated and hence unusable.
| Quadrant | # 1 sec bins | Bins with >0 counts | Bins with >2000 counts | High rate bins dominated by noise | Noise dominated (total time) | Noise dominated (detector-on time) | Marked lightcurve |
|---|---|---|---|---|---|---|---|
| A | 6978 | 4856 | 39 | 39 | 0.56% | 0.80% | 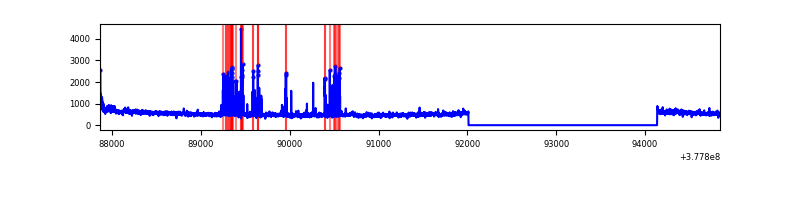 |
| B | 6978 | 4856 | 264 | 264 | 3.78% | 5.44% | 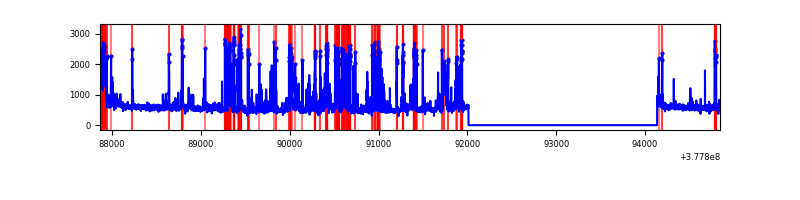 |
| C | 6978 | 4856 | 66 | 66 | 0.95% | 1.36% | 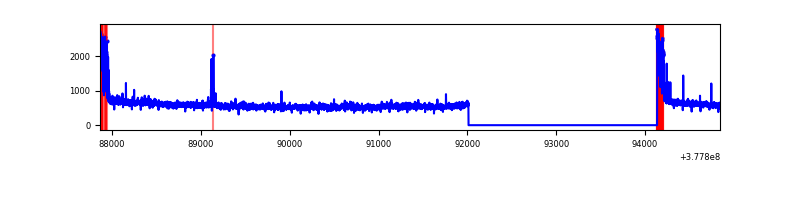 |
| D | 6978 | 4856 | 223 | 223 | 3.20% | 4.59% | 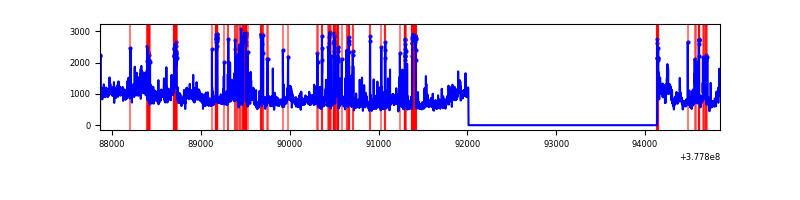 |
Top three noisy pixels from each quadrant. If the there are fewer than three noisy pixels in the level2.evt file, extra rows are filled as -1
| Pixel properties | Quadrant properties | ||||||
|---|---|---|---|---|---|---|---|
| Quadrant | DetID | PixID | Counts | Sigma | Mean | Median | Sigma |
| A | 15 | 237 | 222755 | 1801.91 | 628 | 618 | 123.3 |
| A | 14 | 4 | 52166 | 418.14 | 628 | 618 | 123.3 |
| A | 13 | 6 | 12284 | 94.63 | 628 | 618 | 123.3 |
| B | 5 | 172 | 1044077 | 9212.27 | 615 | 600 | 113.3 |
| B | 15 | 222 | 92579 | 812.03 | 615 | 600 | 113.3 |
| B | 4 | 170 | 22355 | 192.06 | 615 | 600 | 113.3 |
| C | 0 | 10 | 226299 | 1601.81 | 623 | 630 | 140.9 |
| C | 15 | 214 | 225027 | 1592.78 | 623 | 630 | 140.9 |
| C | 14 | 67 | 53514 | 375.37 | 623 | 630 | 140.9 |
| D | 1 | 52 | 1162191 | 7262.44 | 605 | 592 | 159.9 |
| D | 13 | 249 | 405747 | 2533.07 | 605 | 592 | 159.9 |
| D | 8 | 195 | 366843 | 2289.84 | 605 | 592 | 159.9 |
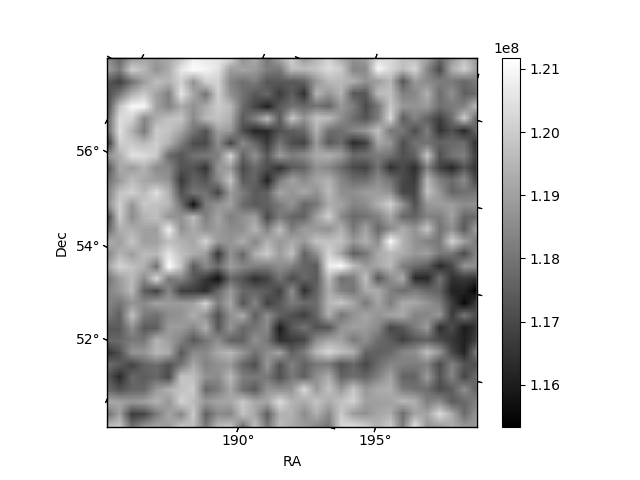
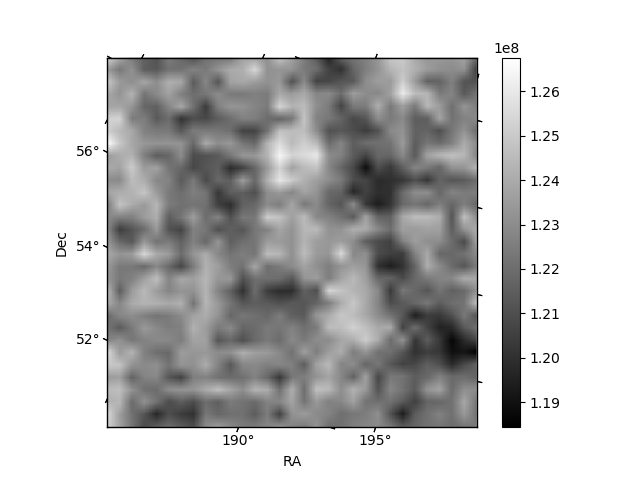
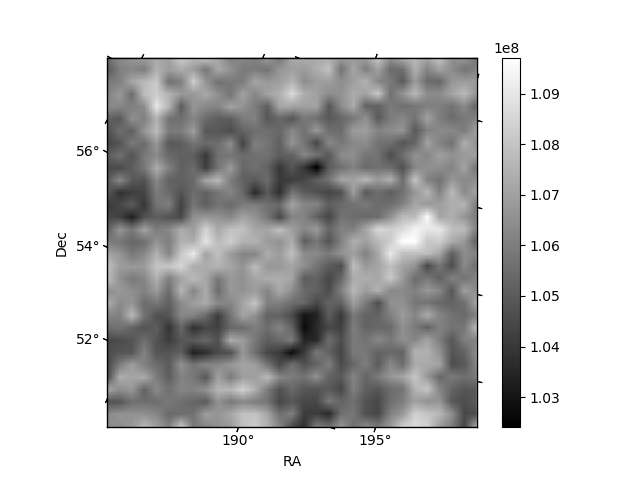
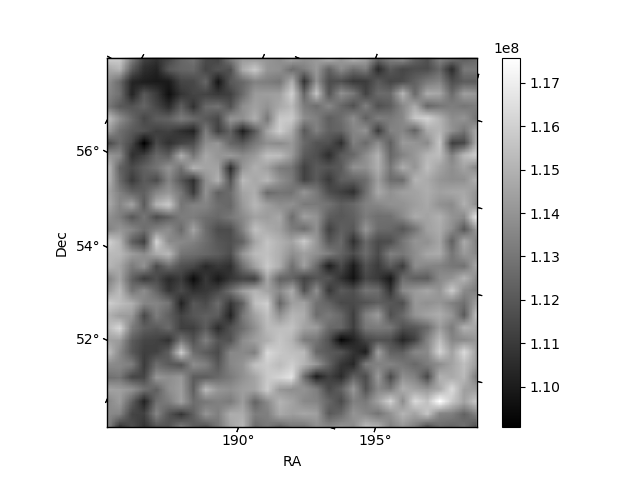
Histogram calculated using DETX and DETY for each event in the final _common_clean file
| Quadrant A | 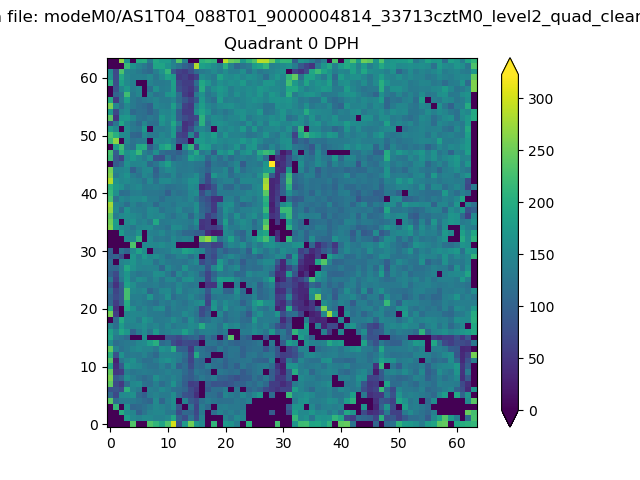 |
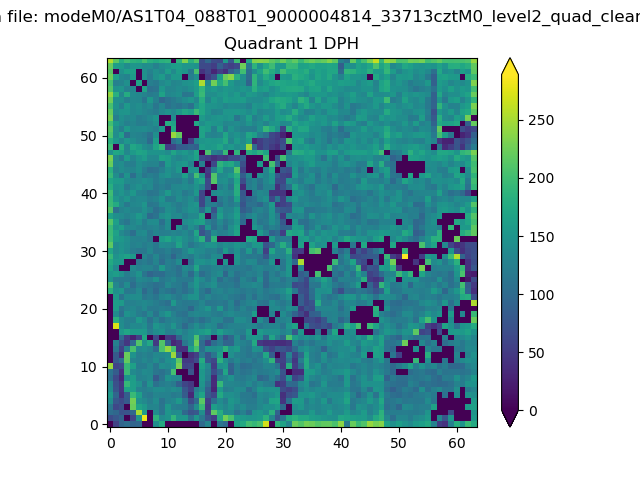 |
Quadrant B |
|---|---|---|---|
| Quadrant D | 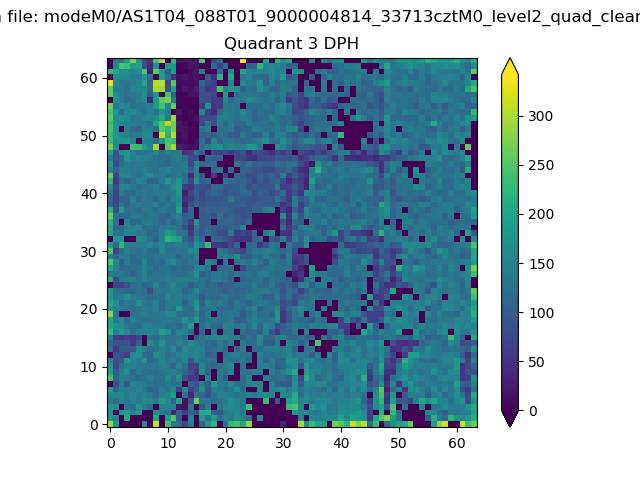 |
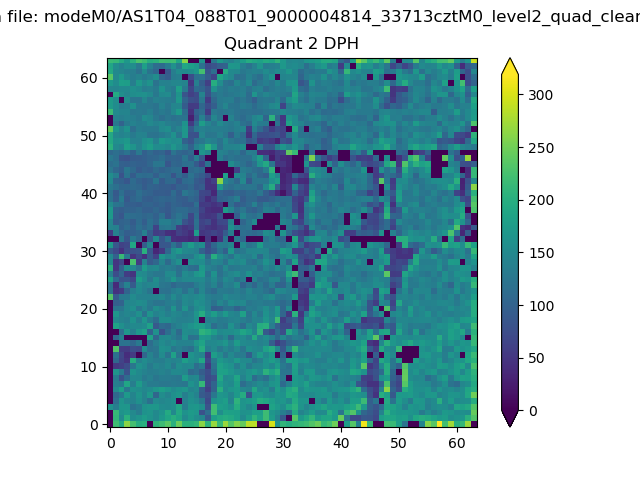 |
Quadrant C |
| Plot type | Count rate plots | Images |
|---|---|---|
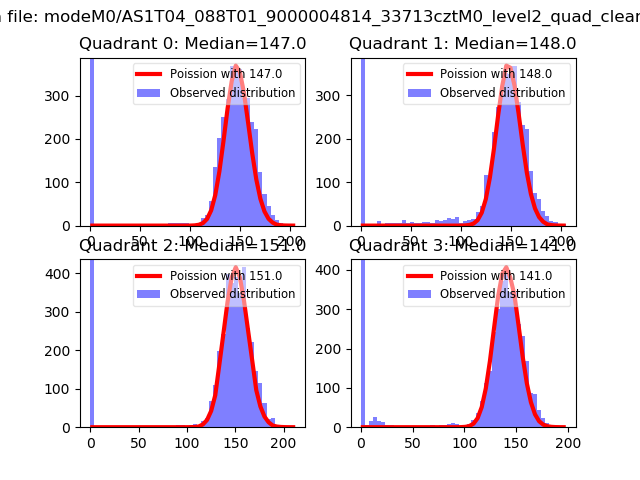
| Comparison with Poisson distribution Blue bars denote a histogram of data divided into 1 sec bins. Red curve is a Poisson curve with rate = median count rate of data. |
 |
 |
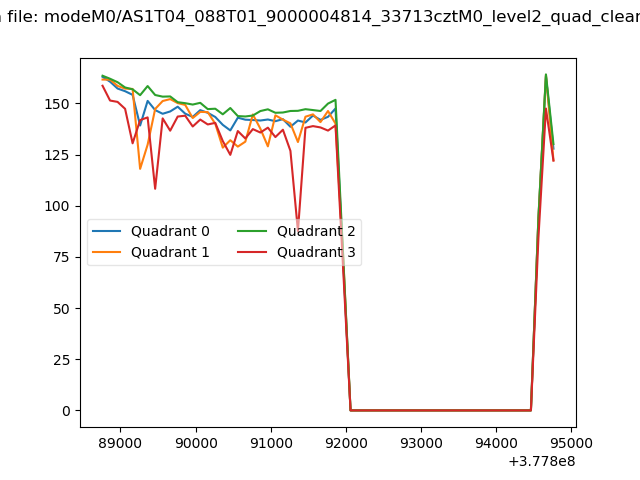
| Quadrant-wise count rates Data is divided into 100 sec bins |
 |
|
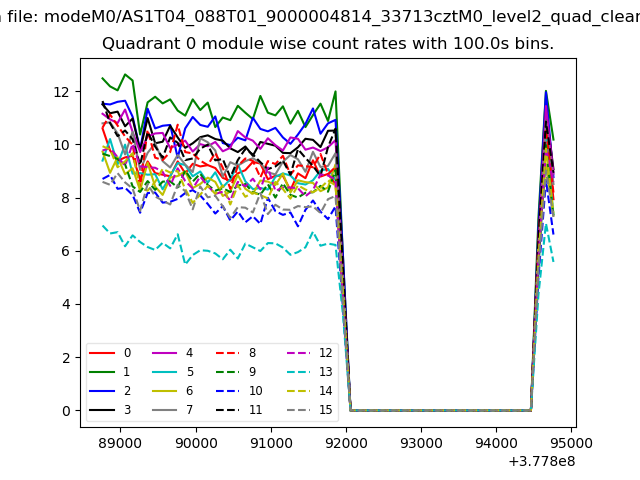
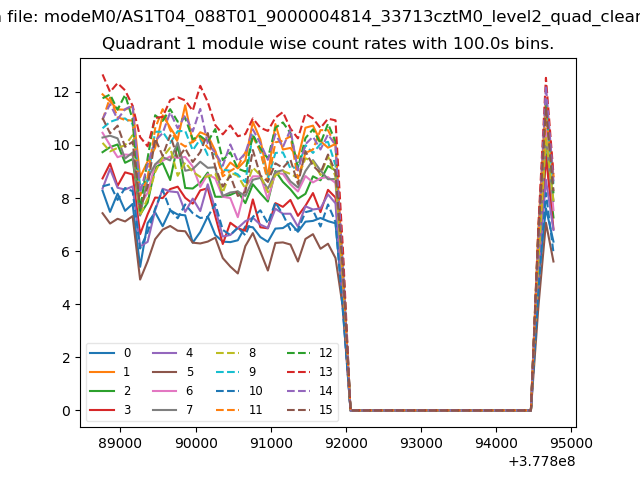
| Module-wise count rates for Quadrant A Data is divided into 100 sec bins |
 |
 |
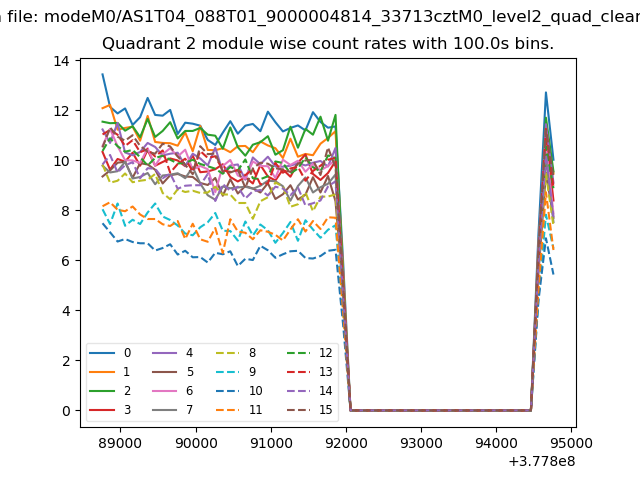
| Module-wise count rates for Quadrant B Data is divided into 100 sec bins |
 |
 |
| Module-wise count rates for Quadrant C Data is divided into 100 sec bins |
 |
 |
| Module-wise count rates for Quadrant D Data is divided into 100 sec bins |
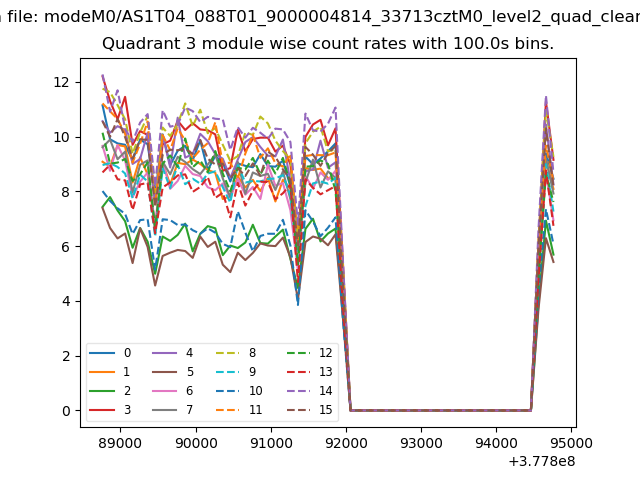 |
 |
| Parameter | Plot |
|---|---|
| CZT HV Monitor | 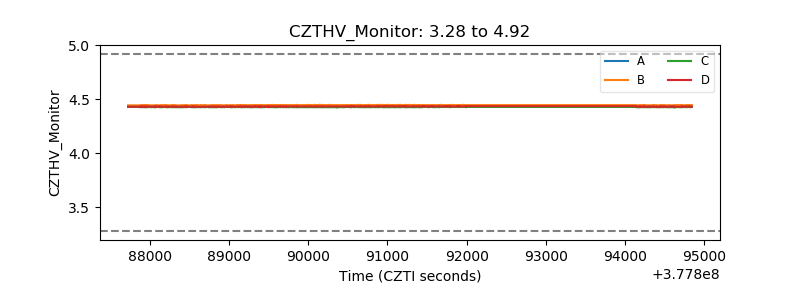 |
| D_VDD | 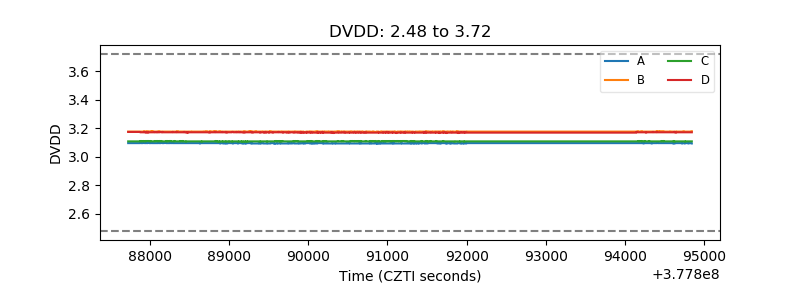 |
| Temperature 1 | 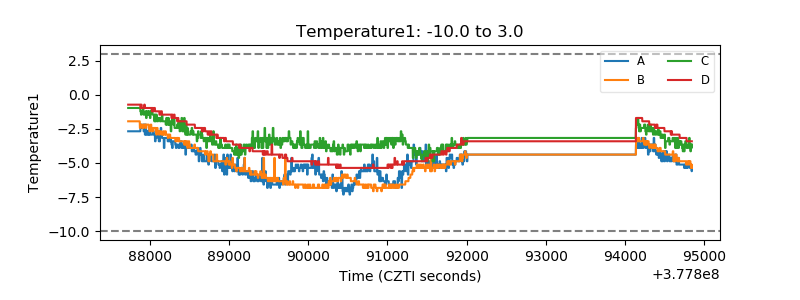 |
| Veto HV Monitor |  |
| Veto LLD | 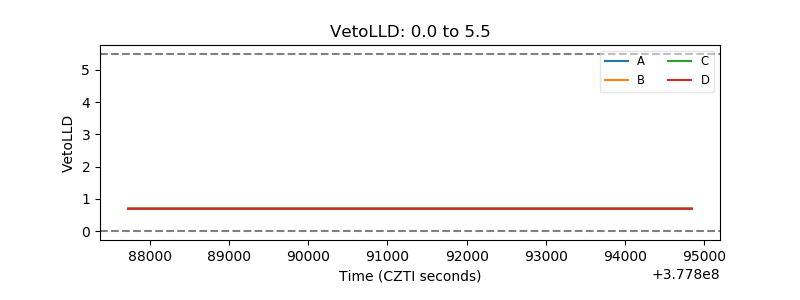 |
| Alpha Counter | 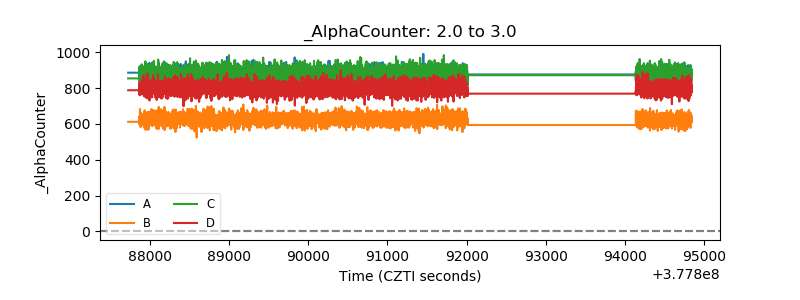 |
| _CPM_Rate | 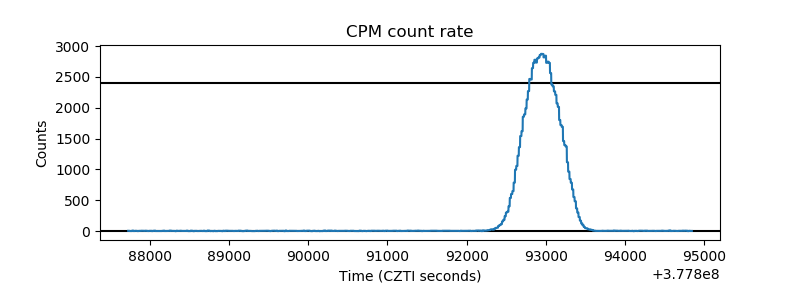 |
| CZT Counter | 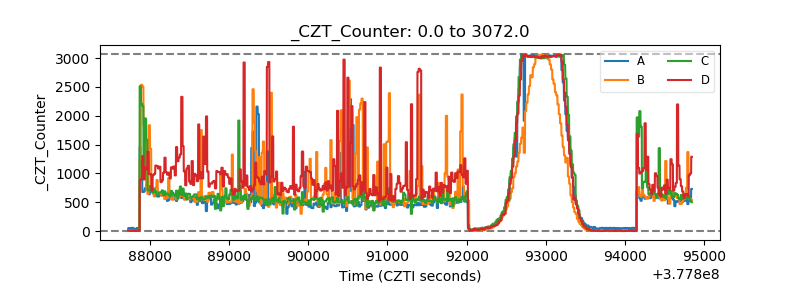 |
| +2.5 Volts monitor | 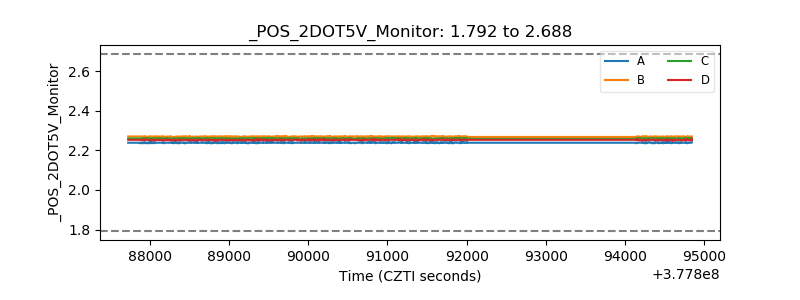 |
| +5 Volts monitor | 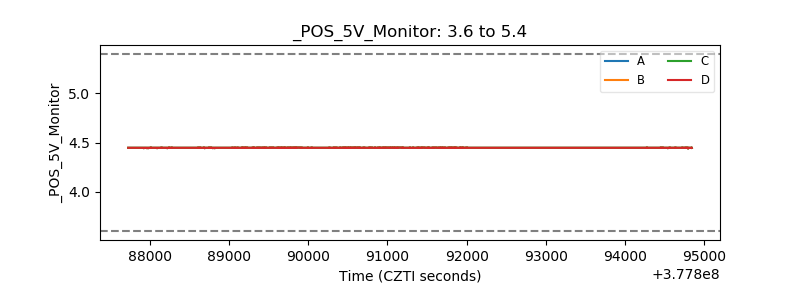 |
| _ROLL_ROT | 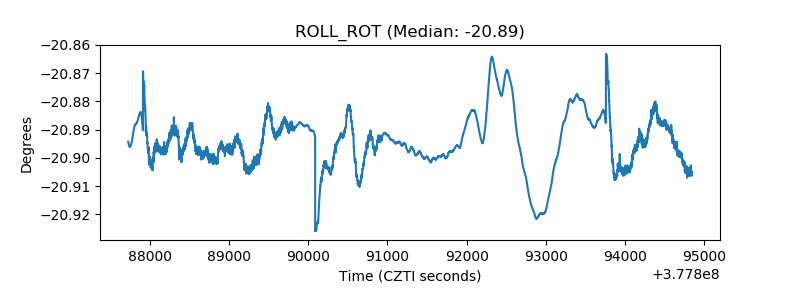 |
| _Roll_DEC | 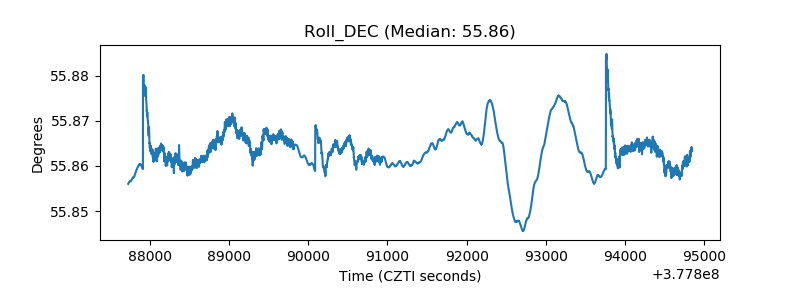 |
| _Roll_RA | 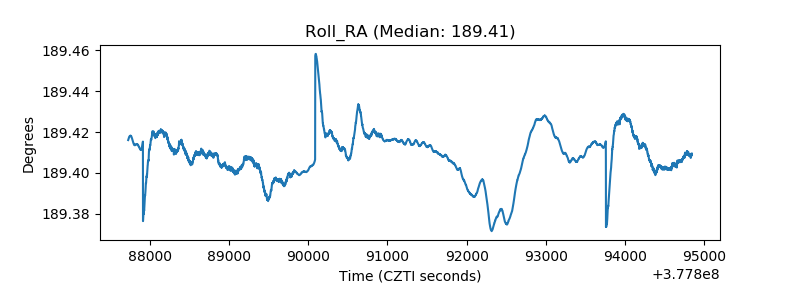 |
| Veto Counter | 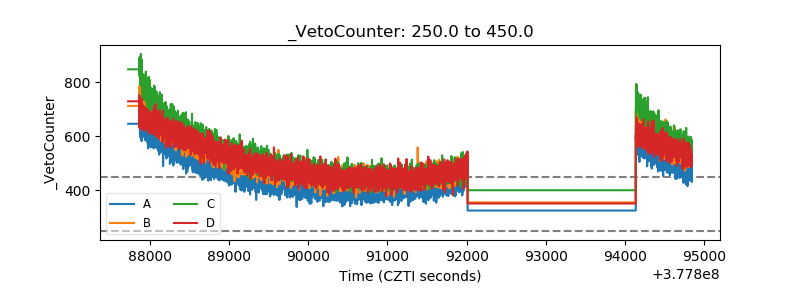 |