| Param | Original file | Final file |
|---|---|---|
| Filename | modeM0/AS1T04_088T01_9000004814_33715cztM0_level2.evt | modeM0/AS1T04_088T01_9000004814_33715cztM0_level2_quad_clean.evt |
| Size (bytes) | 134,861,760 | 25,822,080 |
| Size | 128.6 MB | 24.6 MB |
| Events in quadrant A | 764,053 | 172,479 |
| Events in quadrant B | 844,479 | 178,240 |
| Events in quadrant C | 801,558 | 179,102 |
| Events in quadrant D | 1,584,899 | 155,597 |
| Mode SS | |||
|---|---|---|---|
| Quadrant | BADHDUFLAG | Total packets | Discarded packets |
| A | 0 | 26 | 0 |
| B | 0 | 26 | 0 |
| C | 0 | 26 | 0 |
| D | 0 | 26 | 0 |
| Mode M0 | |||
|---|---|---|---|
| Quadrant | BADHDUFLAG | Total packets | Discarded packets |
| A | 0 | 3057 | 1 |
| B | 0 | 3348 | 1 |
| C | 0 | 3114 | 1 |
| D | 0 | 5622 | 1 |
| Mode M9 | |||
|---|---|---|---|
| Quadrant | BADHDUFLAG | Total packets | Discarded packets |
| A | 0 | 14 | 0 |
| B | 0 | 14 | 0 |
| C | 0 | 14 | 0 |
| D | 0 | 15 | 0 |
| Quadrant | Total seconds | Saturated seconds | Saturation percentage |
|---|---|---|---|
| A | 1276 | 52 | 4.075235% |
| B | 1276 | 36 | 2.821317% |
| C | 1276 | 29 | 2.272727% |
| D | 1276 | 176 | 13.793103% |
Noise dominated data is calculated using 1-second bins in cleaned event files. If a bin has >2000 counts, and if more than 50% of those come from <1% of pixels, then it is considered to be noise-dominated and hence unusable.
| Quadrant | # 1 sec bins | Bins with >0 counts | Bins with >2000 counts | High rate bins dominated by noise | Noise dominated (total time) | Noise dominated (detector-on time) | Marked lightcurve |
|---|---|---|---|---|---|---|---|
| A | 1276 | 1276 | 43 | 43 | 3.37% | 3.37% | 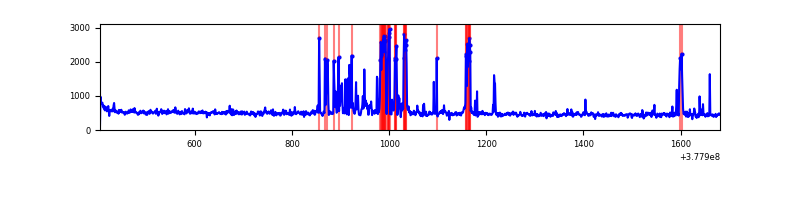 |
| B | 1276 | 1276 | 19 | 19 | 1.49% | 1.49% | 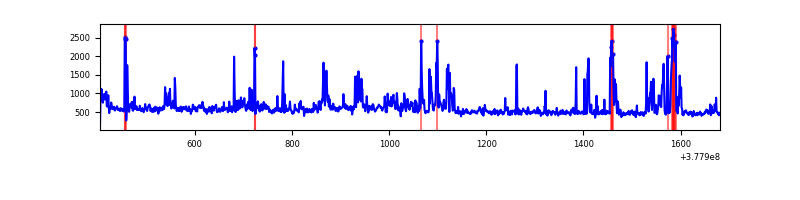 |
| C | 1276 | 1276 | 22 | 22 | 1.72% | 1.72% | 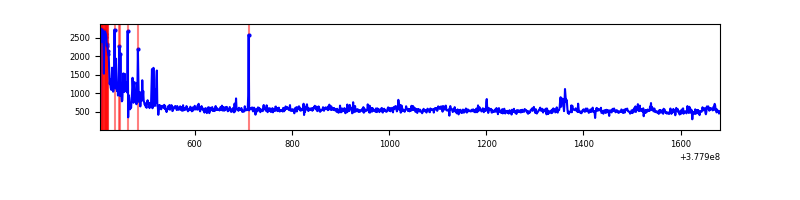 |
| D | 1276 | 1276 | 187 | 187 | 14.66% | 14.66% | 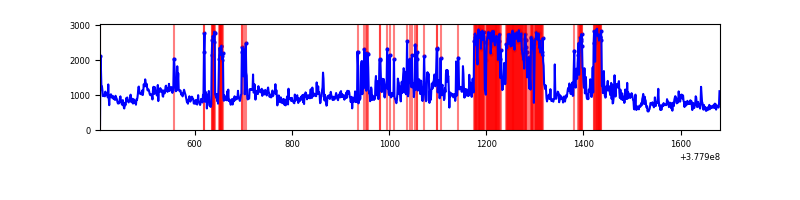 |
Top three noisy pixels from each quadrant. If the there are fewer than three noisy pixels in the level2.evt file, extra rows are filled as -1
| Pixel properties | Quadrant properties | ||||||
|---|---|---|---|---|---|---|---|
| Quadrant | DetID | PixID | Counts | Sigma | Mean | Median | Sigma |
| A | 15 | 237 | 160555 | 4973.38 | 154 | 151 | 32.3 |
| A | 10 | 83 | 4002 | 119.4 | 154 | 151 | 32.3 |
| A | 13 | 6 | 3794 | 112.95 | 154 | 151 | 32.3 |
| B | 5 | 172 | 109935 | 3443.03 | 159 | 154 | 31.9 |
| B | 4 | 170 | 55491 | 1735.52 | 159 | 154 | 31.9 |
| B | 5 | 255 | 24435 | 761.52 | 159 | 154 | 31.9 |
| C | 0 | 10 | 91303 | 2386.85 | 158 | 159 | 38.2 |
| C | 15 | 214 | 61515 | 1606.77 | 158 | 159 | 38.2 |
| C | 14 | 67 | 16776 | 435.16 | 158 | 159 | 38.2 |
| D | 1 | 52 | 330443 | 8129.29 | 145 | 142 | 40.6 |
| D | 7 | 38 | 235317 | 5788.07 | 145 | 142 | 40.6 |
| D | 2 | 120 | 152289 | 3744.61 | 145 | 142 | 40.6 |
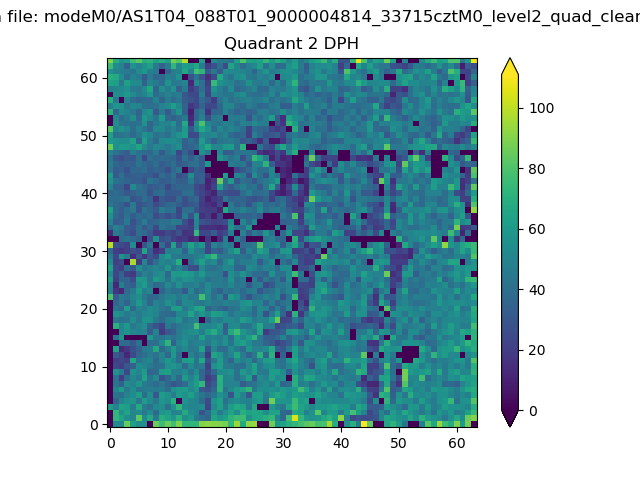
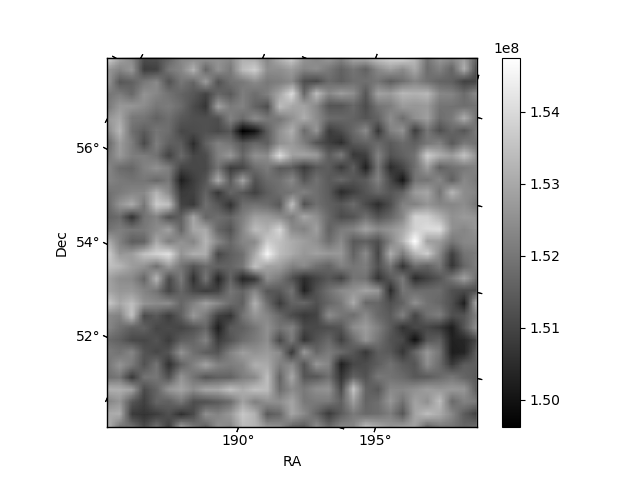
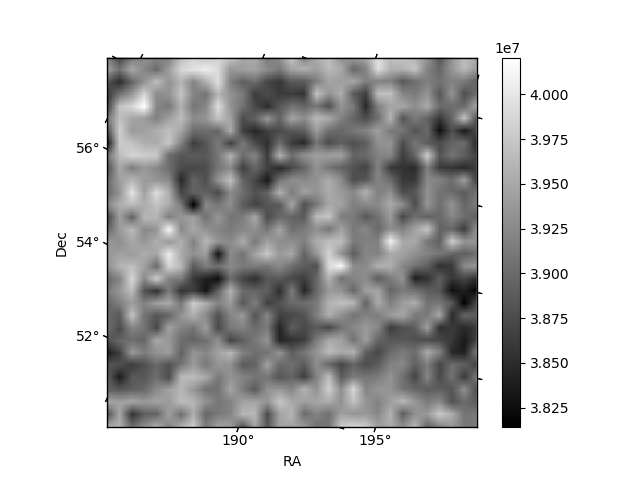
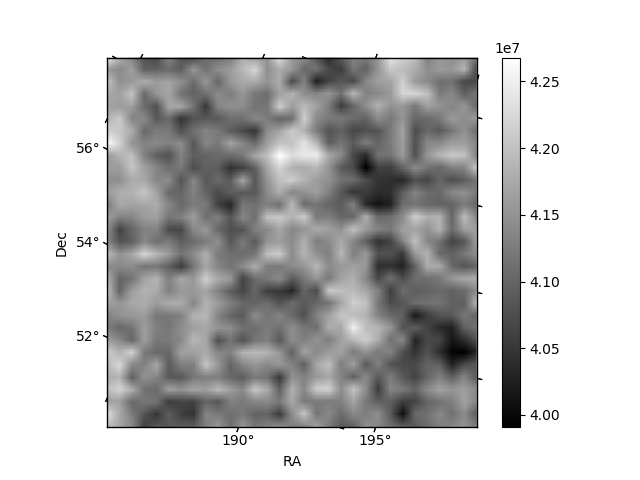
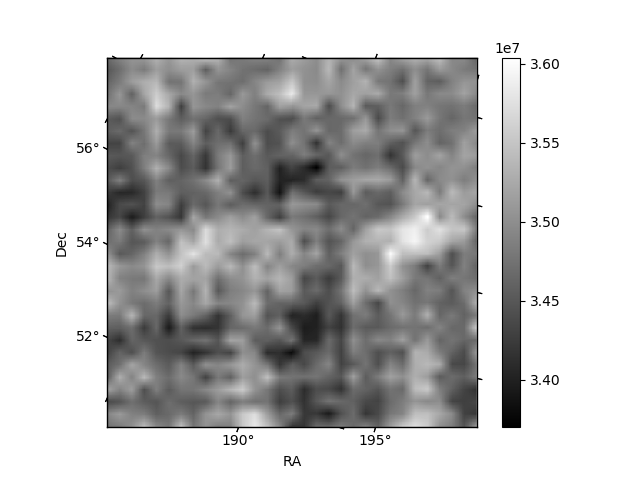
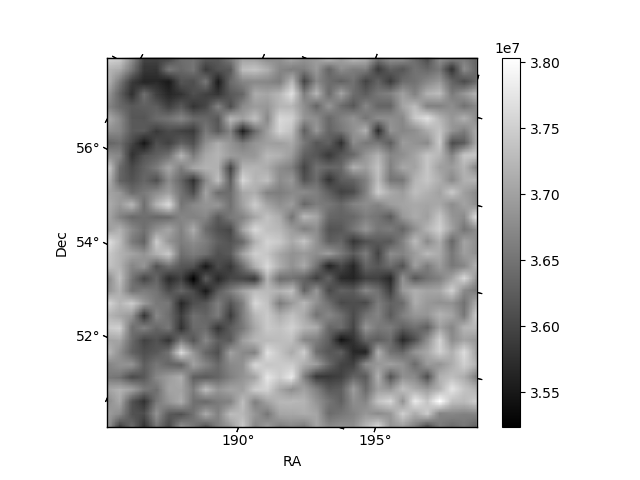
Histogram calculated using DETX and DETY for each event in the final _common_clean file
| Quadrant A | 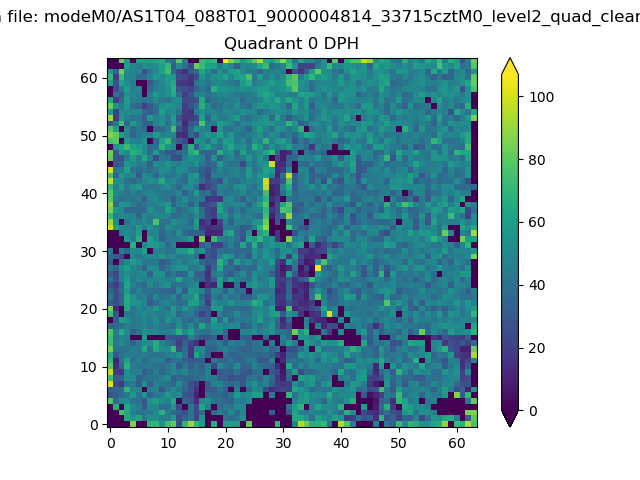 |
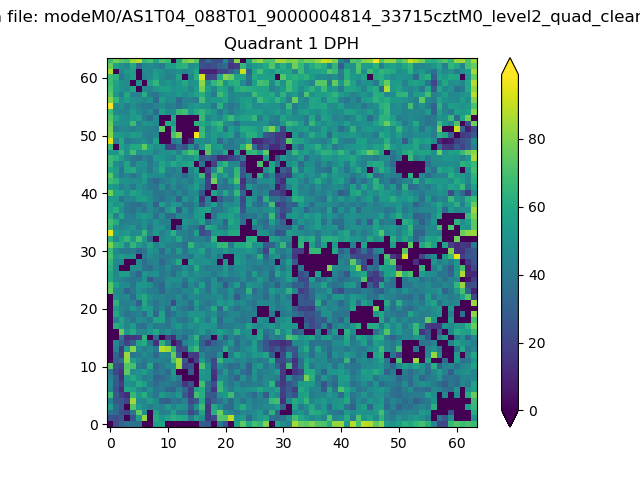 |
Quadrant B |
|---|---|---|---|
| Quadrant D | 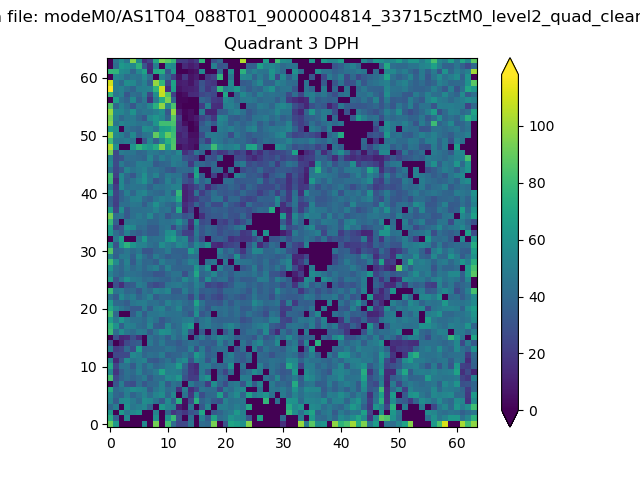 |
 |
Quadrant C |
| Plot type | Count rate plots | Images |
|---|---|---|
| Comparison with Poisson distribution Blue bars denote a histogram of data divided into 1 sec bins. Red curve is a Poisson curve with rate = median count rate of data. |
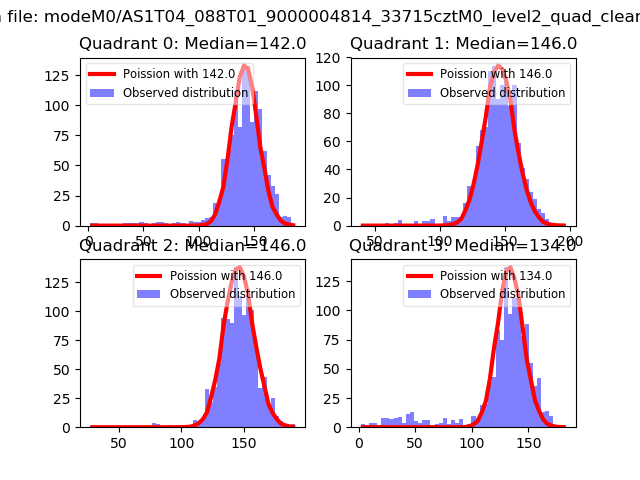 |
 |
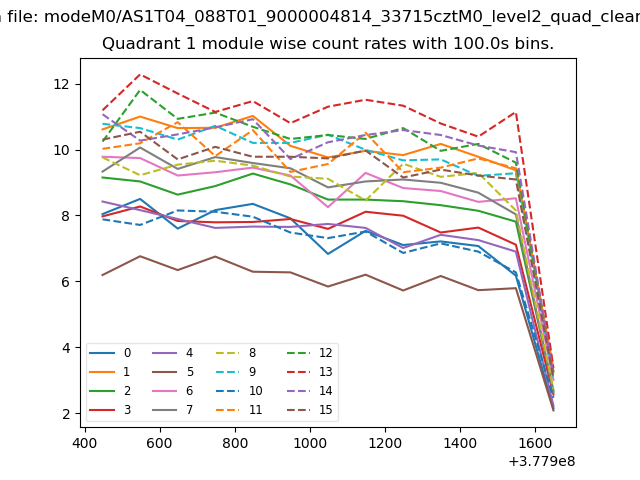
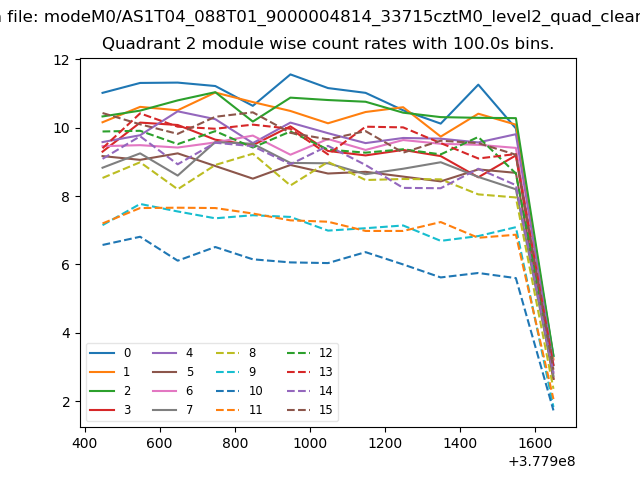
| Quadrant-wise count rates Data is divided into 100 sec bins |
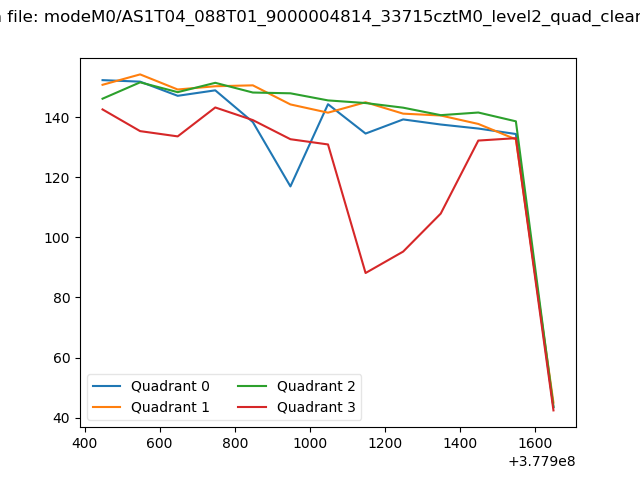 |
|
| Module-wise count rates for Quadrant A Data is divided into 100 sec bins |
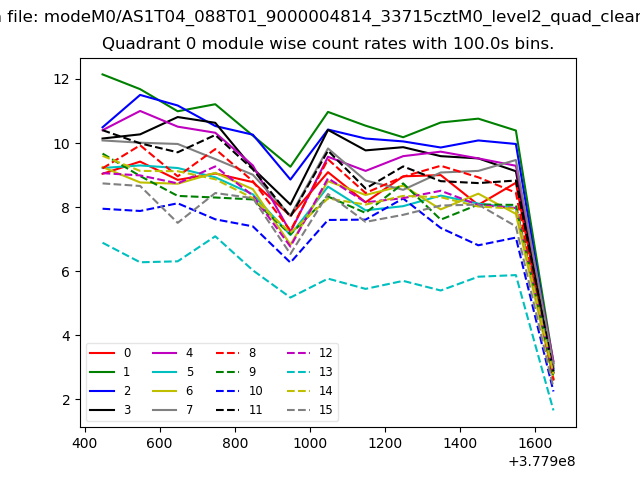 |
 |
| Module-wise count rates for Quadrant B Data is divided into 100 sec bins |
 |
 |
| Module-wise count rates for Quadrant C Data is divided into 100 sec bins |
 |
 |
| Module-wise count rates for Quadrant D Data is divided into 100 sec bins |
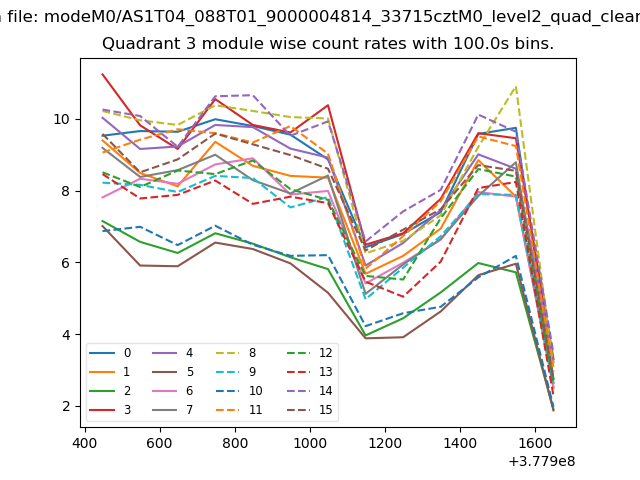 |
 |
| Parameter | Plot |
|---|---|
| CZT HV Monitor | 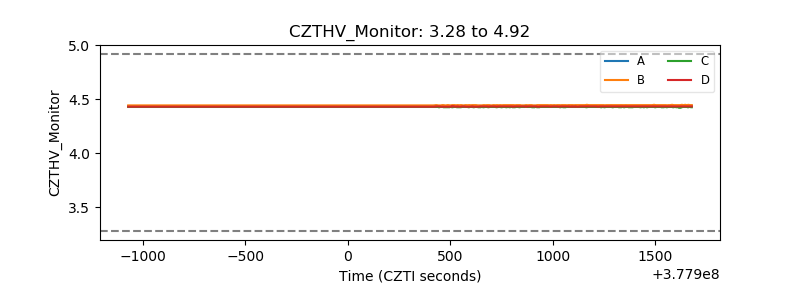 |
| D_VDD | 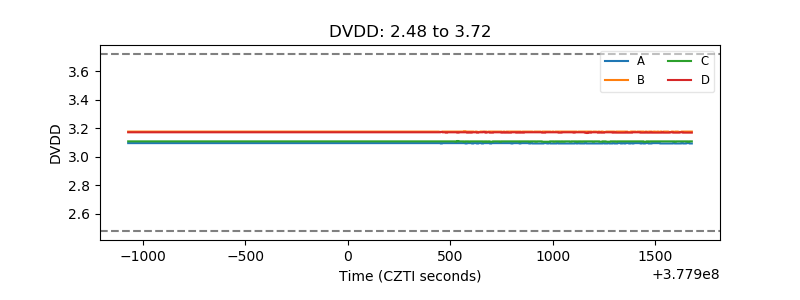 |
| Temperature 1 | 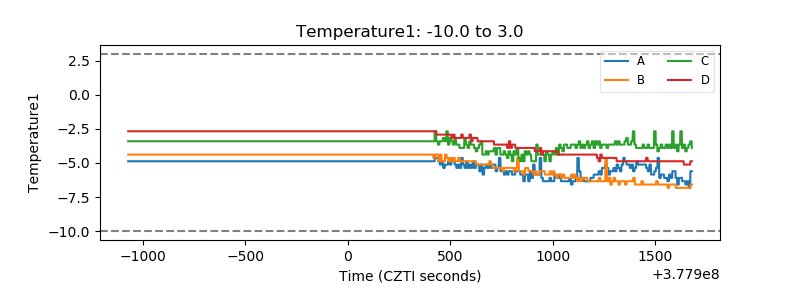 |
| Veto HV Monitor | 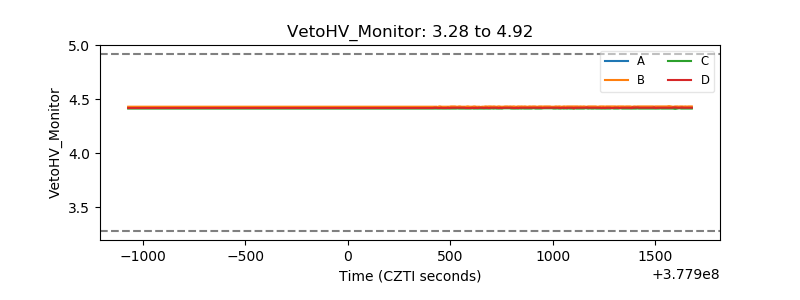 |
| Veto LLD | 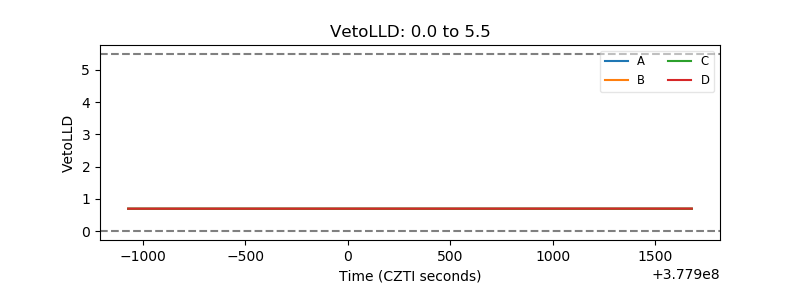 |
| Alpha Counter | 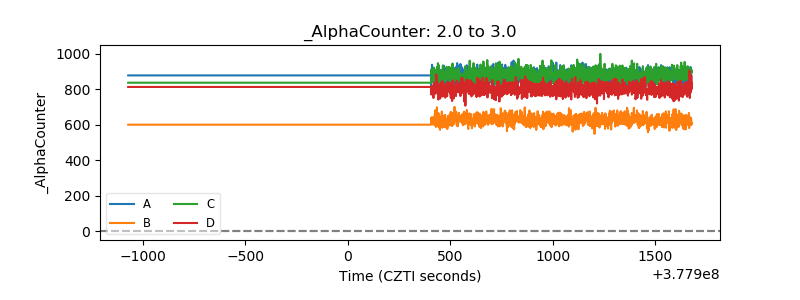 |
| _CPM_Rate | 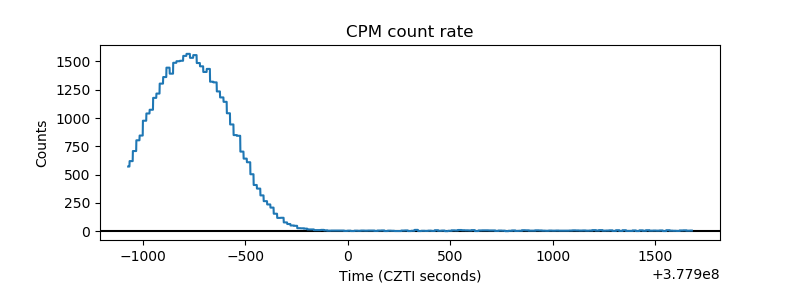 |
| CZT Counter | 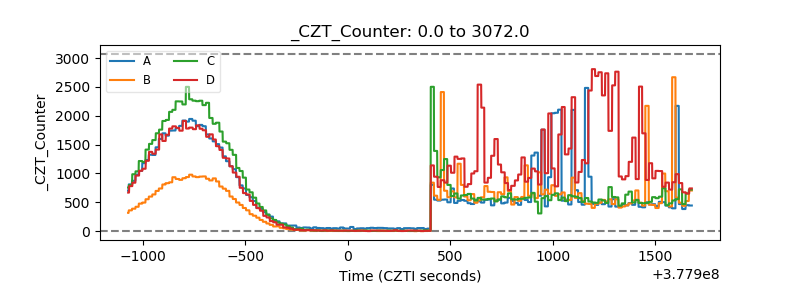 |
| +2.5 Volts monitor |  |
| +5 Volts monitor |  |
| _ROLL_ROT | 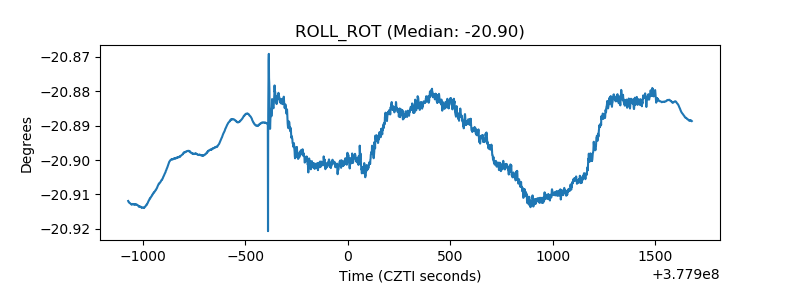 |
| _Roll_DEC | 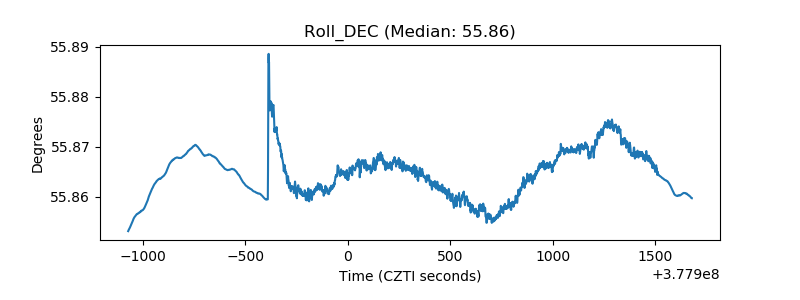 |
| _Roll_RA | 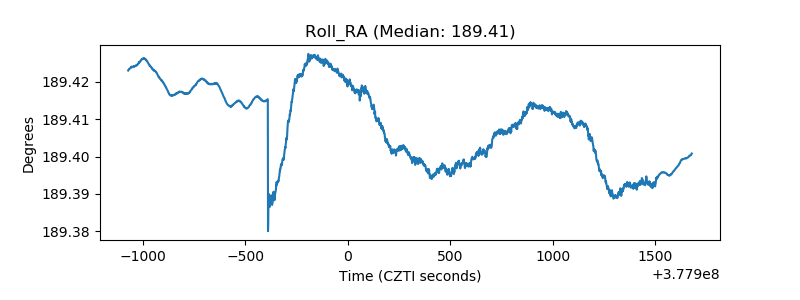 |
| Veto Counter | 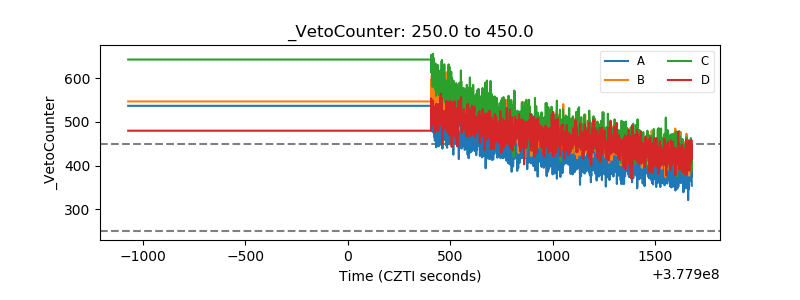 |